• Monitoring philosophies • Monitoring tools we use • Distributed Systems Monitoring • Security Monitoring • Dependency Monitoring • How we cheat by using Chef • How we validate our monitoring • Q and A
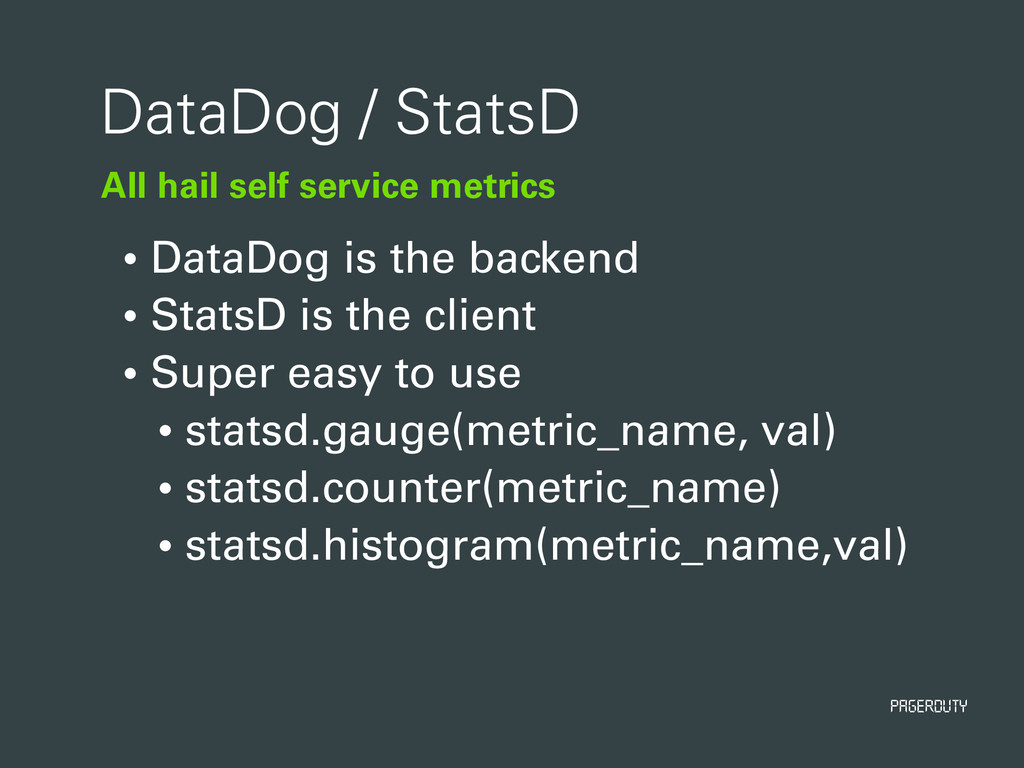
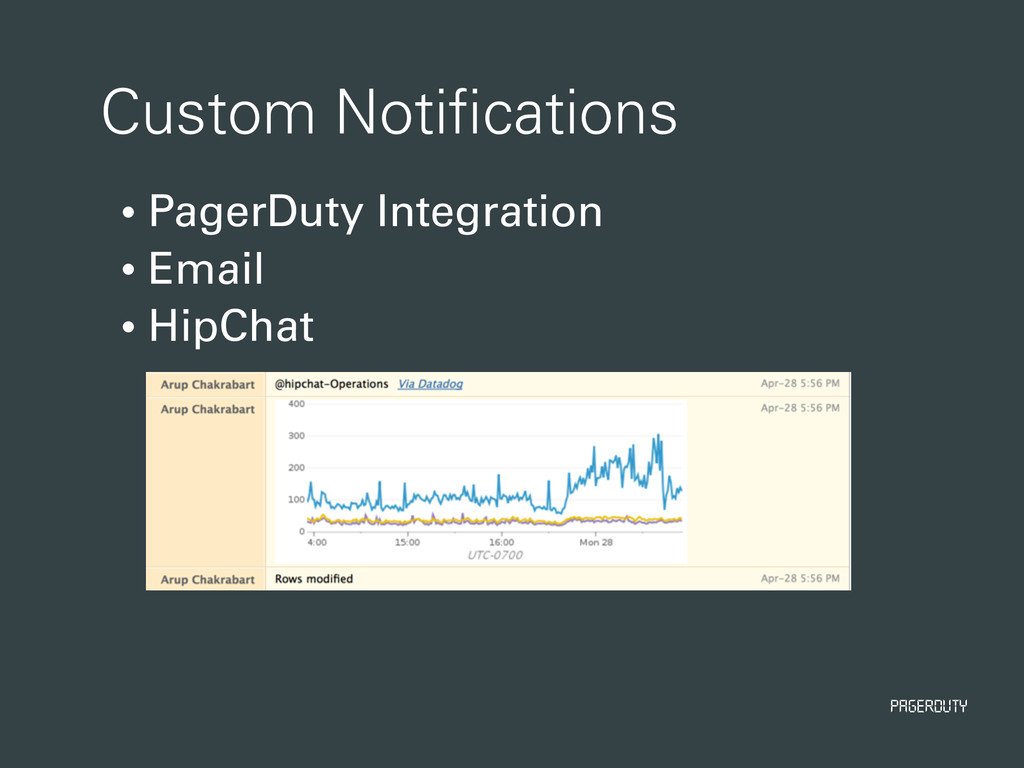
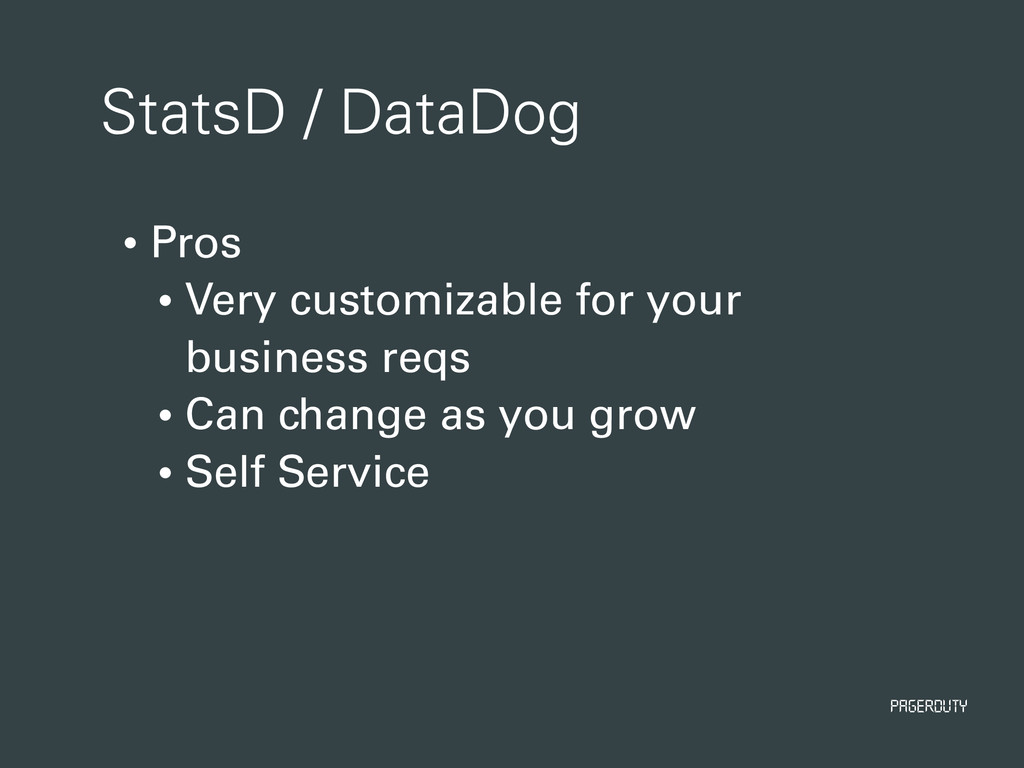
DataDog is the backend • StatsD is the client • Super easy to use • statsd.gauge(metric_name, val) • statsd.counter(metric_name) • statsd.histogram(metric_name,val)
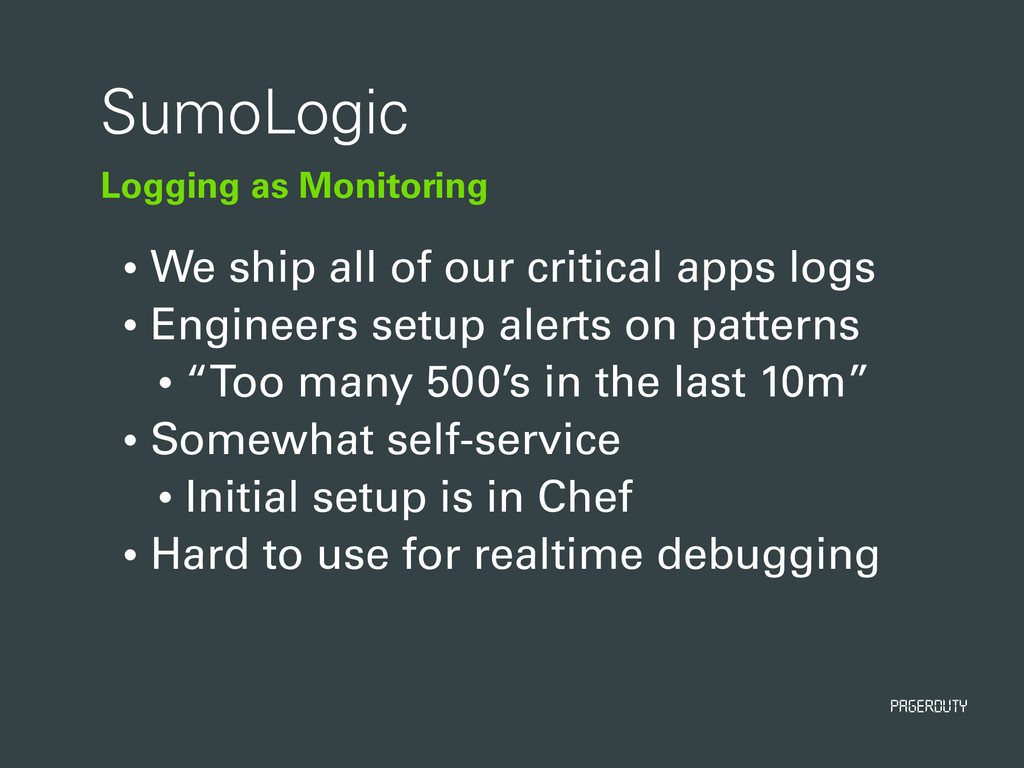
our critical apps logs • Engineers setup alerts on patterns • “Too many 500’s in the last 10m” • Somewhat self-service • Initial setup is in Chef • Hard to use for realtime debugging
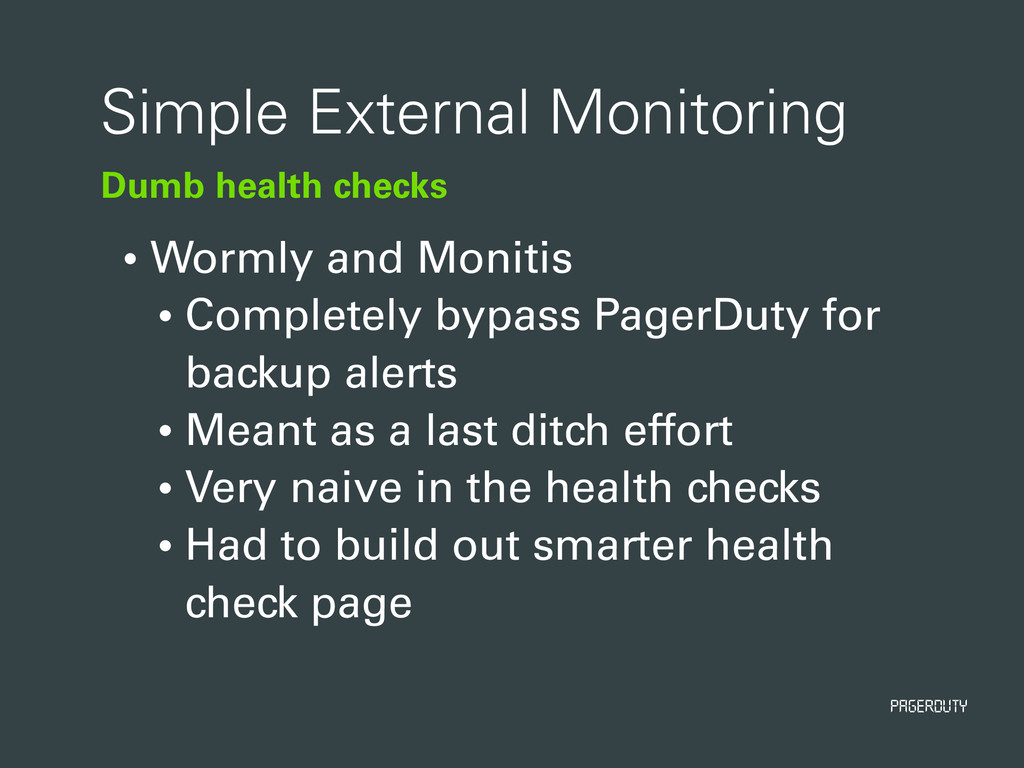
Monitis • Completely bypass PagerDuty for backup alerts • Meant as a last ditch effort • Very naive in the health checks • Had to build out smarter health check page
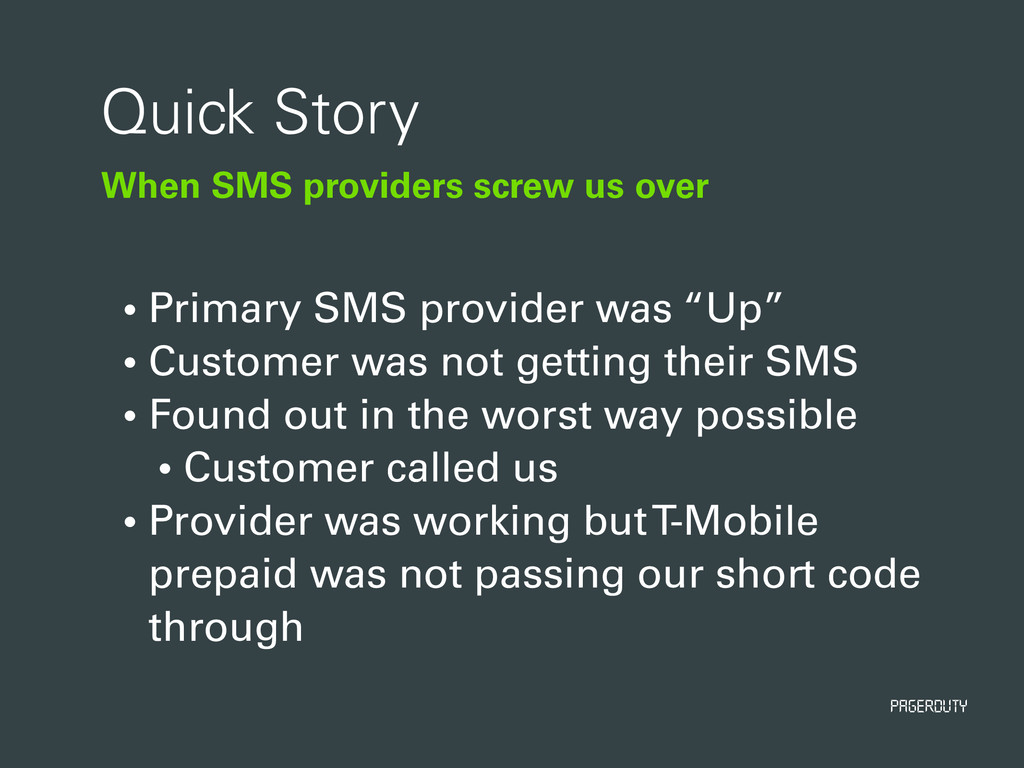
Primary SMS provider was “Up” • Customer was not getting their SMS • Found out in the worst way possible • Customer called us • Provider was working but T-Mobile prepaid was not passing our short code through
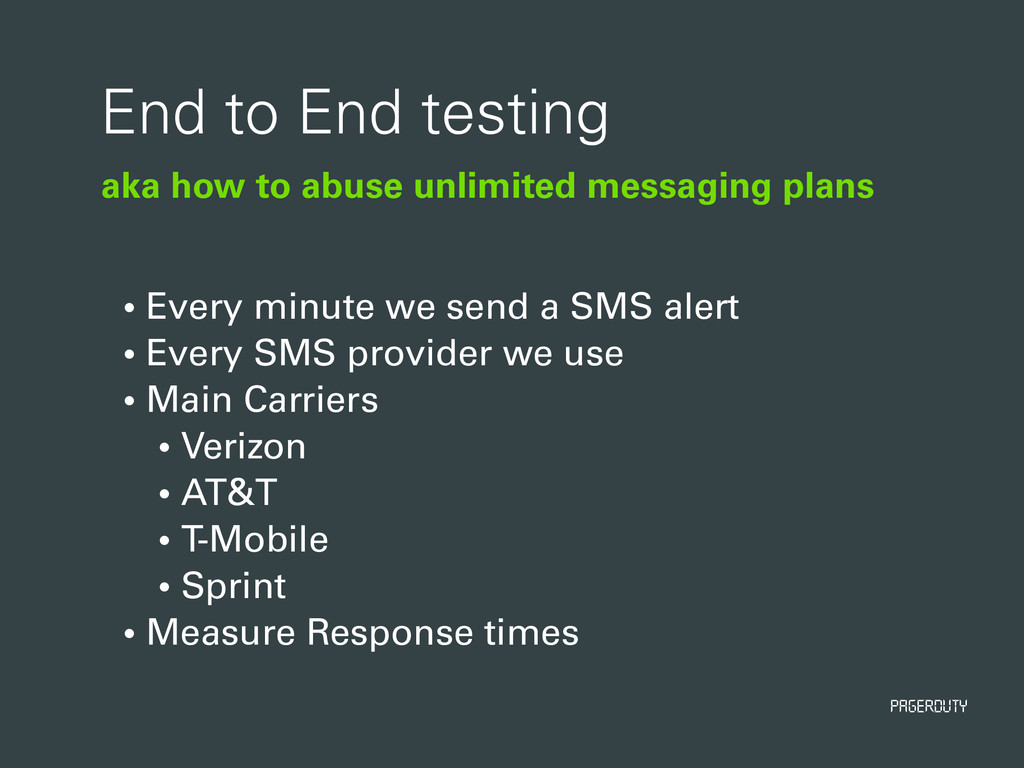
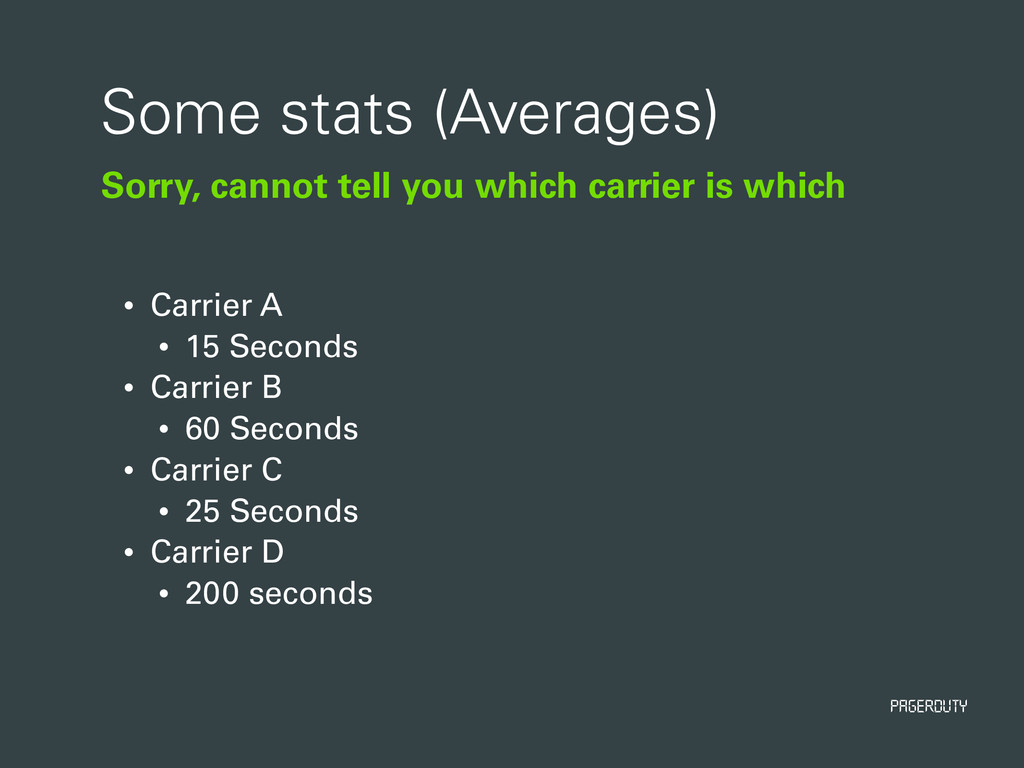
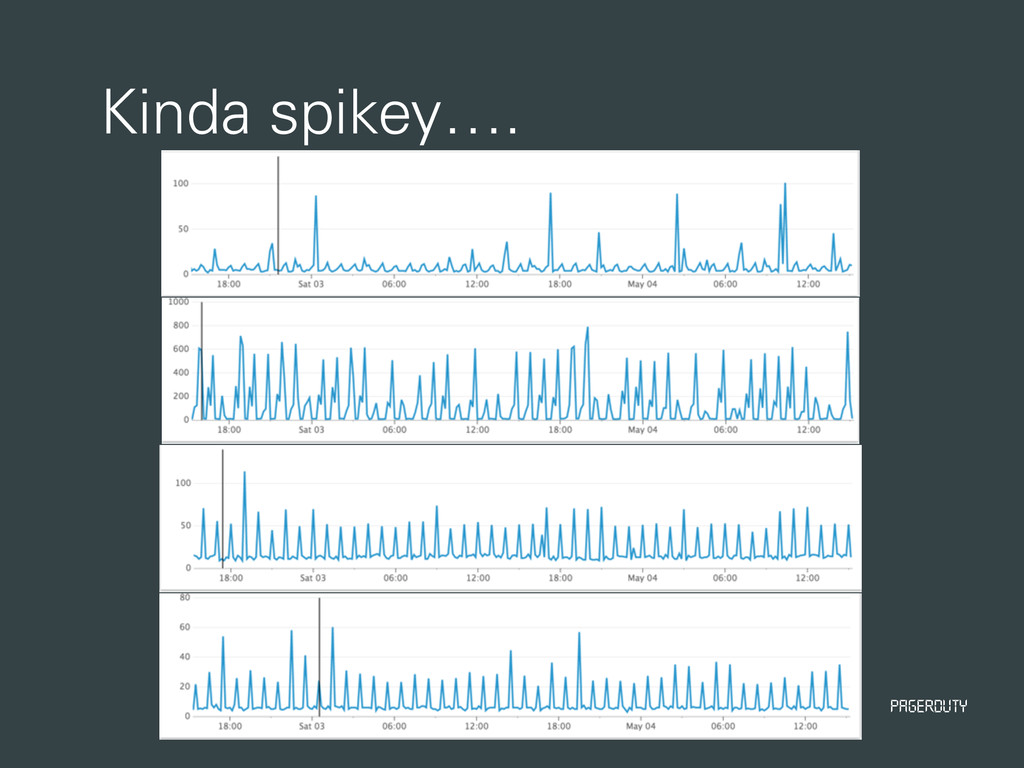
End testing • Every minute we send a SMS alert • Every SMS provider we use • Main Carriers • Verizon • AT&T • T-Mobile • Sprint • Measure Response times
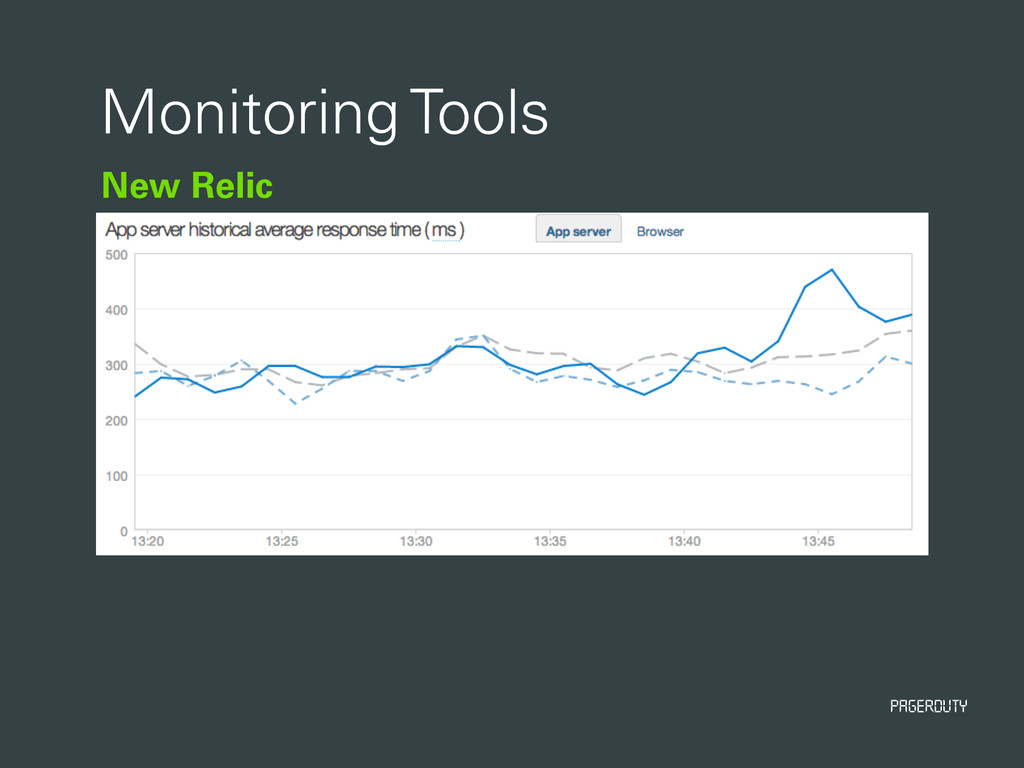
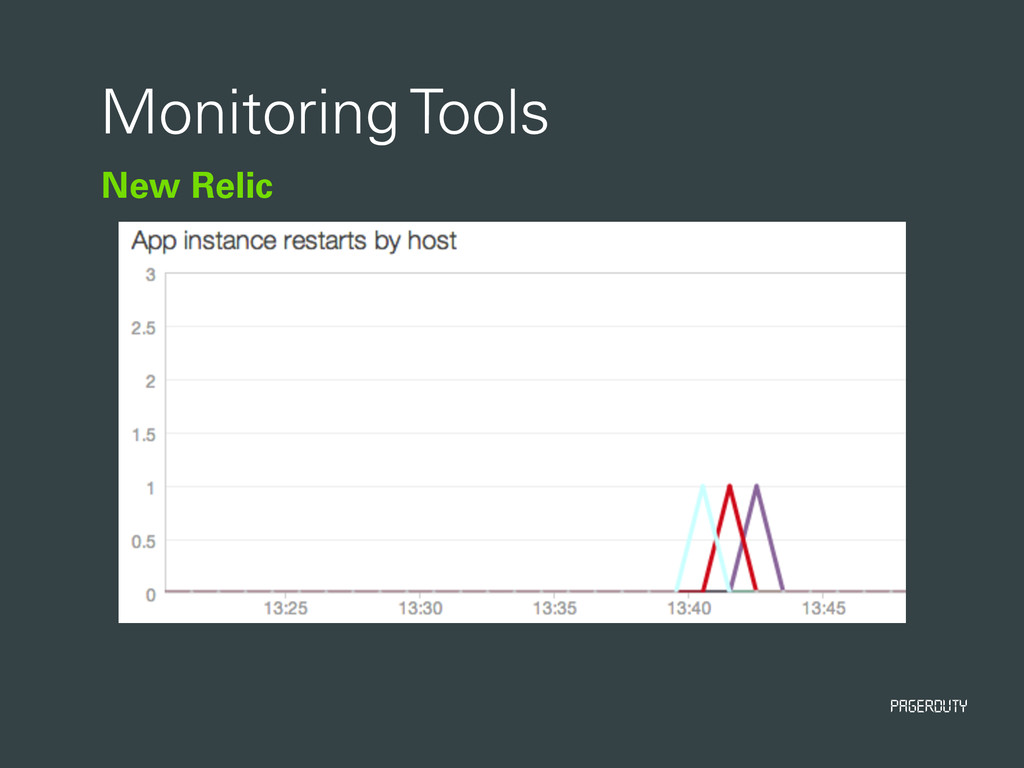
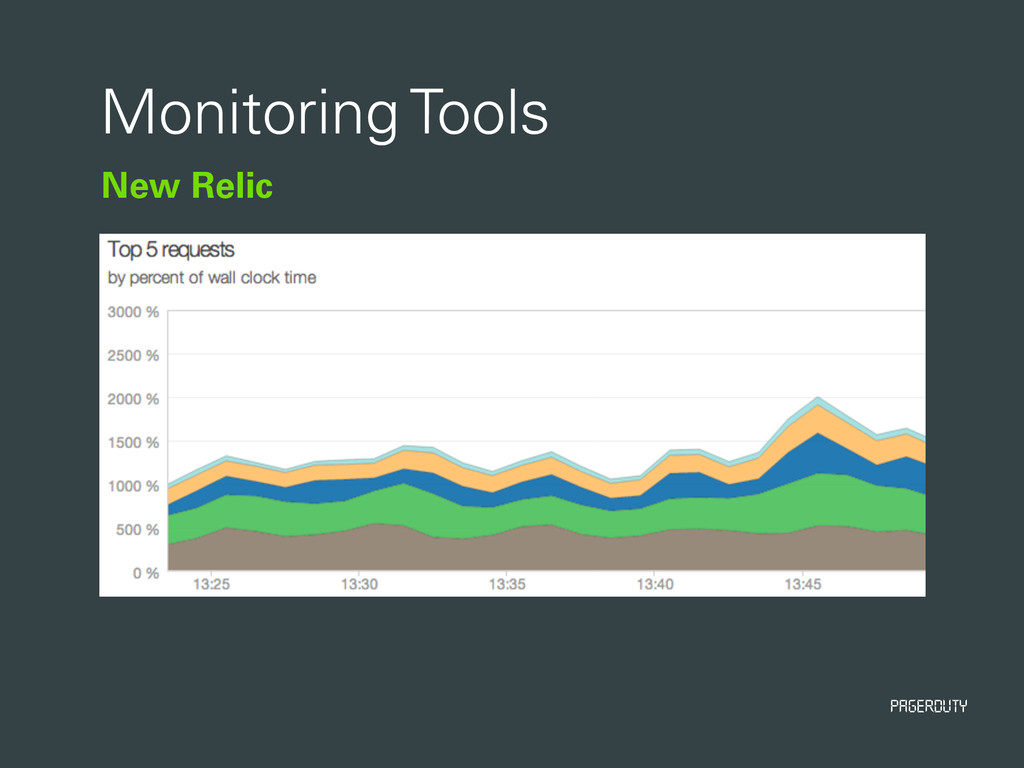
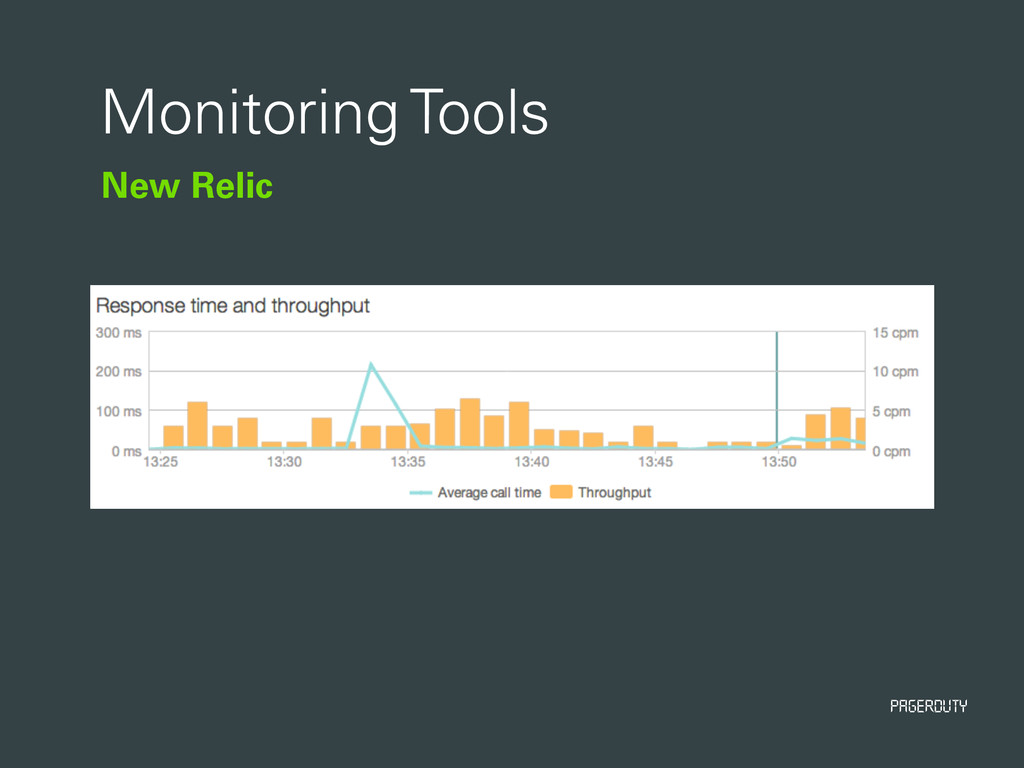
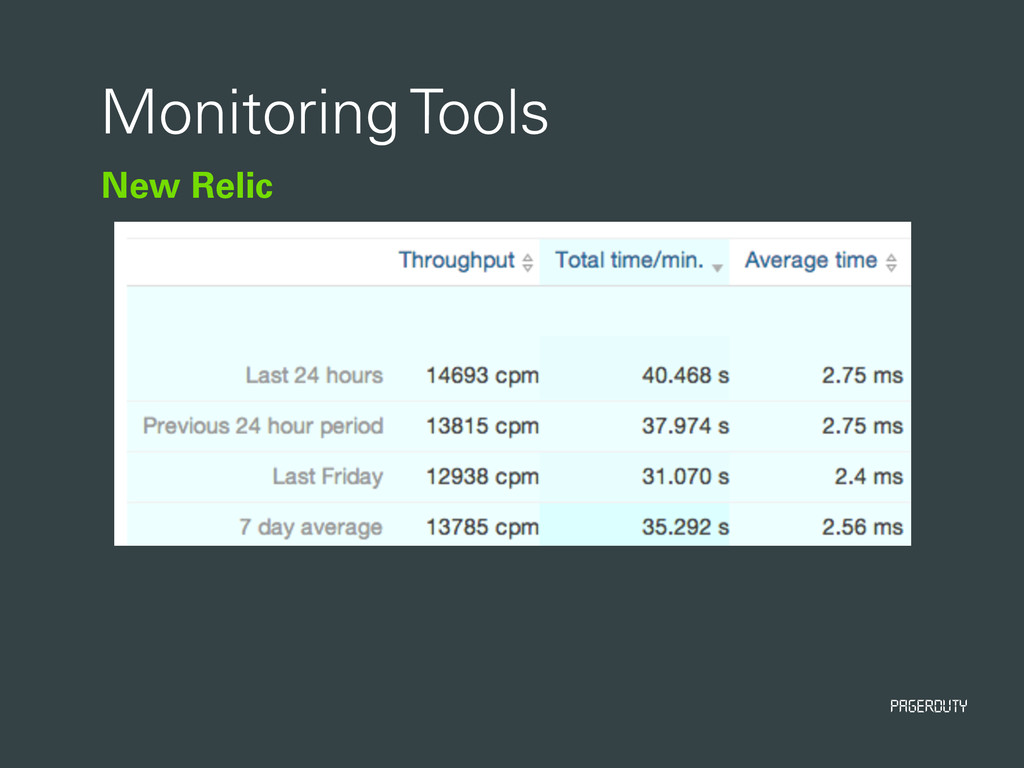
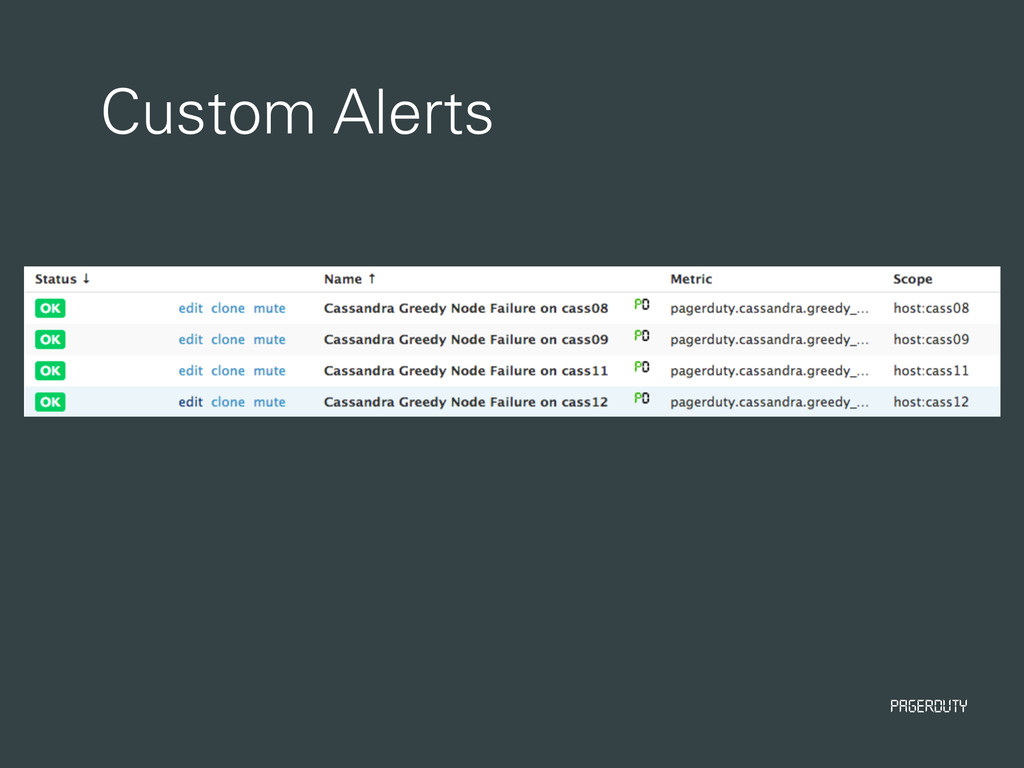
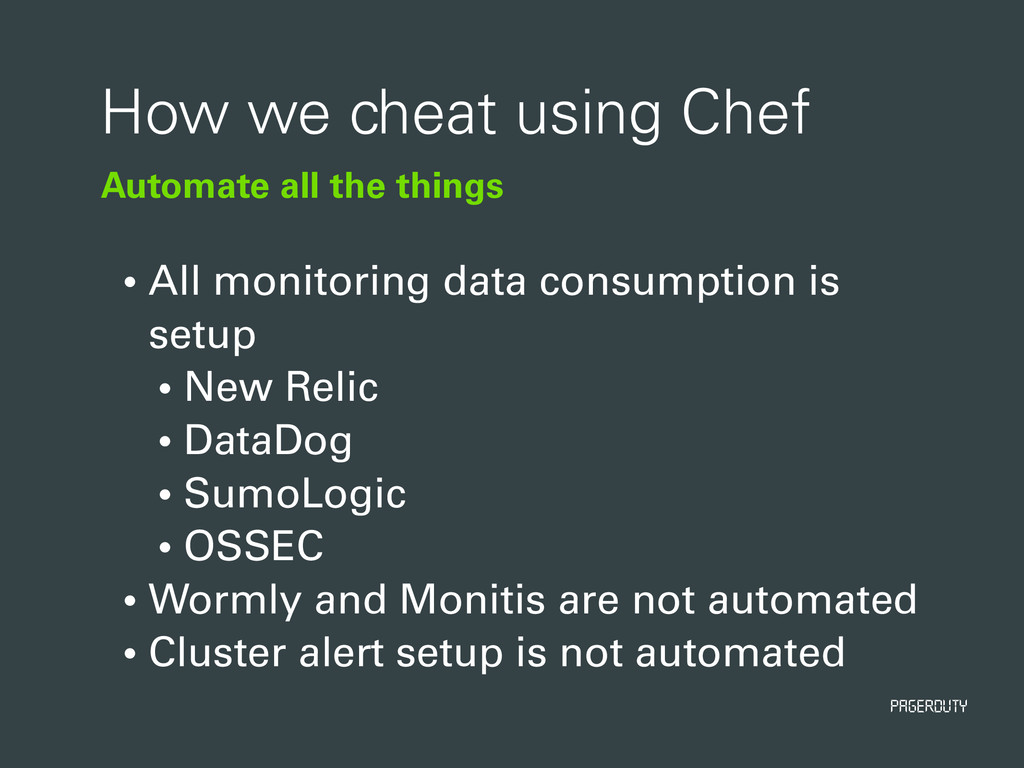
• All monitoring data consumption is setup • New Relic • DataDog • SumoLogic • OSSEC • Wormly and Monitis are not automated • Cluster alert setup is not automated
![PagerDuty Arup Chakrabarti OPERATIONS ENGINEERING @arupchak [email protected] DevOps Days Austin](https://files.speakerdeck.com/presentations/a98609b0bdd1013191822a9c30b9cc56/slide_0.jpg)
![PagerDuty [email protected] Thank you We are hiring http://pagerduty.com/jobs Arup Chakrabarti](https://files.speakerdeck.com/presentations/a98609b0bdd1013191822a9c30b9cc56/slide_44.jpg)