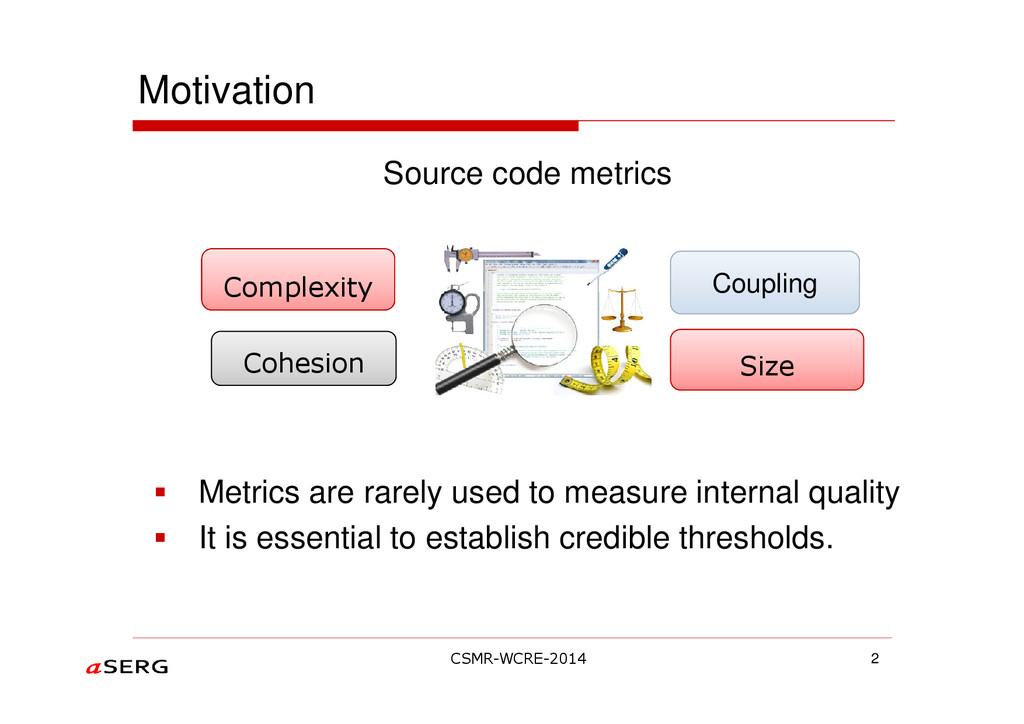
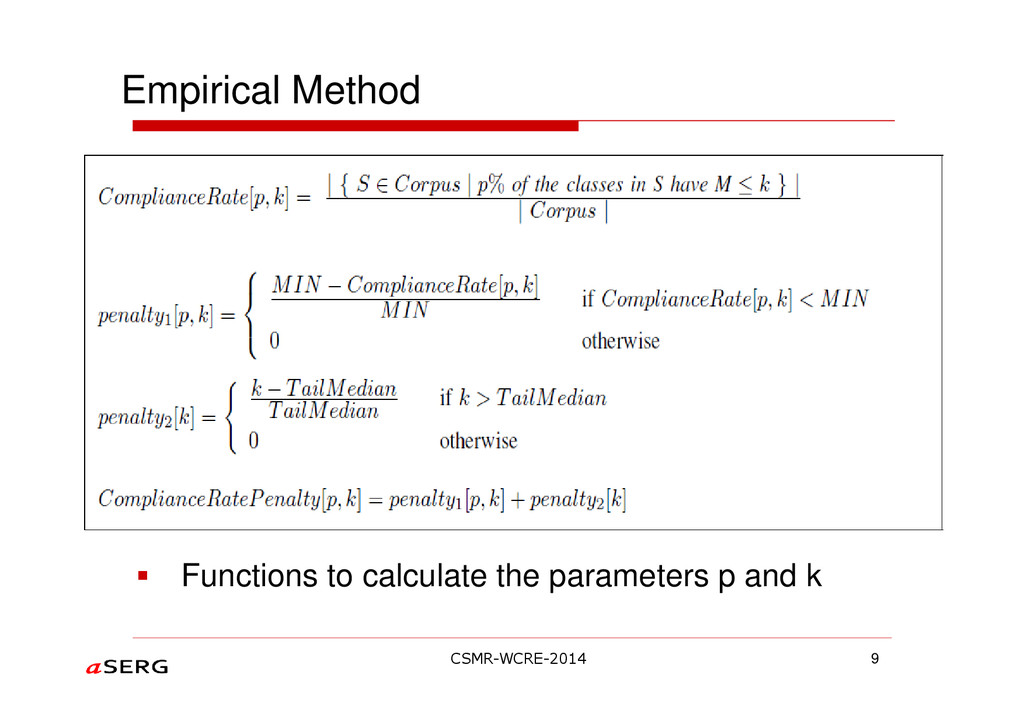
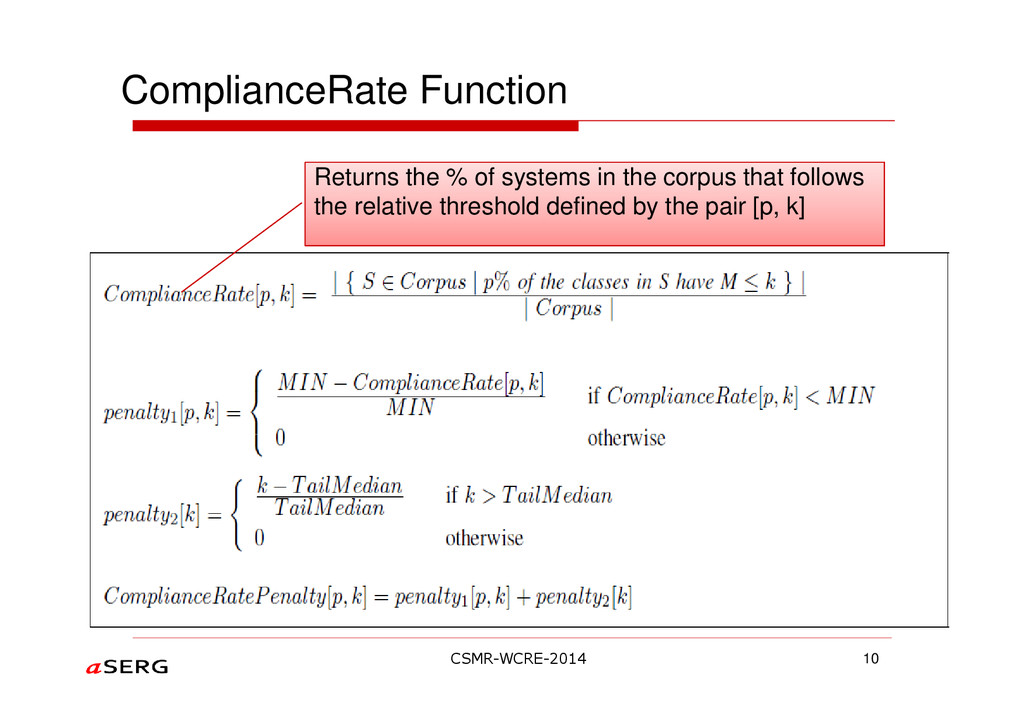
Establishing credible thresholds is a central challenge for promoting source code metrics as an effective instrument to control the internal quality of software systems. To address this challenge, we propose the concept of relative thresholds for evaluating metrics data following heavy-tailed
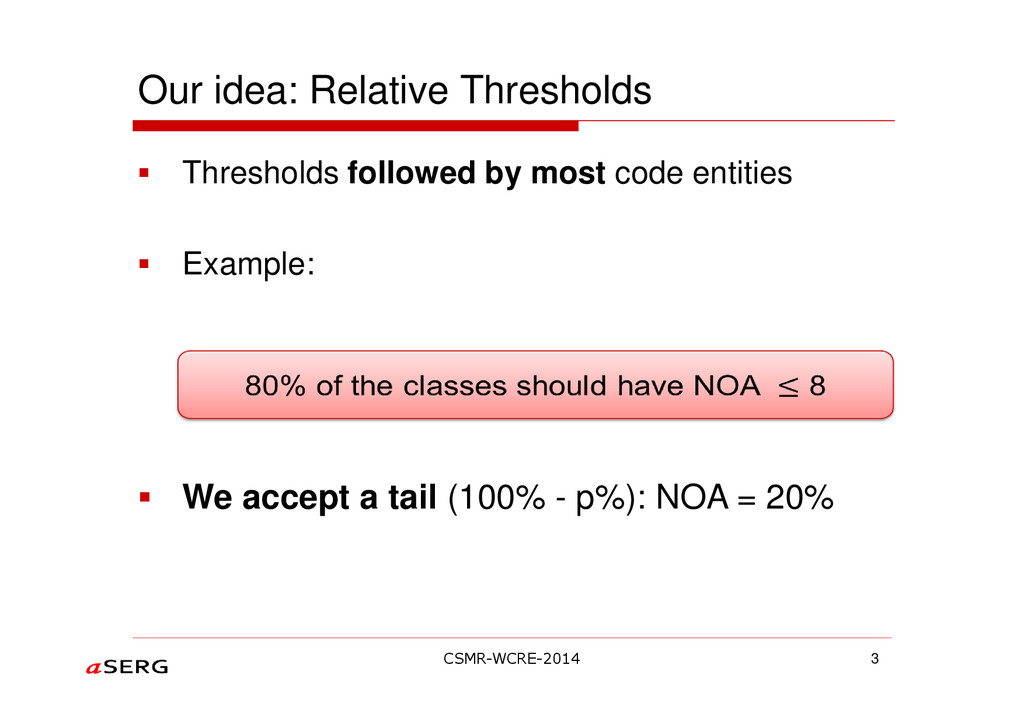
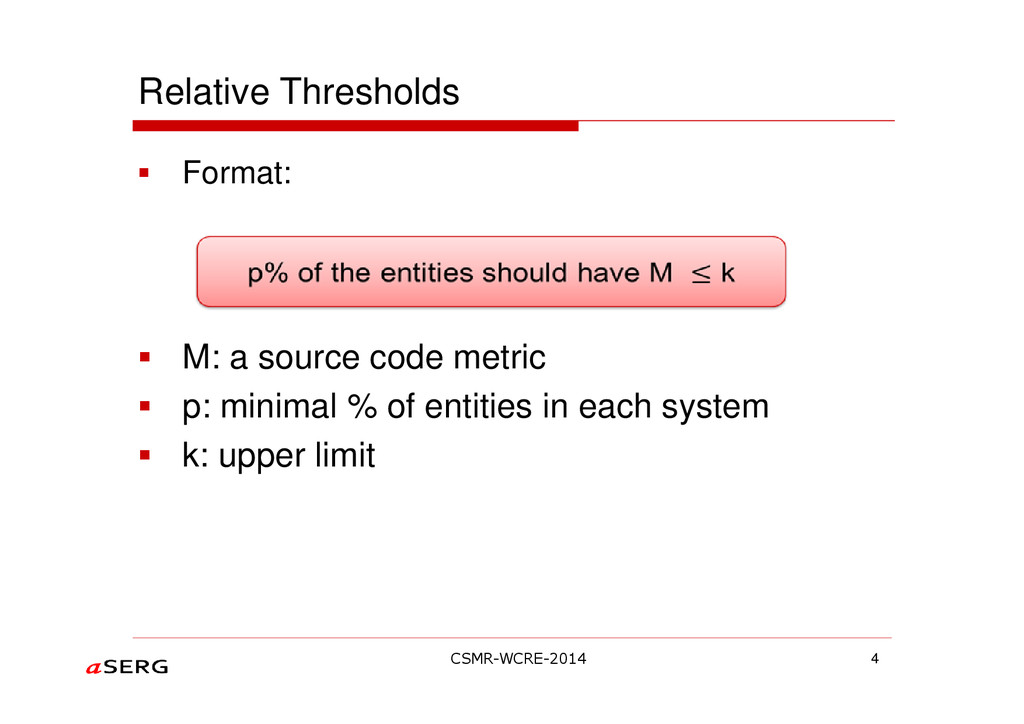
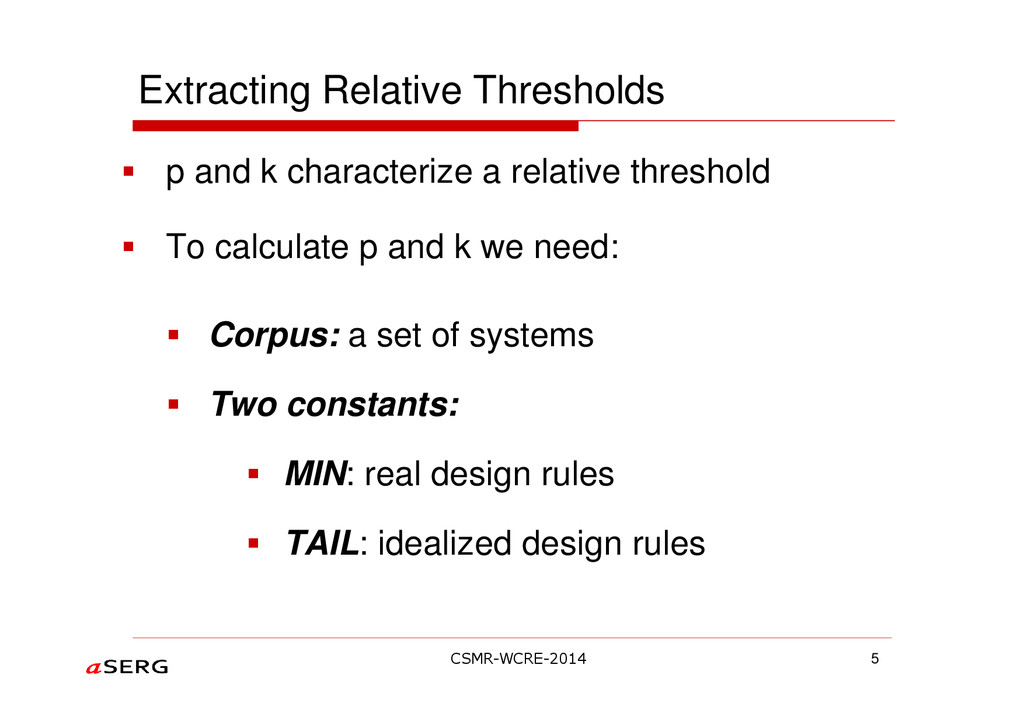
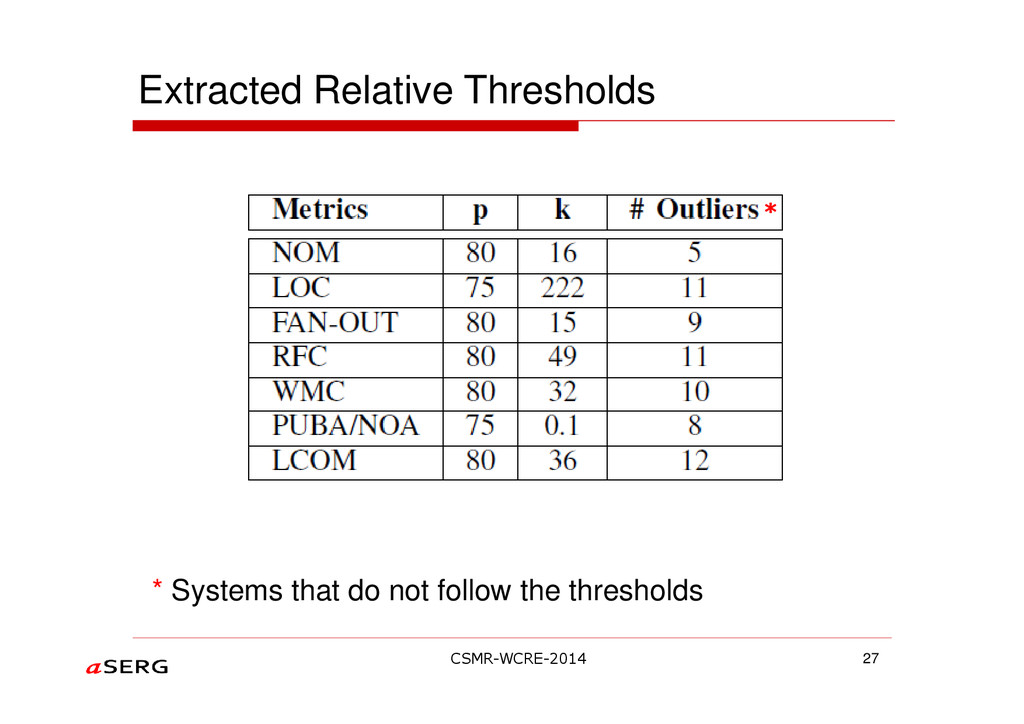
distributions. The proposed thresholds are relative because they assume that metric thresholds should be followed by most source code entities, but that it is also natural to have a number of entities in the “long-tail” that do not follow the defined limits. In the paper, we describe an empirical method for extracting relative thresholds from real systems. We also report a study on applying this method in a corpus with 106 systems. Based on
the results of this study, we argue that the proposed thresholds express a balance between real and idealized design practices.
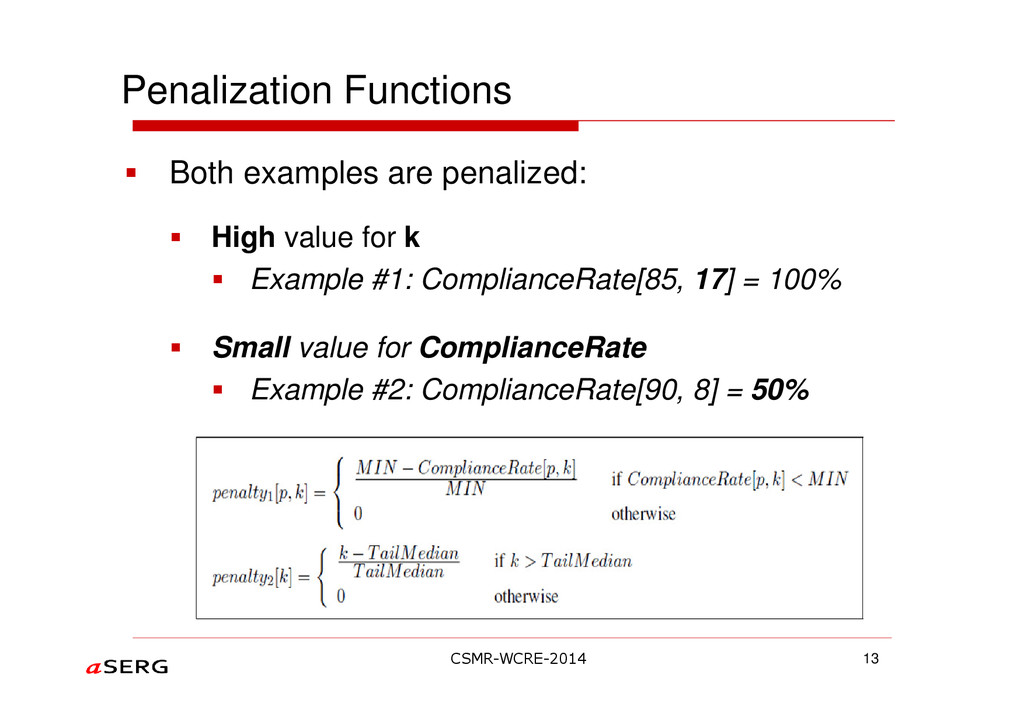
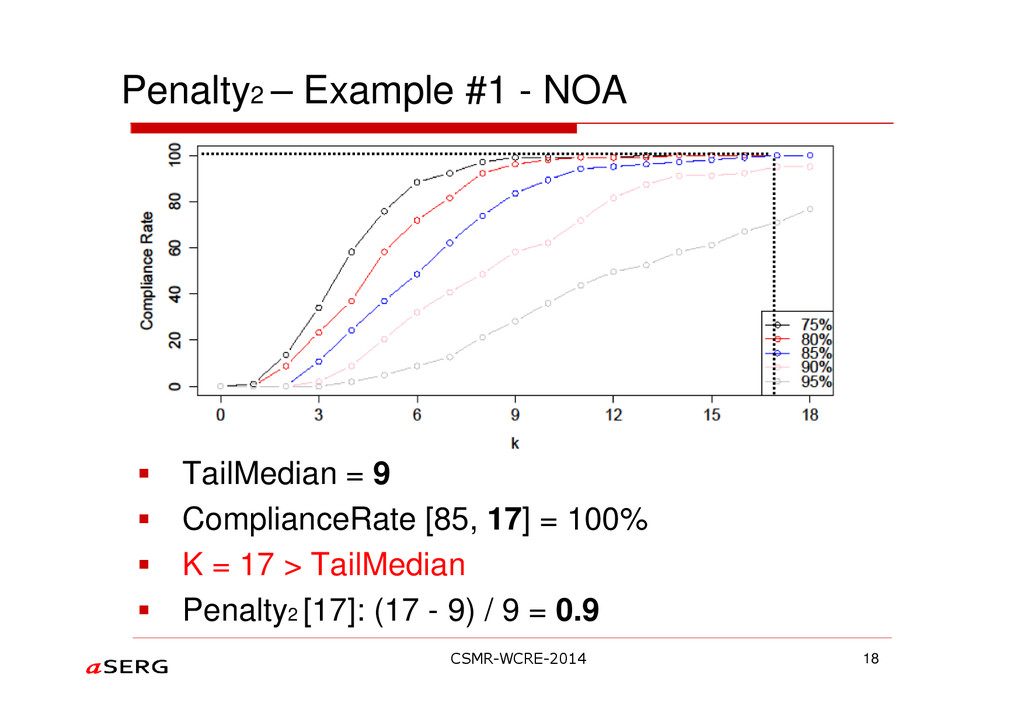
![ComplianceRate – Example #1 - NOA ComplianceRate [85, 17] =](https://files.speakerdeck.com/presentations/15b67d89a9404c2e93c3f085c6e7f684/slide_10.jpg)
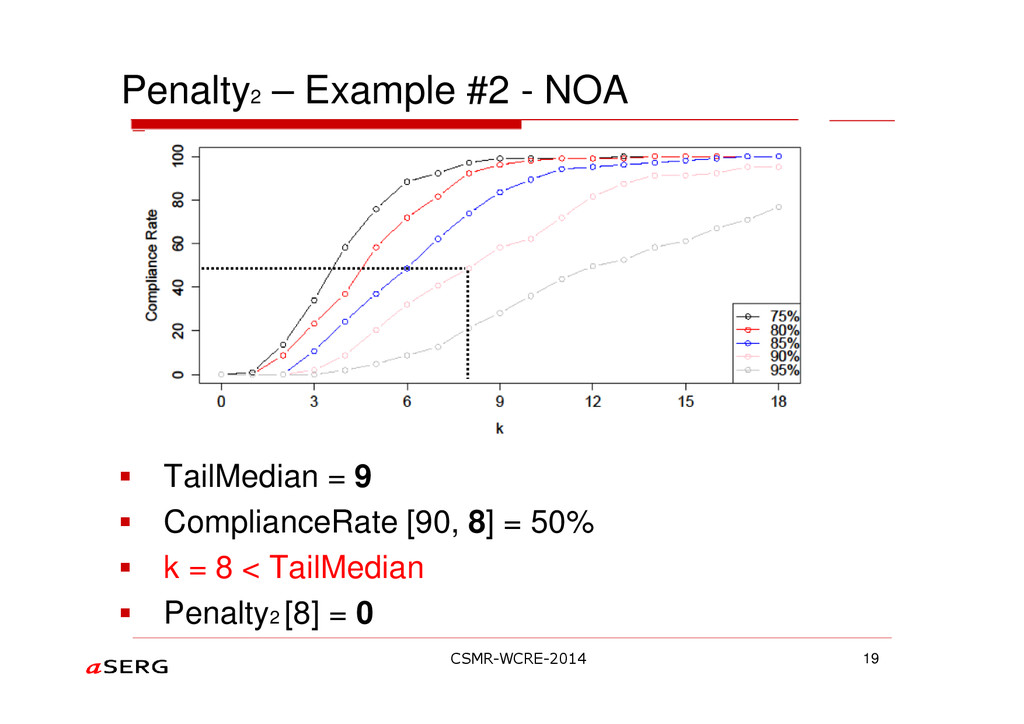
![ComplianceRate – Example #2 – NOA ComplianceRate [90, 8] =](https://files.speakerdeck.com/presentations/15b67d89a9404c2e93c3f085c6e7f684/slide_11.jpg)
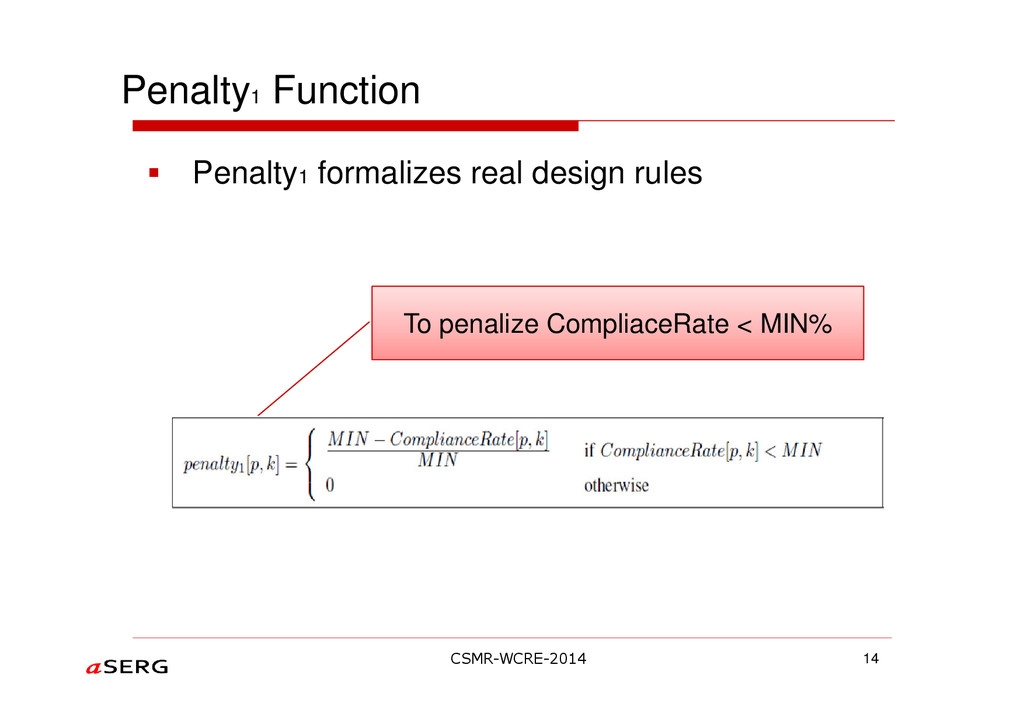
![Penalty1 – Example #1 - NOA ComplianceRate [85, 17] =](https://files.speakerdeck.com/presentations/15b67d89a9404c2e93c3f085c6e7f684/slide_14.jpg)
![Penalty1 – Example #2 - NOA ComplianceRate [90, 8] =](https://files.speakerdeck.com/presentations/15b67d89a9404c2e93c3f085c6e7f684/slide_15.jpg)
![Penalty2 Function Penalty 2 formalizes idealized design rules. TAIL[S]: TAIL-th](https://files.speakerdeck.com/presentations/15b67d89a9404c2e93c3f085c6e7f684/slide_16.jpg)
![Empirical Method - ComplianceRatePenalty ComplianceRatePenalty [p, k] = penalty1 +](https://files.speakerdeck.com/presentations/15b67d89a9404c2e93c3f085c6e7f684/slide_20.jpg)
![Empirical Method 23 Relative threshold for NOA metric [p,k] =](https://files.speakerdeck.com/presentations/15b67d89a9404c2e93c3f085c6e7f684/slide_22.jpg)
![Thank you! 35 APPLIED SOFTWARE ENGINEERING RESEARCH GROUP / [email protected]](https://files.speakerdeck.com/presentations/15b67d89a9404c2e93c3f085c6e7f684/slide_34.jpg)