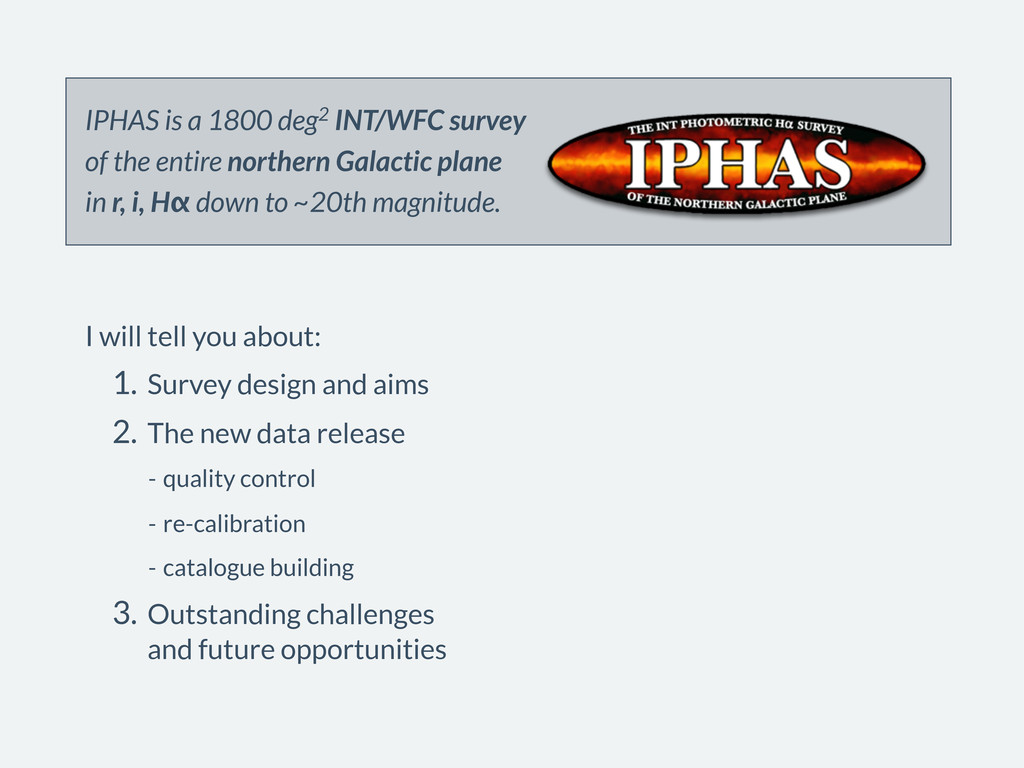
northern Galactic plane in r, i, Hα down to ~20th magnitude. I will tell you about: 1. Survey design and aims 2. The new data release - quality control - re-calibration - catalogue building 3. Outstanding challenges and future opportunities
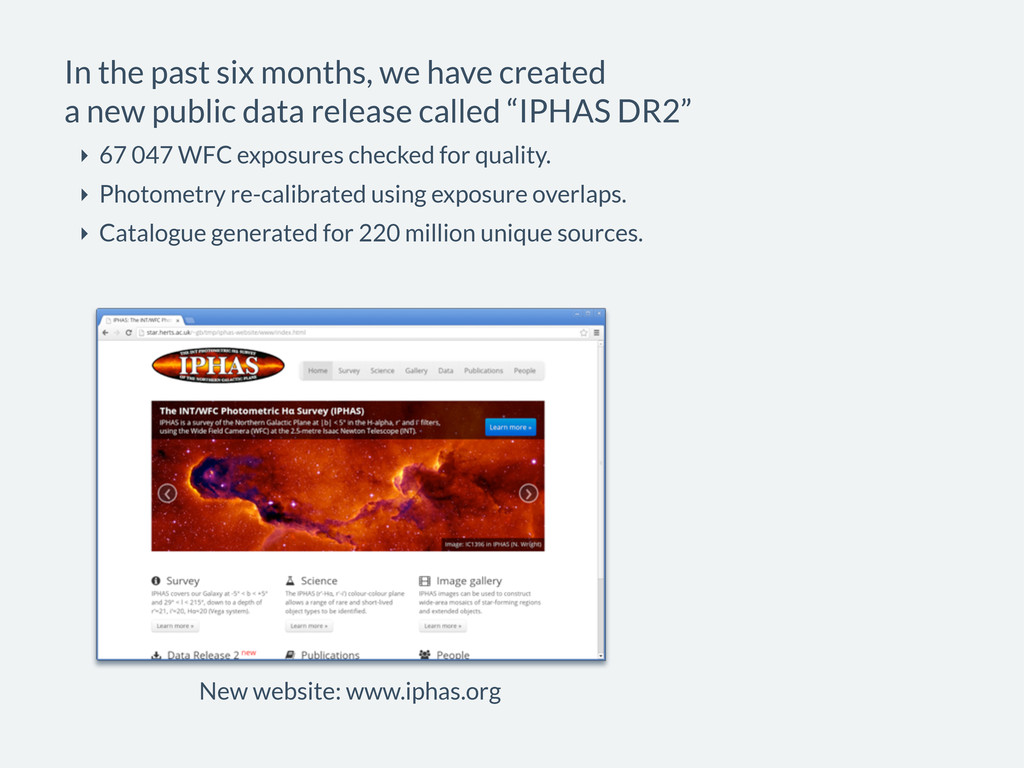
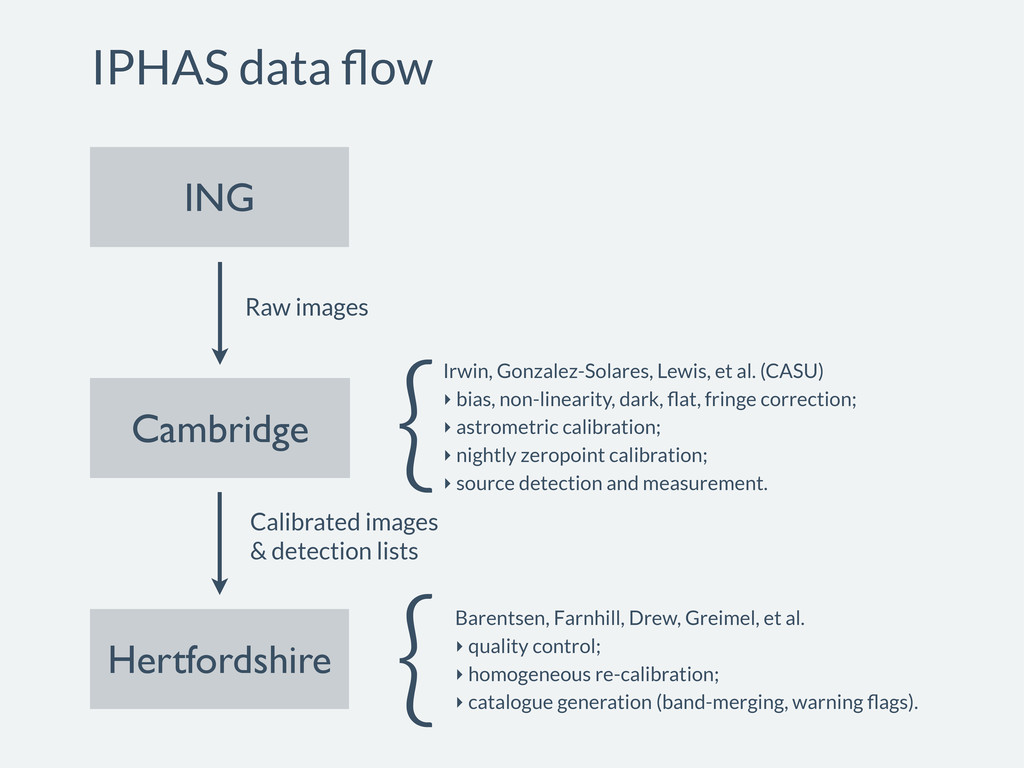
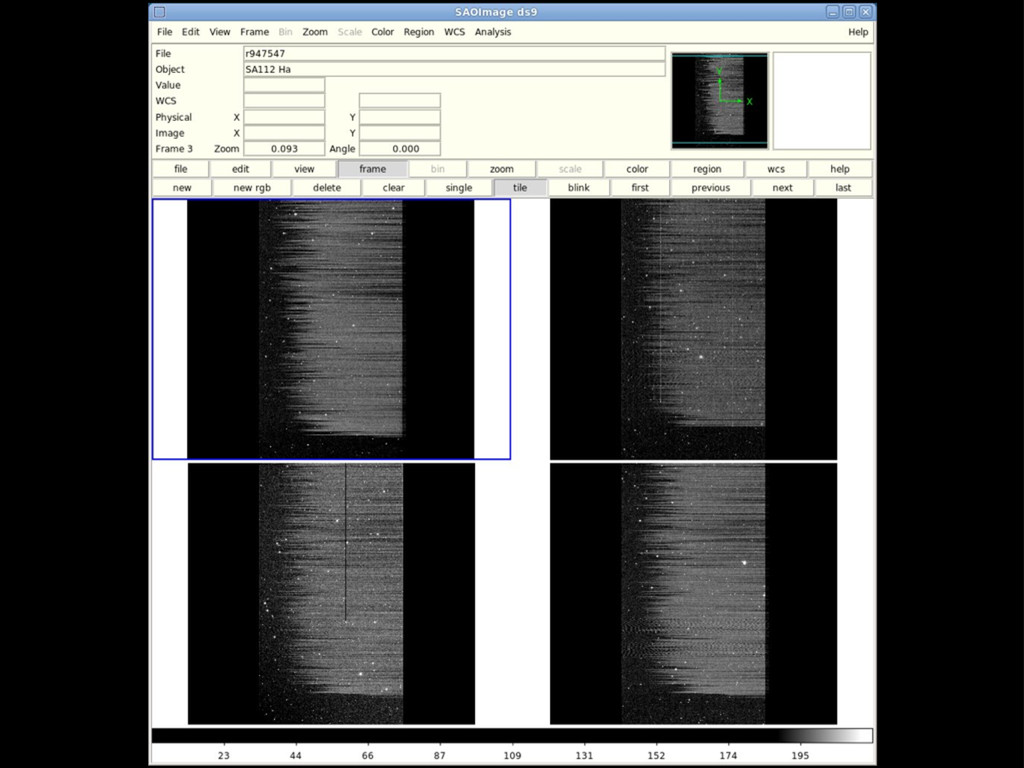
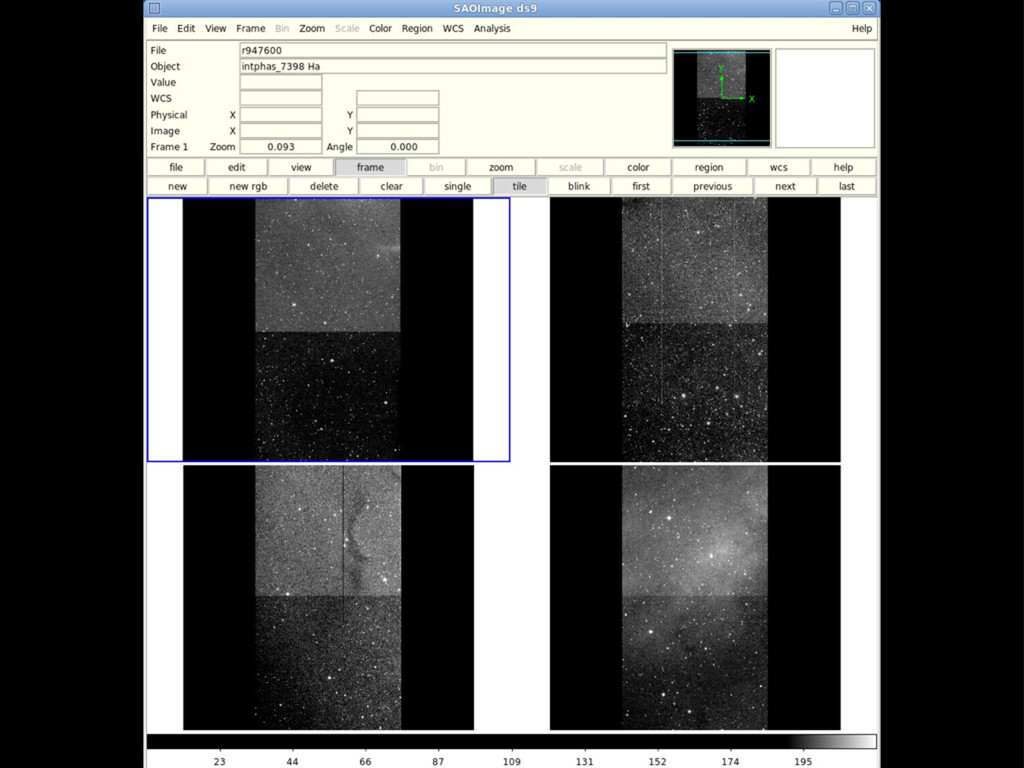
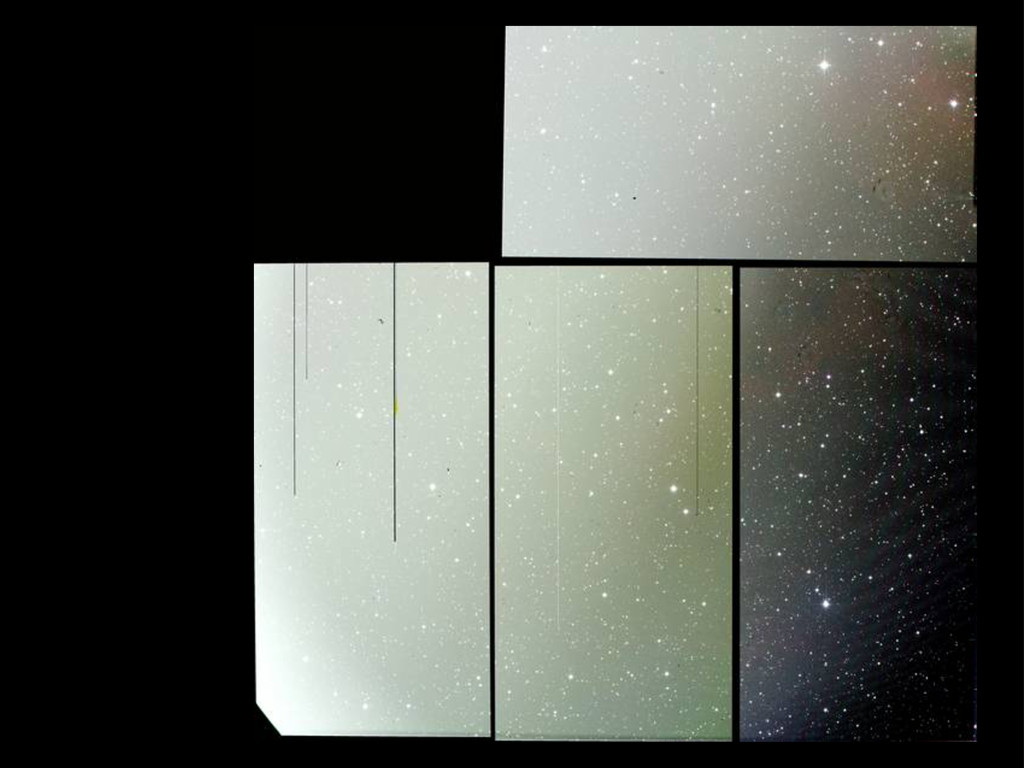
public data release called “IPHAS DR2” ‣ 67 047 WFC exposures checked for quality. ‣ Photometry re-calibrated using exposure overlaps. ‣ Catalogue generated for 220 million unique sources. New website: www.iphas.org
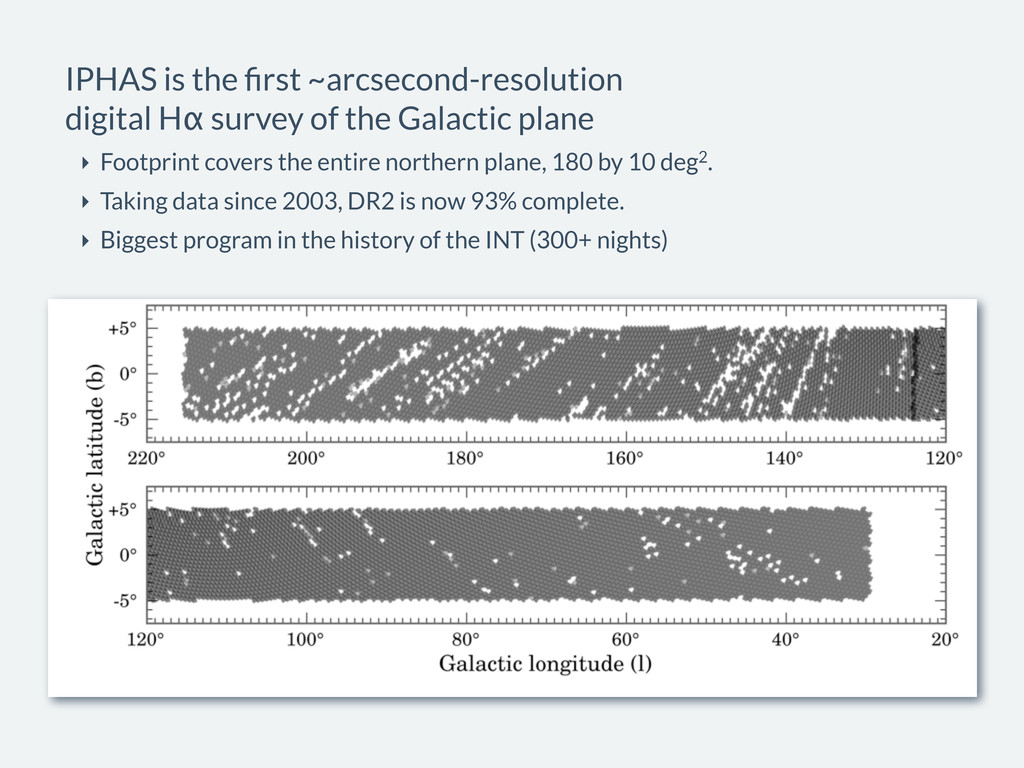
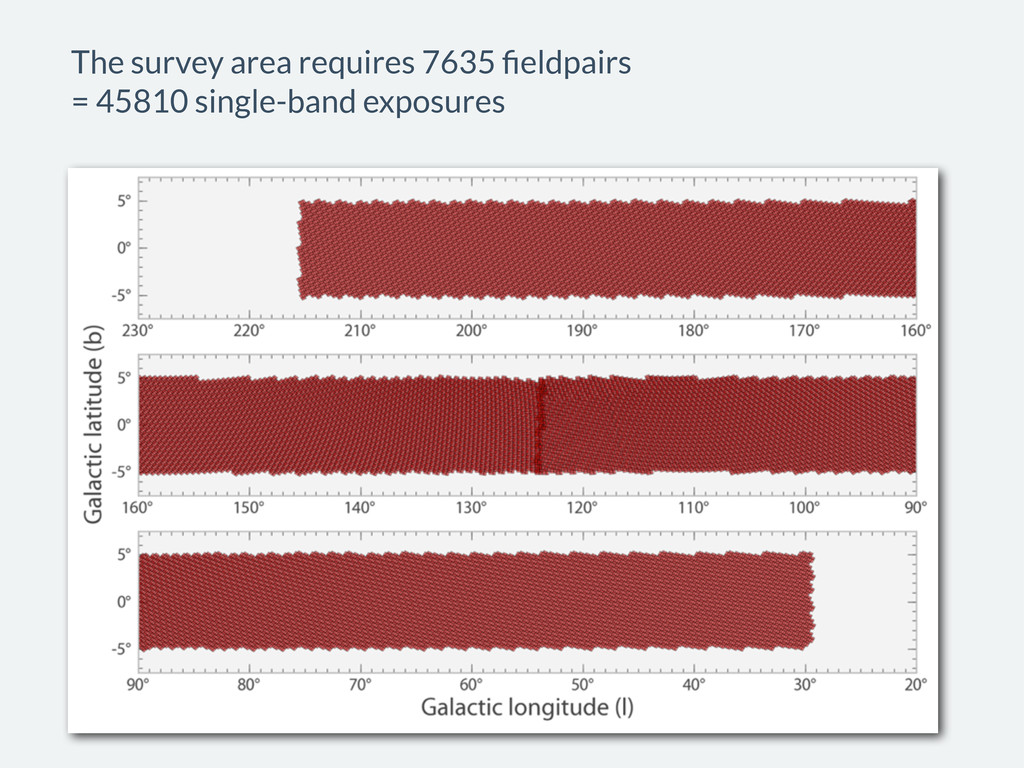
Galactic plane ‣ Footprint covers the entire northern plane, 180 by 10 deg2. ‣ Taking data since 2003, DR2 is now 93% complete. ‣ Biggest program in the history of the INT (300+ nights)
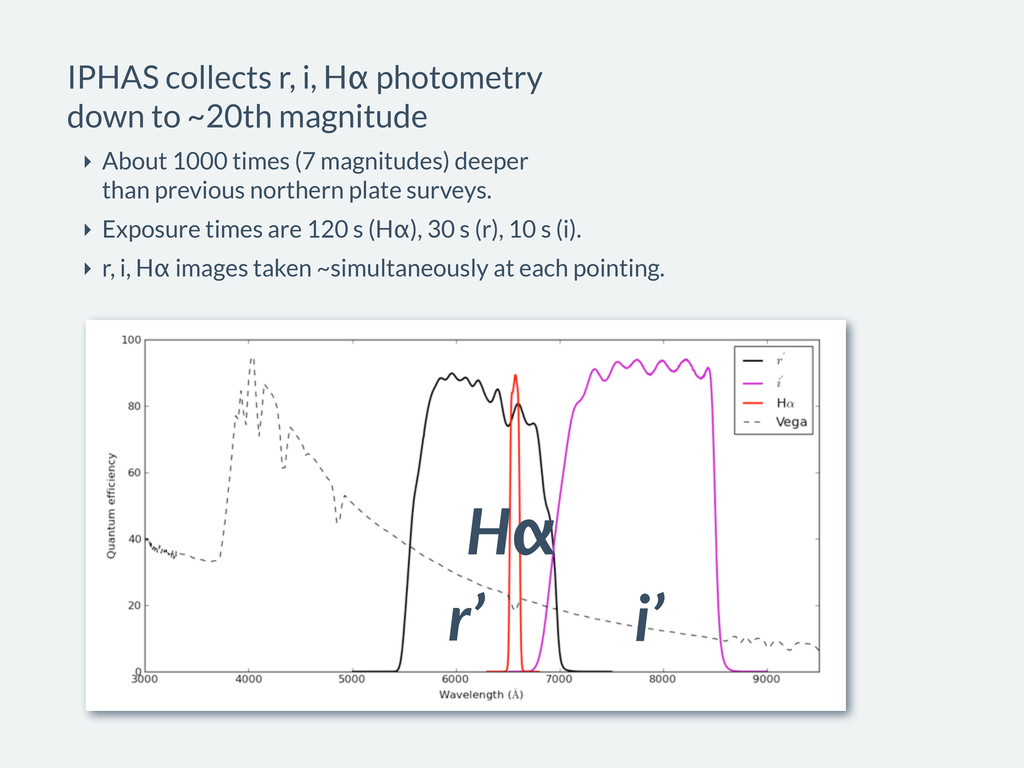
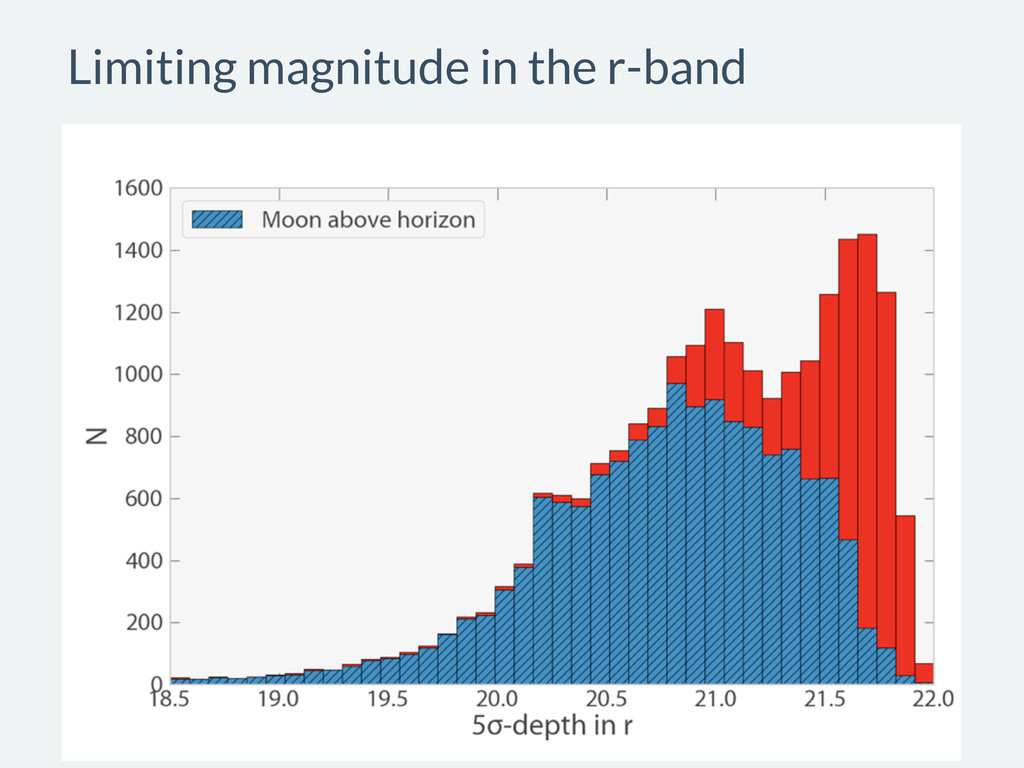
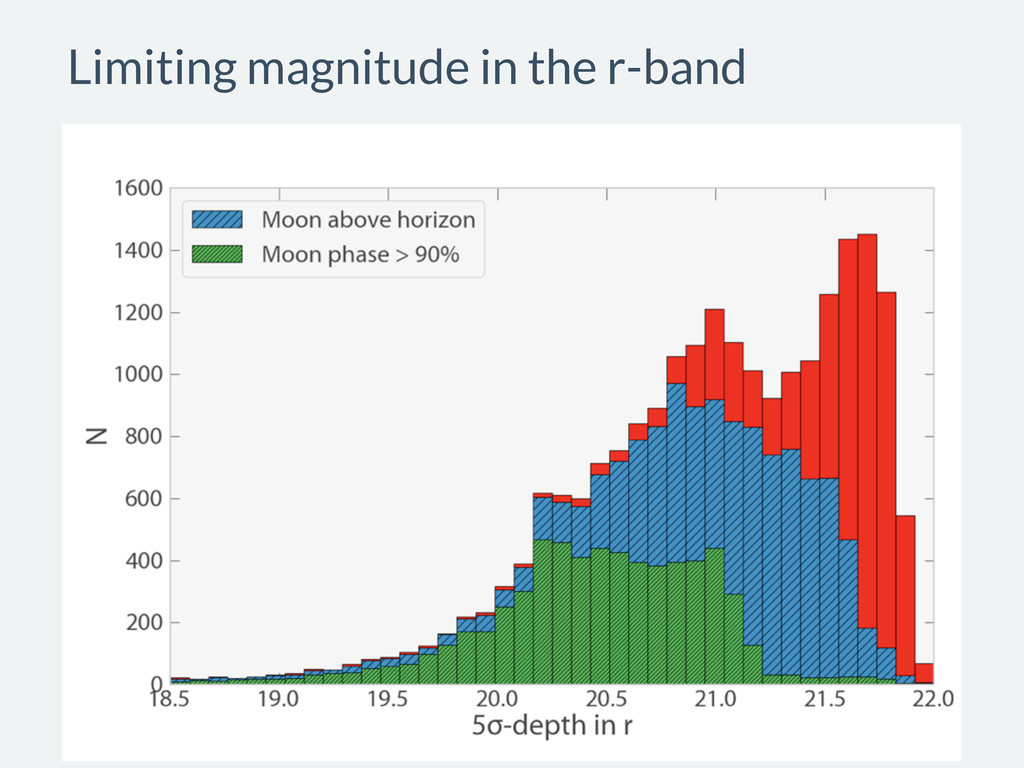
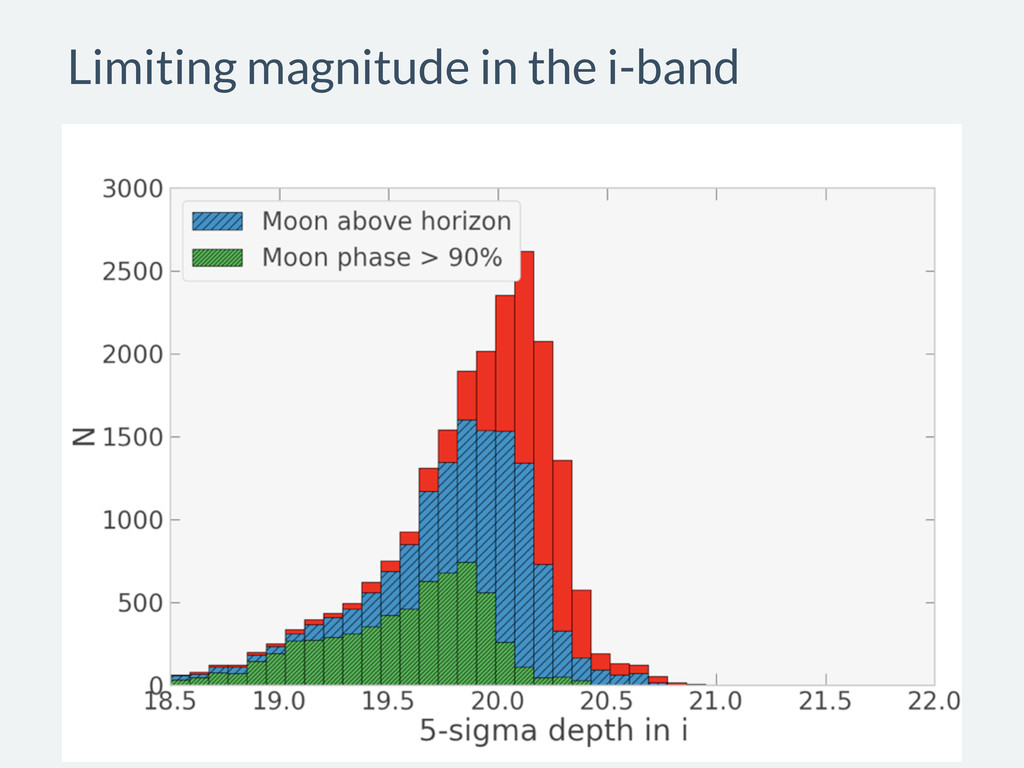
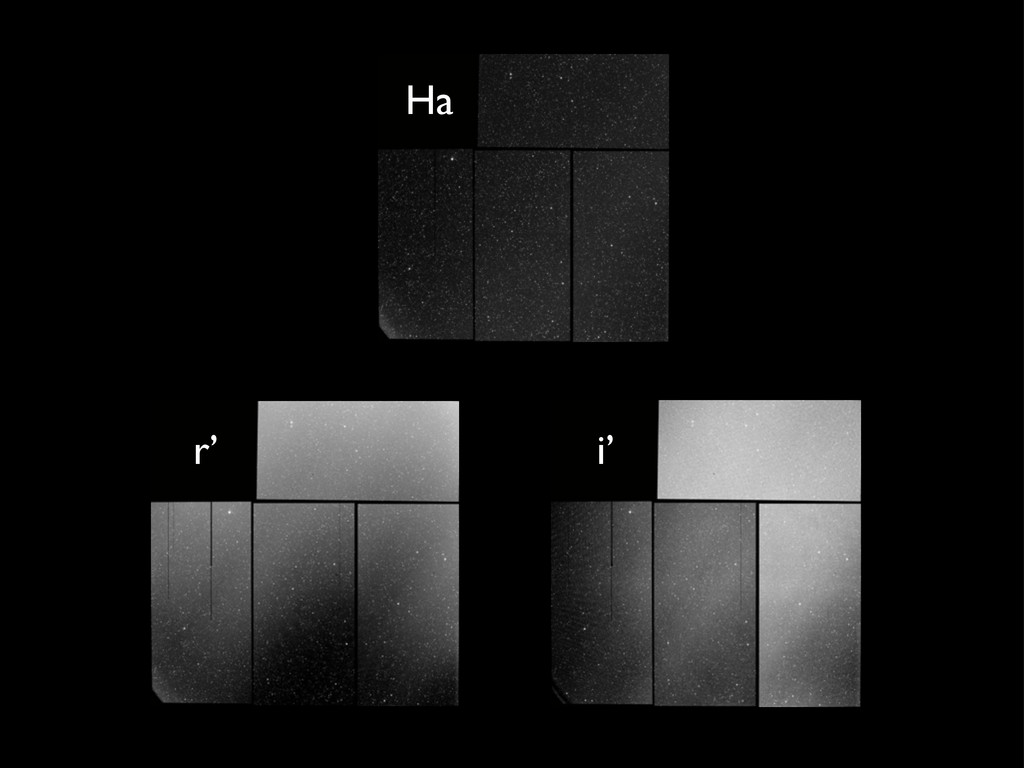
to ~20th magnitude ‣ About 1000 times (7 magnitudes) deeper than previous northern plate surveys. ‣ Exposure times are 120 s (Hα), 30 s (r), 10 s (i). ‣ r, i, Hα images taken ~simultaneously at each pointing.
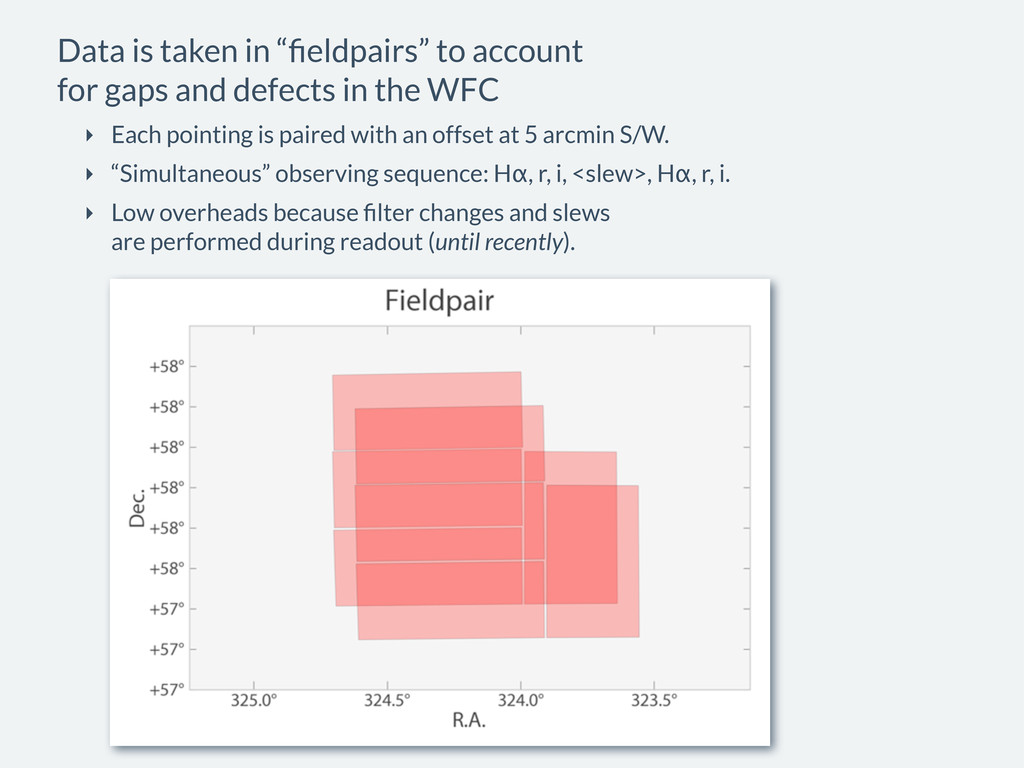
defects in the WFC ‣ Each pointing is paired with an offset at 5 arcmin S/W. ‣ “Simultaneous” observing sequence: Hα, r, i, <slew>, Hα, r, i. ‣ Low overheads because filter changes and slews are performed during readout (until recently).
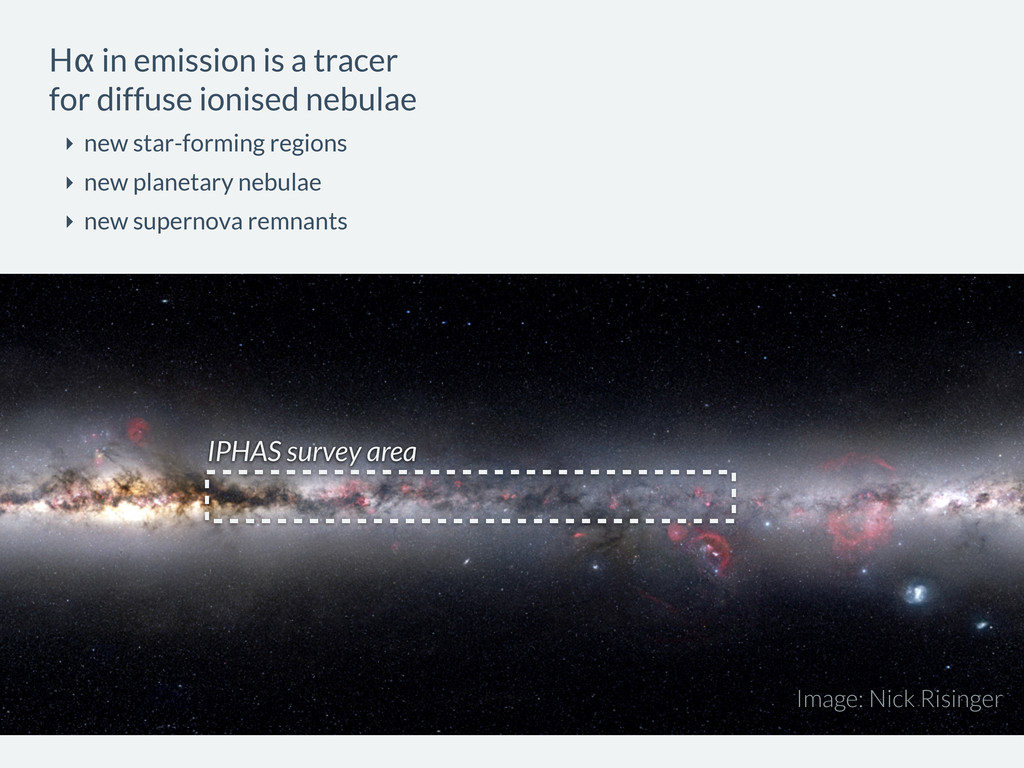
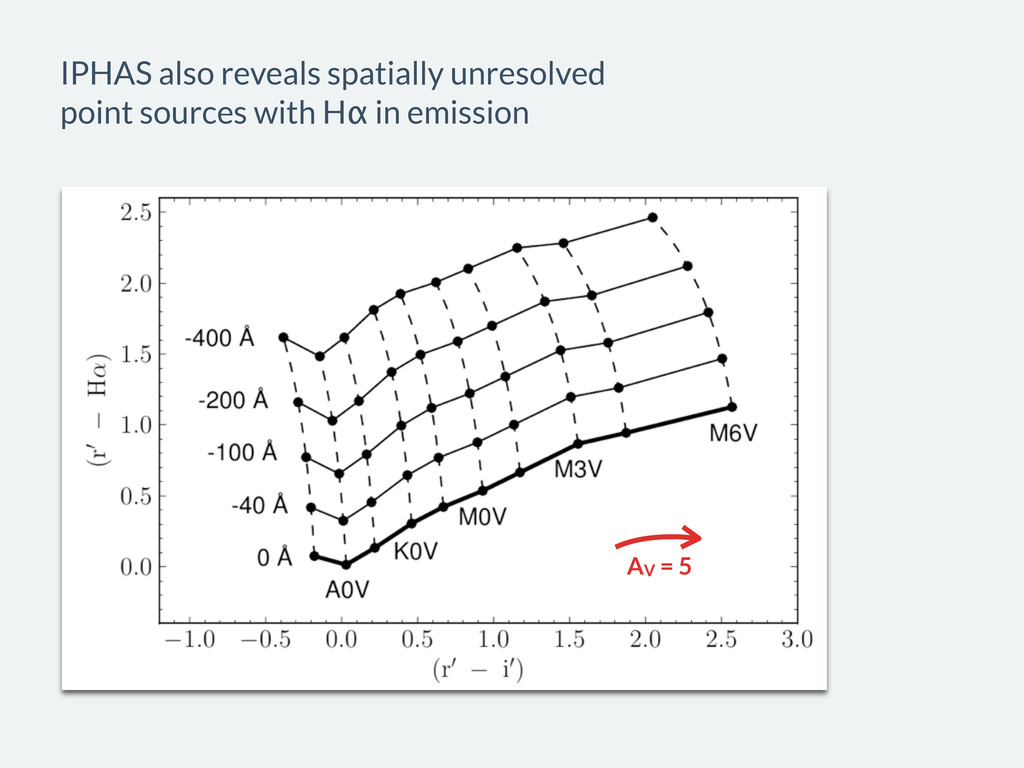
in the crucial stages of stellar evolution ‣ Pre-main sequence stars e.g. T Tauri,Herbig Ae/Be objects ‣ Post-main sequence stars e.g. some AGBs, compact PNs, LBVs, classical Be’s ‣ Interacting binaries e.g. symbiotic stars, cataclysmic variables (Corradi et al. 2008)
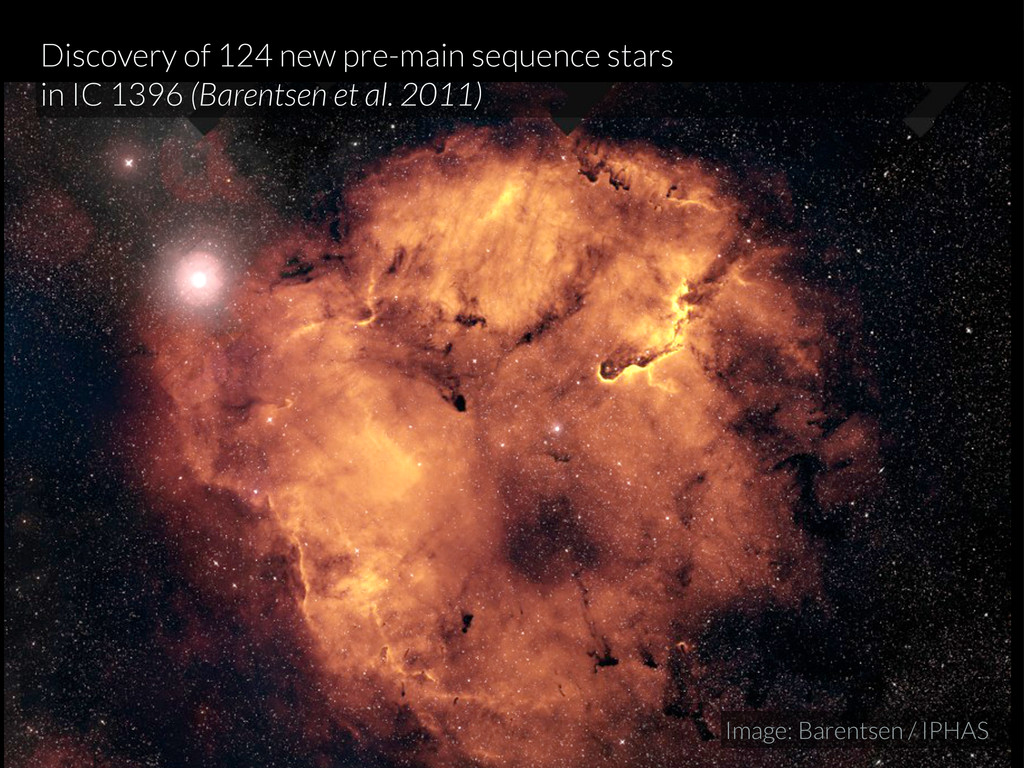
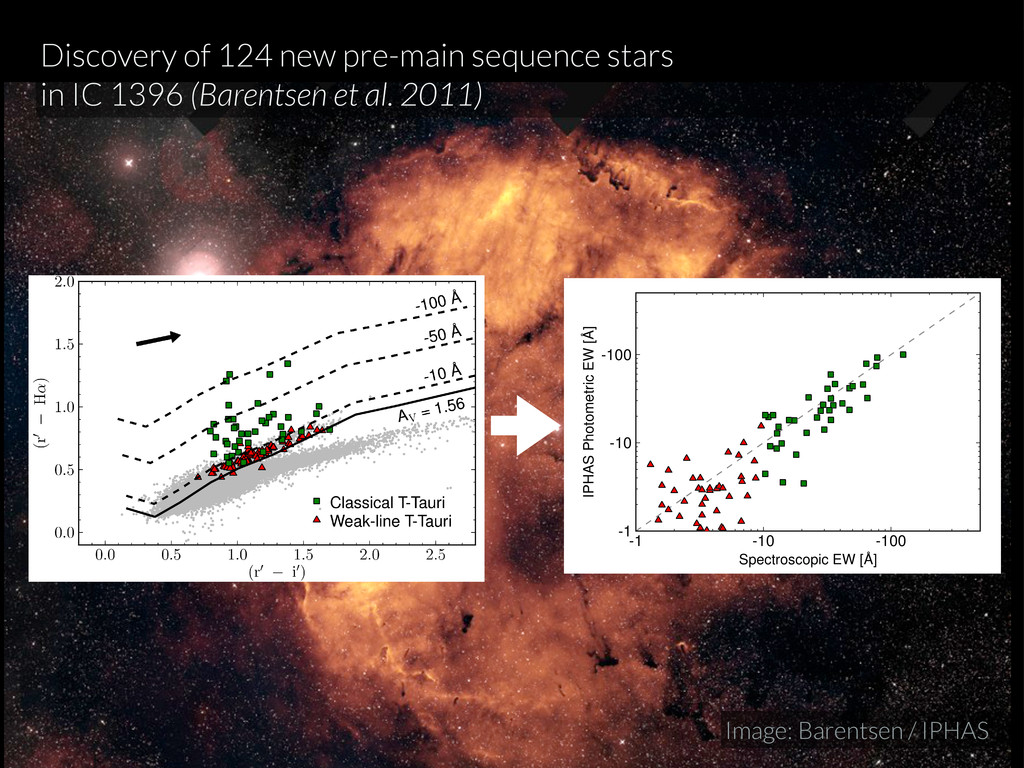
(Barentsen et al. 2011) Image: Barentsen / IPHAS Figure 4. IPHAS colours of known T Tauri stars in IC 1396 from Sicilia-Aguilar et al. (2005). Green squares are classical T Tauri stars (CTTS) with spectroscopic EWH↵ stronger than - 10 ˚ A. Red triangles are weak-line T Tauri stars (WTTS) with EWH↵ weaker than -10 ˚ A. The solid line shows the simulated main sequence curve at the mean reddening of the cluster ( ¯ AV = 1.56). Dashed lines shows the position of stars at increasing levels of H↵ emission as predicted by our simulated tracks. Grey dots show field stars in the region. The arrow shows the reddening shift for an M0V-type object being reddened from AV = 0 to AV = 1.56 (note that the true reddening tracks are curved in a way that depends on the SED and the amount of reddening, see Drew et al. 2005) -1 -10 -100 Spectroscopic EW [ ˚ A] -1 -10 -100 IPHAS Photometric EW [ ˚ A] Figure 5. Comparison of IPHAS photometric EWH↵ with spec- troscopic values from Sicilia-Aguilar et al. (2005). The grey dashed line shows the unity relation. The scatter is thought to be dominated by natural H↵ emission variability. well as classical T Tauri stars (CTTS) with emission stronger than -10 ˚ A EW. Out of the 118 probable T Tauri members confirmed by T Tauri candidates in IC 1396 using IPHAS 5 Figure 4. IPHAS colours of known T Tauri stars in IC 1396 from Sicilia-Aguilar et al. (2005). Green squares are classical T Tauri stars (CTTS) with spectroscopic EWH↵ stronger than - 10 ˚ A. Red triangles are weak-line T Tauri stars (WTTS) with EWH↵ weaker than -10 ˚ A. The solid line shows the simulated main sequence curve at the mean reddening of the cluster ( ¯ AV = 1.56). Dashed lines shows the position of stars at increasing levels of H↵ emission as predicted by our simulated tracks. Grey dots show field stars in the region. The arrow shows the reddening is the typical reddening found by SA05). We notice that the classical T Tauri stars are well separated from the field stars (shown as grey points): most are above the 10 ˚ A EW boundary as predicted by the drawn grid lines. In con- trast the weak-lined stars fall within the main stellar locus, blending in with normal less-reddened stars. The fact that reddening raises the EW threshold for the clean detection of emission line stars is a recognised property of the IPHAS colour-colour plane (see Drew et al. 2005). One weak-lined object, named 73-537 in SA05, can be seen to fall somewhat below the simulated main sequence (solid line in Fig. 4). The aberrant position is explained by the high reddening of the object, AV = 3.3, which is an outlier in terms of reddening compared to the rest of the sample. To validate the grid in more detail, we interpolated the tracks to derive H↵ EWs for the known T Tauri objects. These values are then plotted against the spectroscopic val- ues from SA05. The comparison is shown in Fig. 5. We find a strong correlation between the photometric and spectro- scopic estimates, albeit with a large scatter on the order of
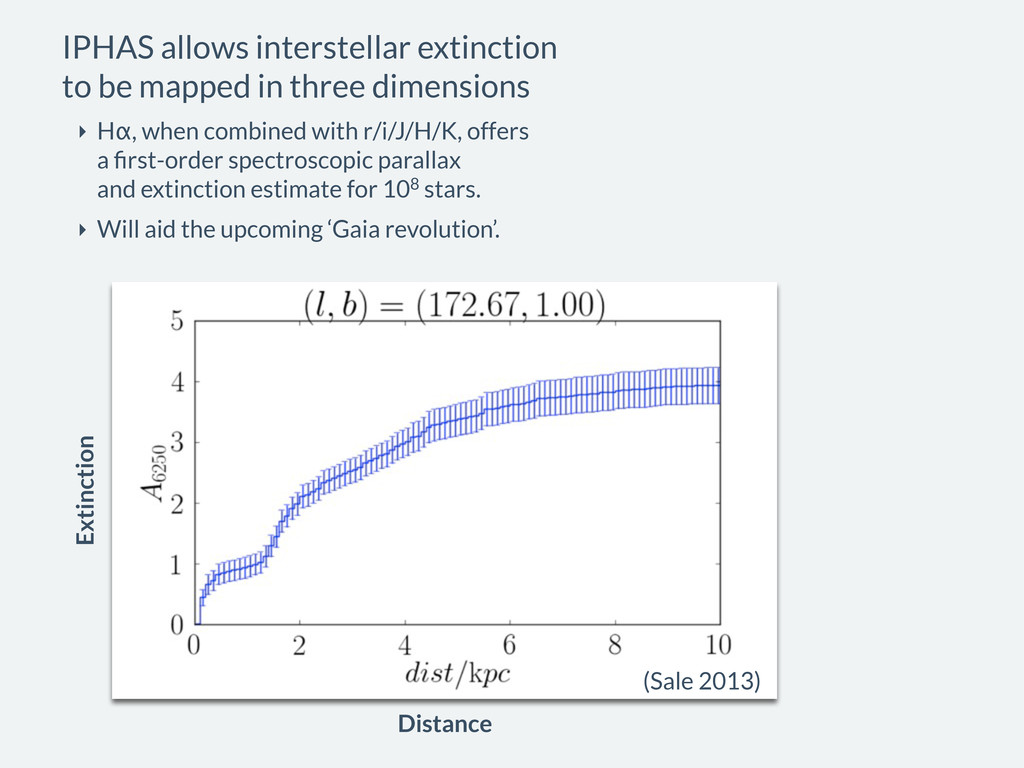
three dimensions ‣ Hα, when combined with r/i/J/H/K, offers a first-order spectroscopic parallax and extinction estimate for 108 stars. ‣ Will aid the upcoming ‘Gaia revolution’. Distance Extinction
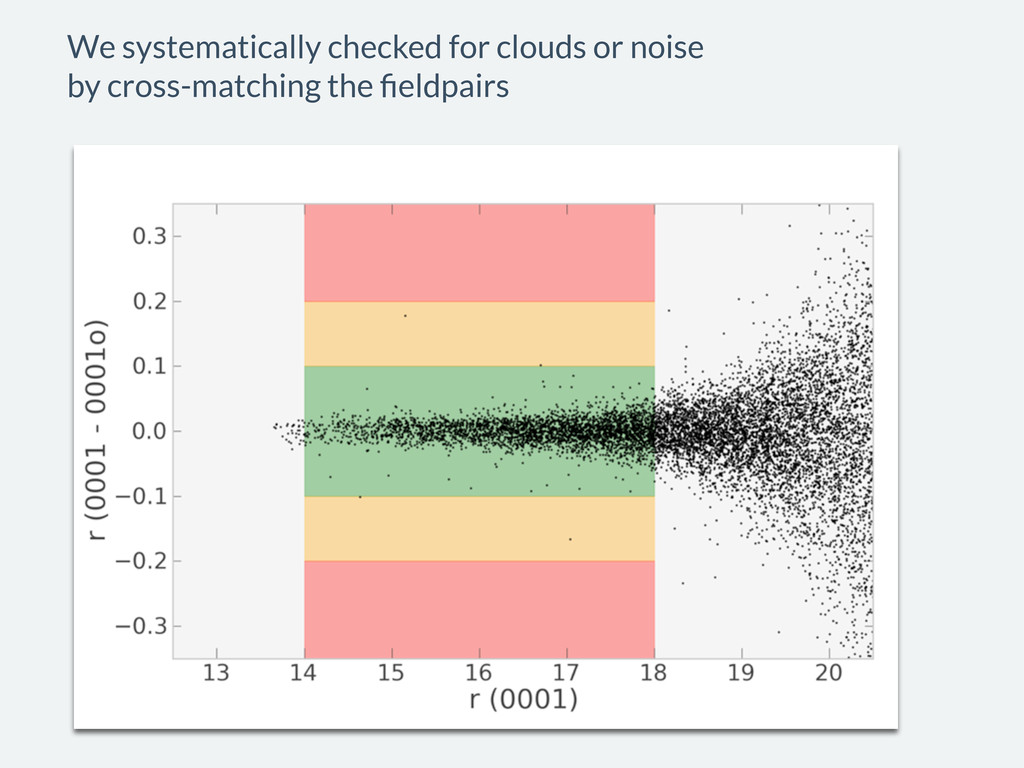
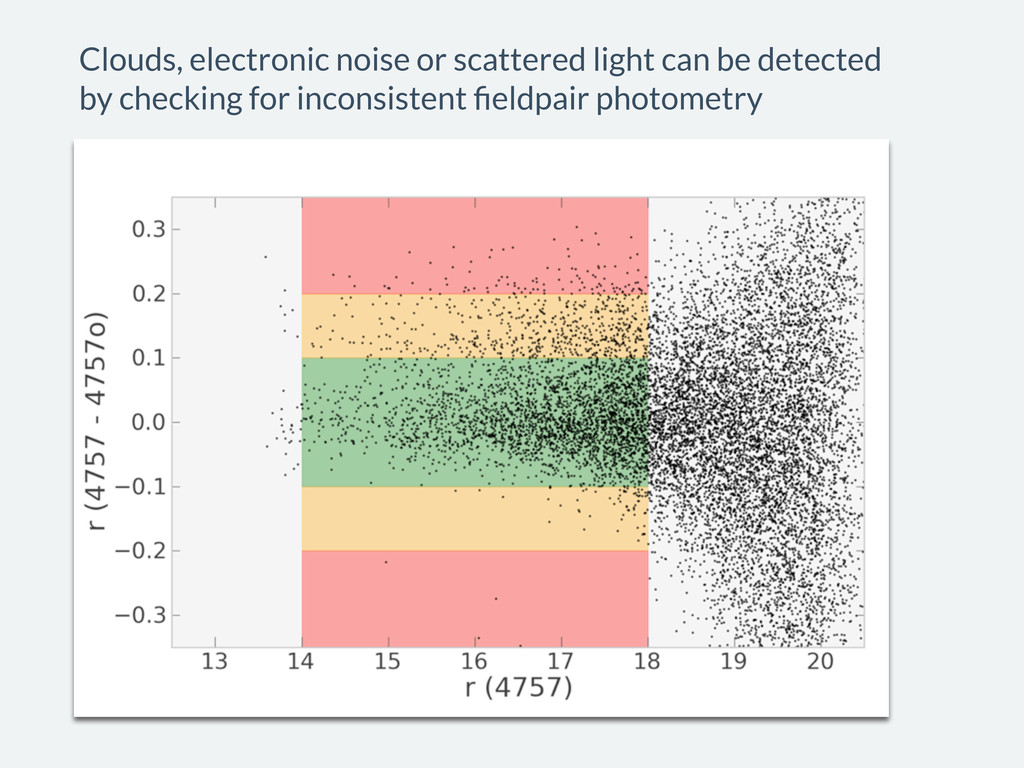
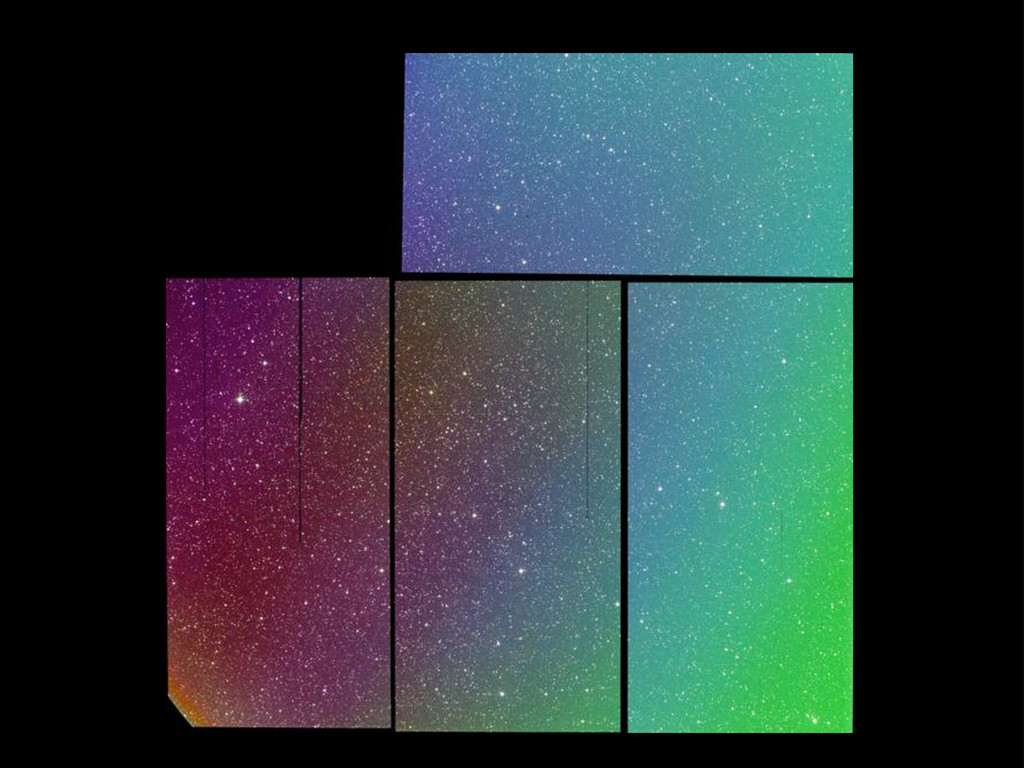
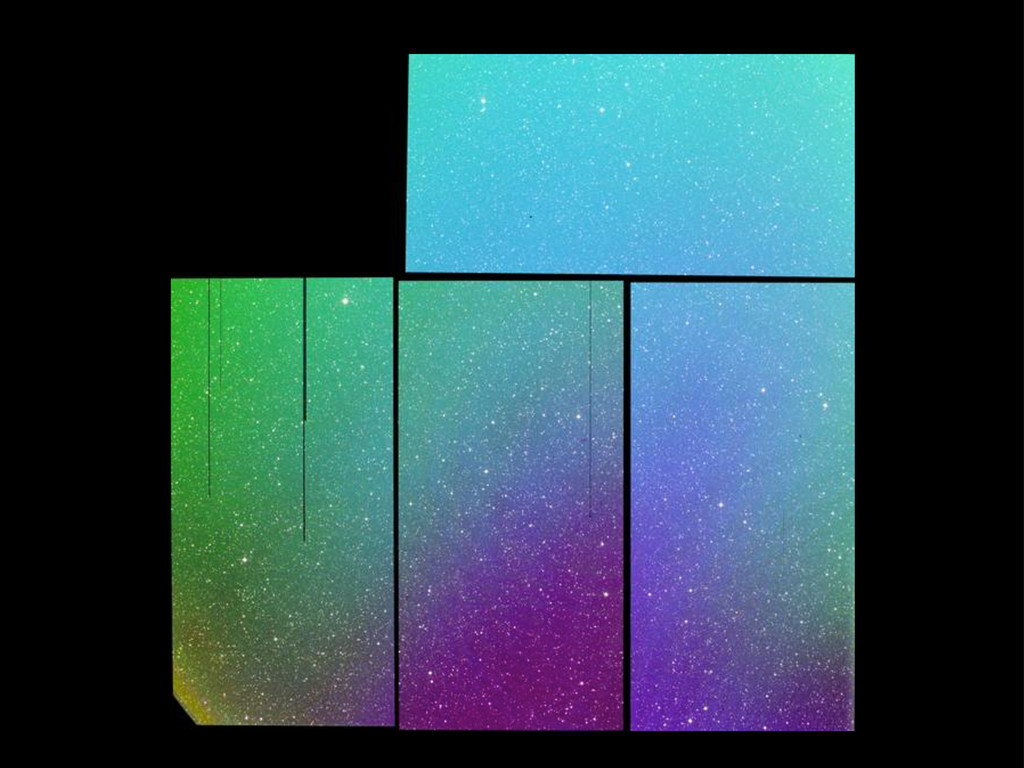
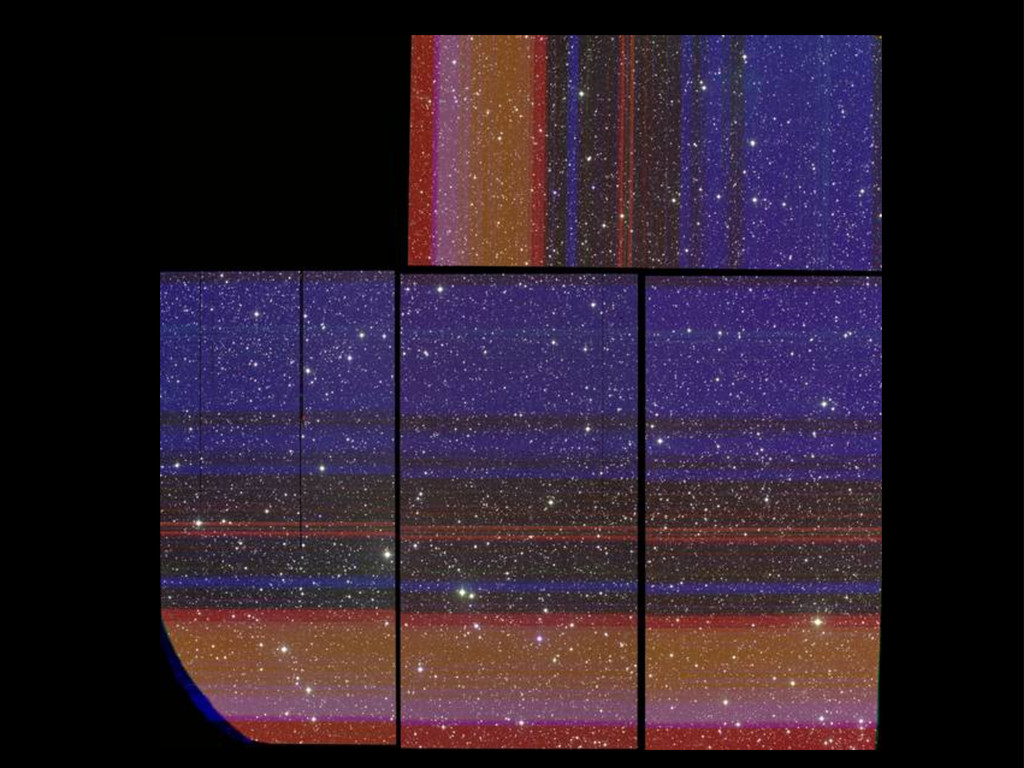
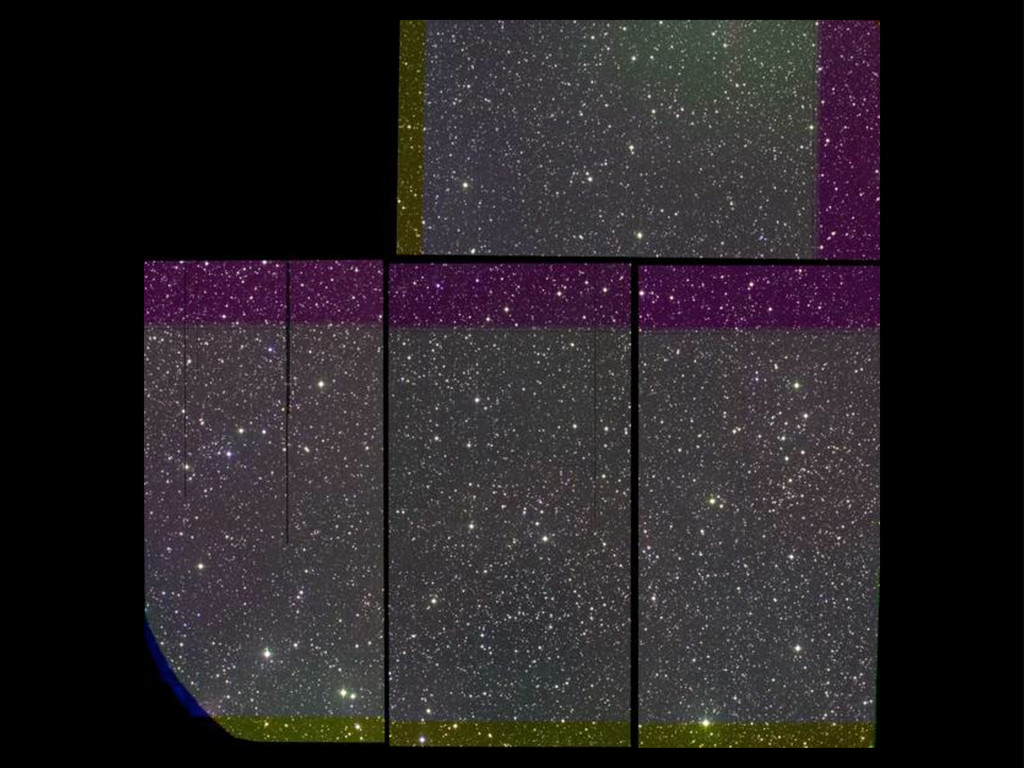
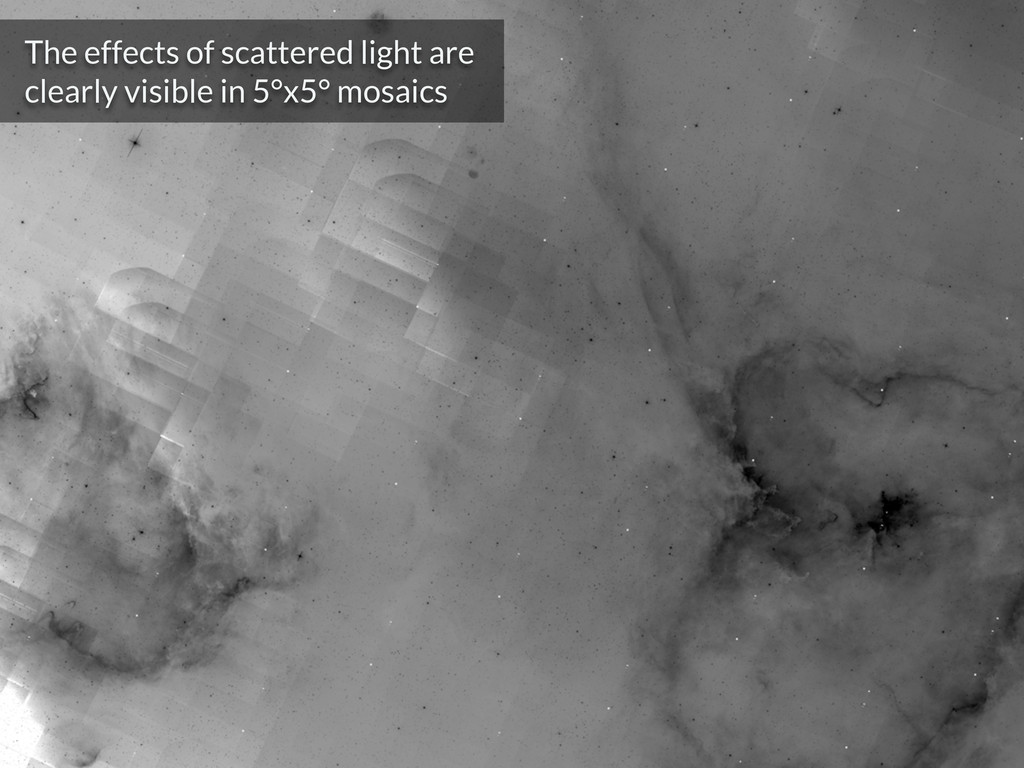
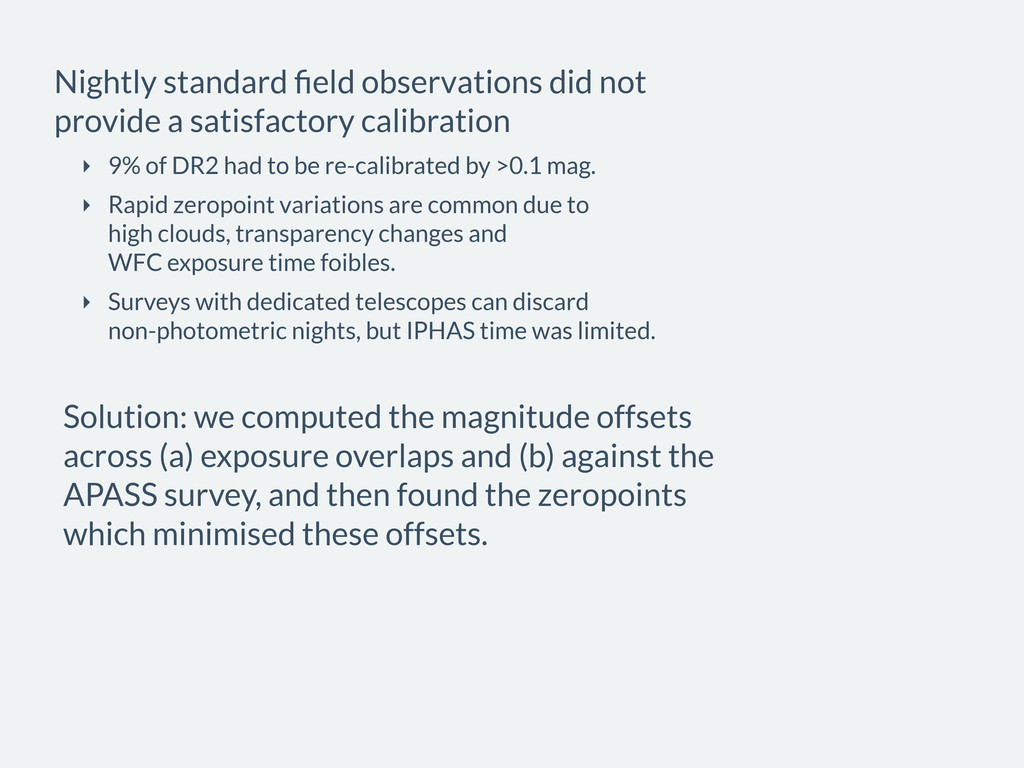
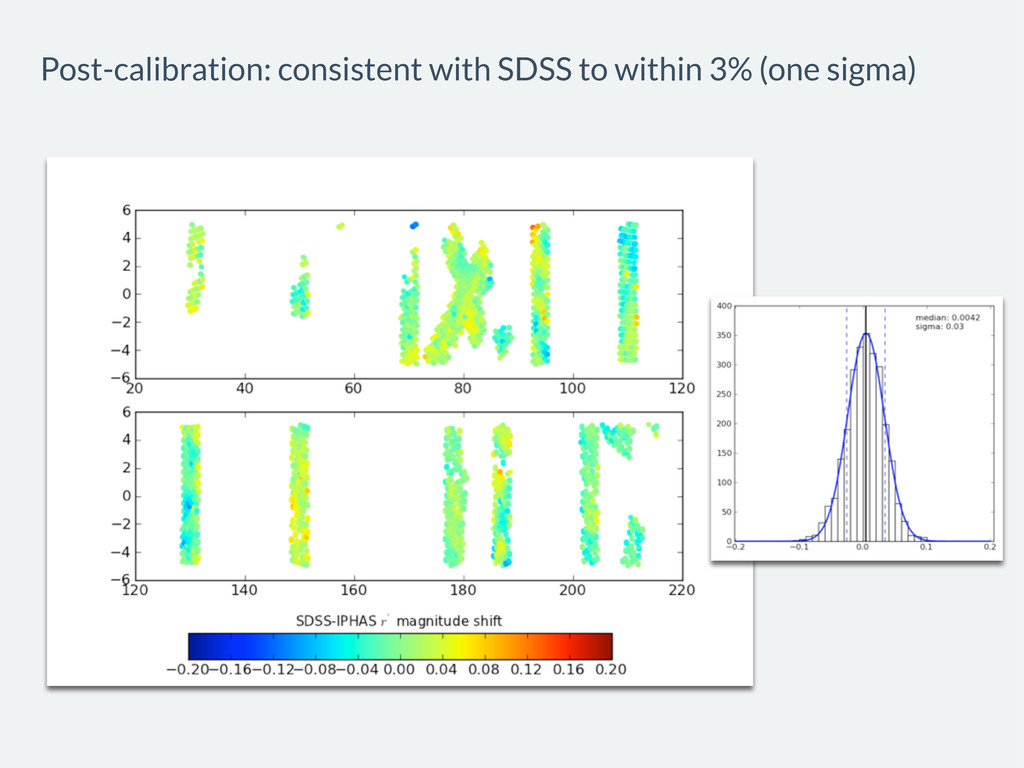
‣ 9% of DR2 had to be re-calibrated by >0.1 mag. ‣ Rapid zeropoint variations are common due to high clouds, transparency changes and WFC exposure time foibles. ‣ Surveys with dedicated telescopes can discard non-photometric nights, but IPHAS time was limited. Solution: we computed the magnitude offsets across (a) exposure overlaps and (b) against the APASS survey, and then found the zeropoints which minimised these offsets.
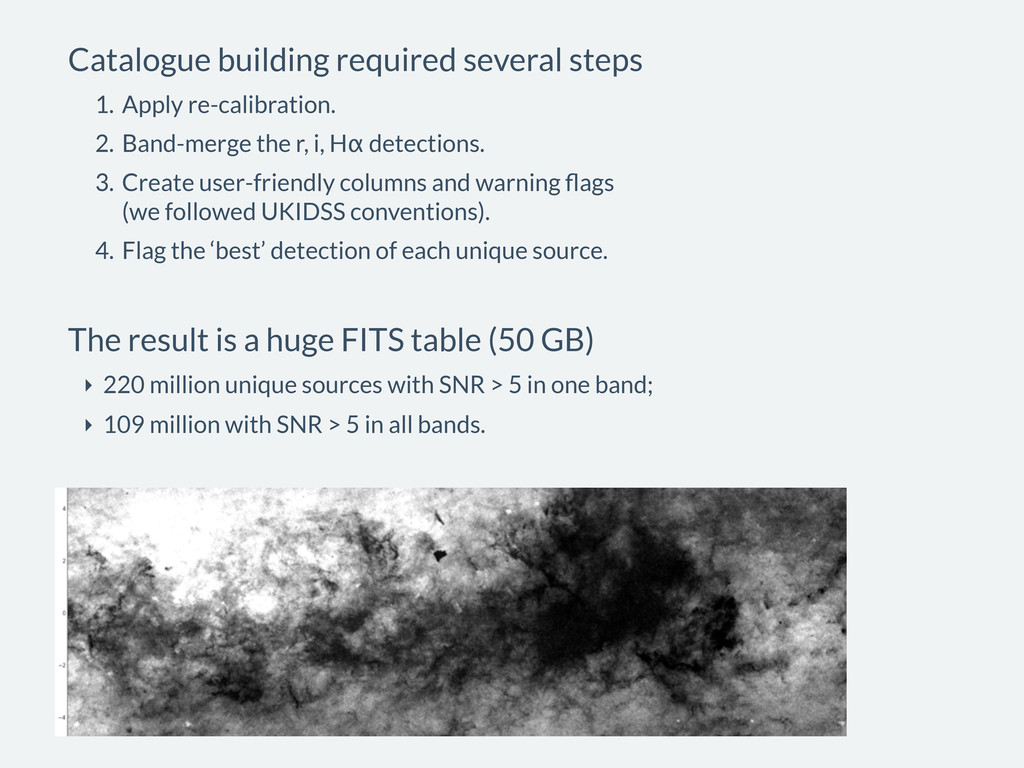
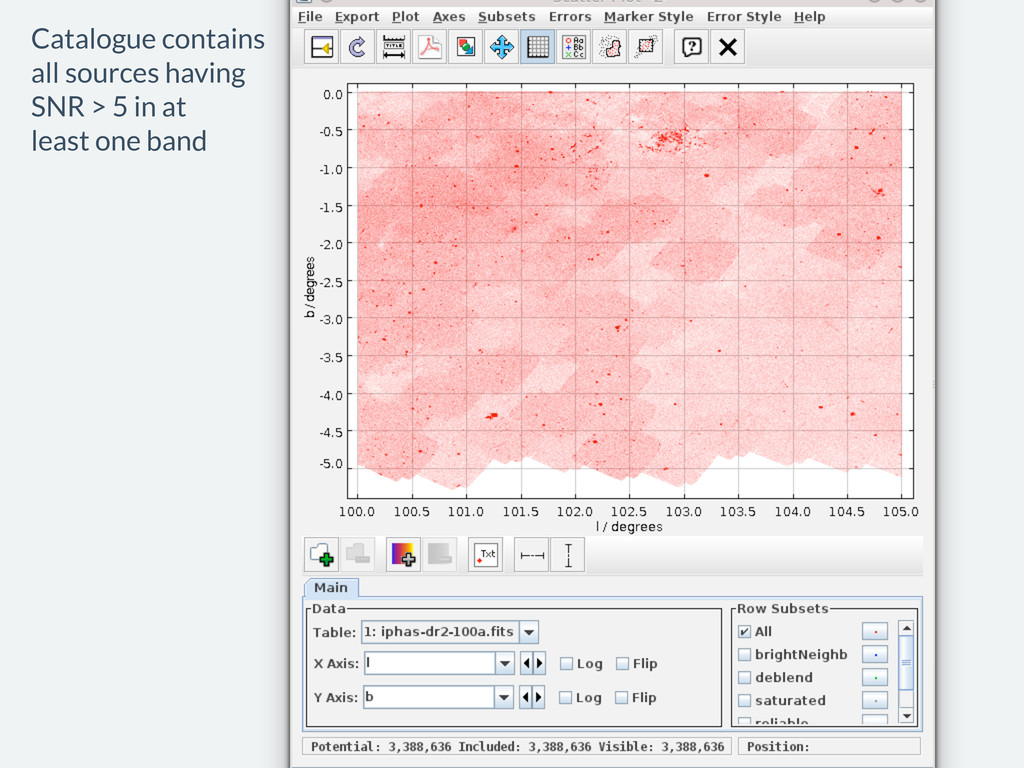
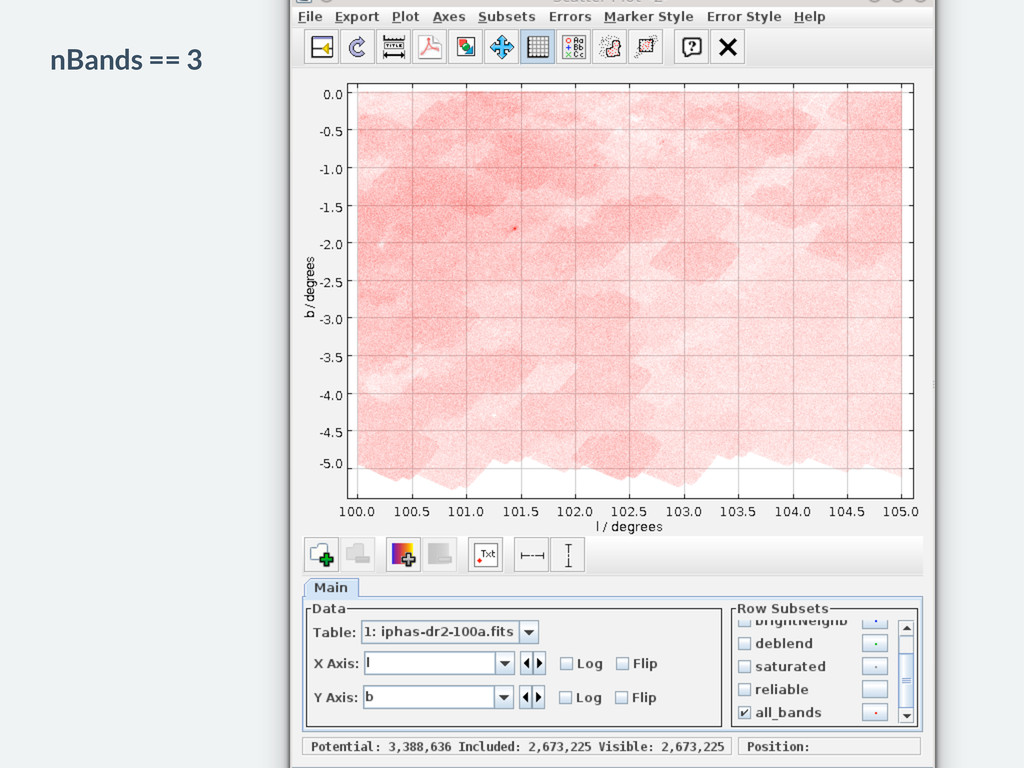
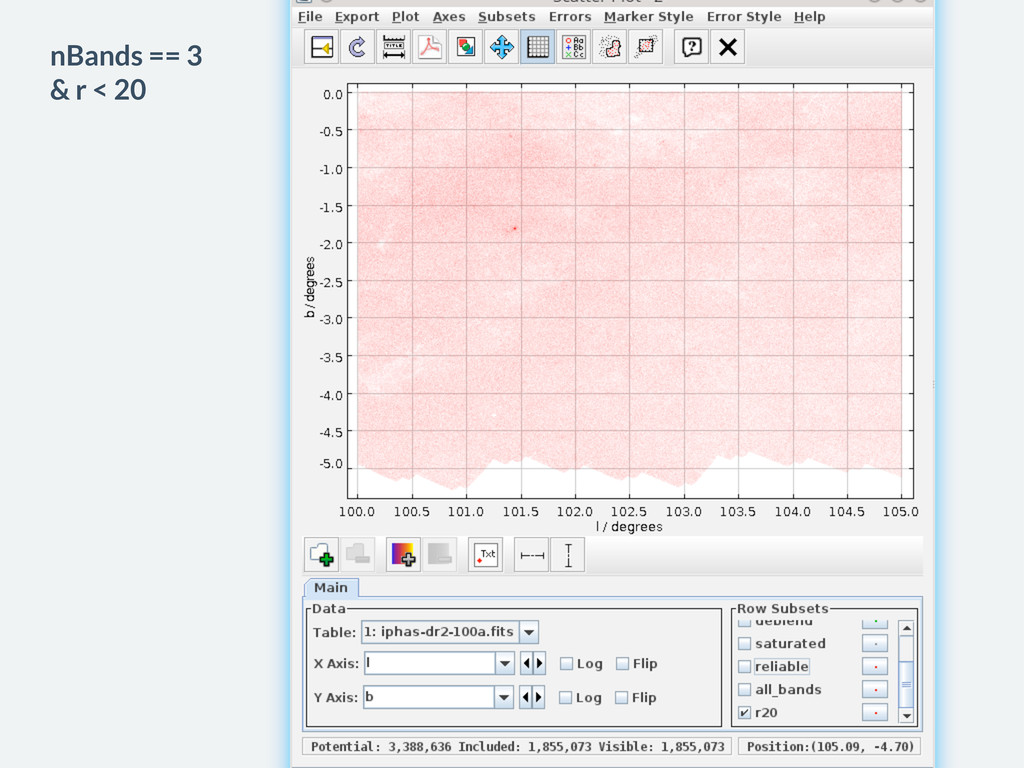
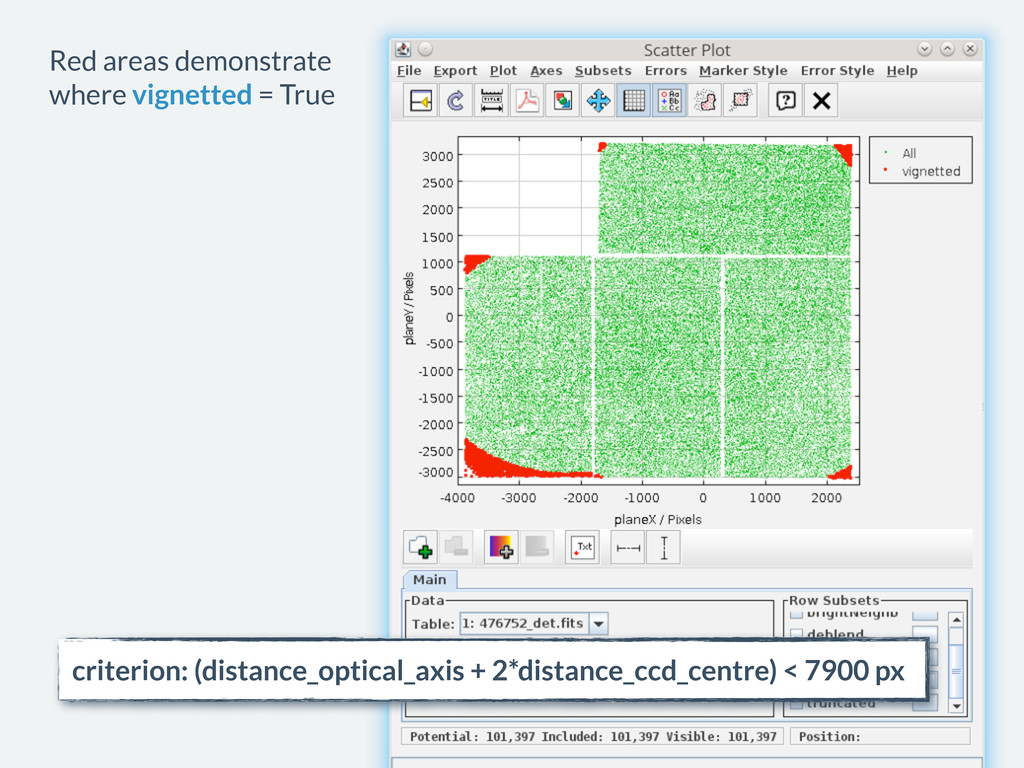
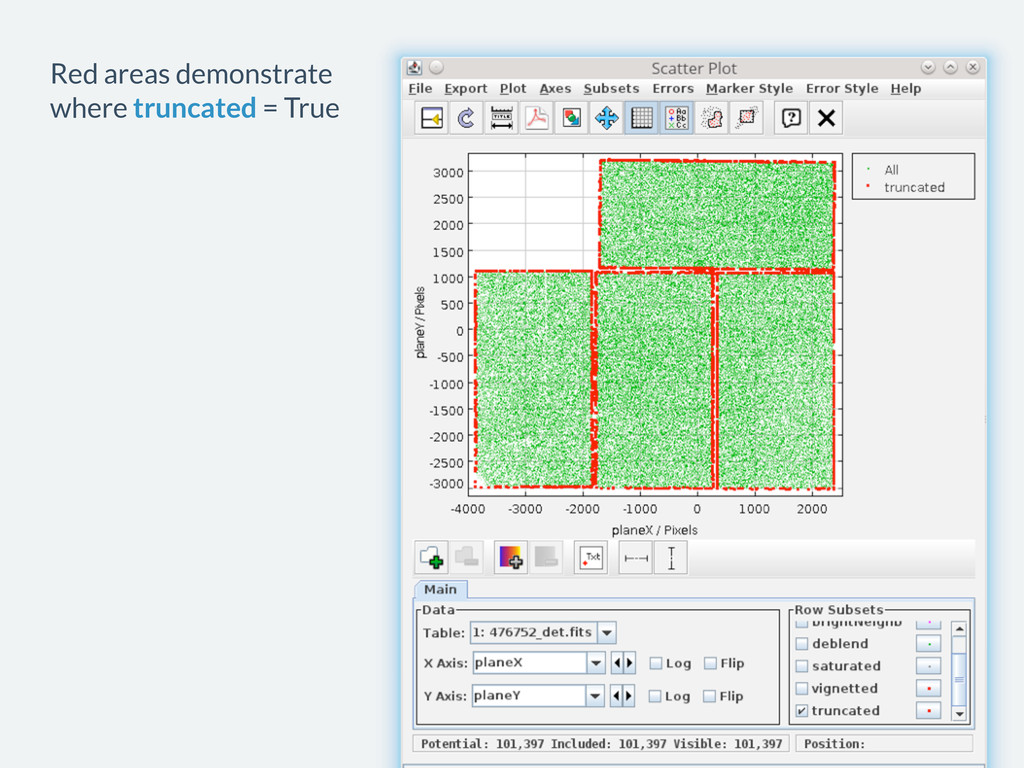
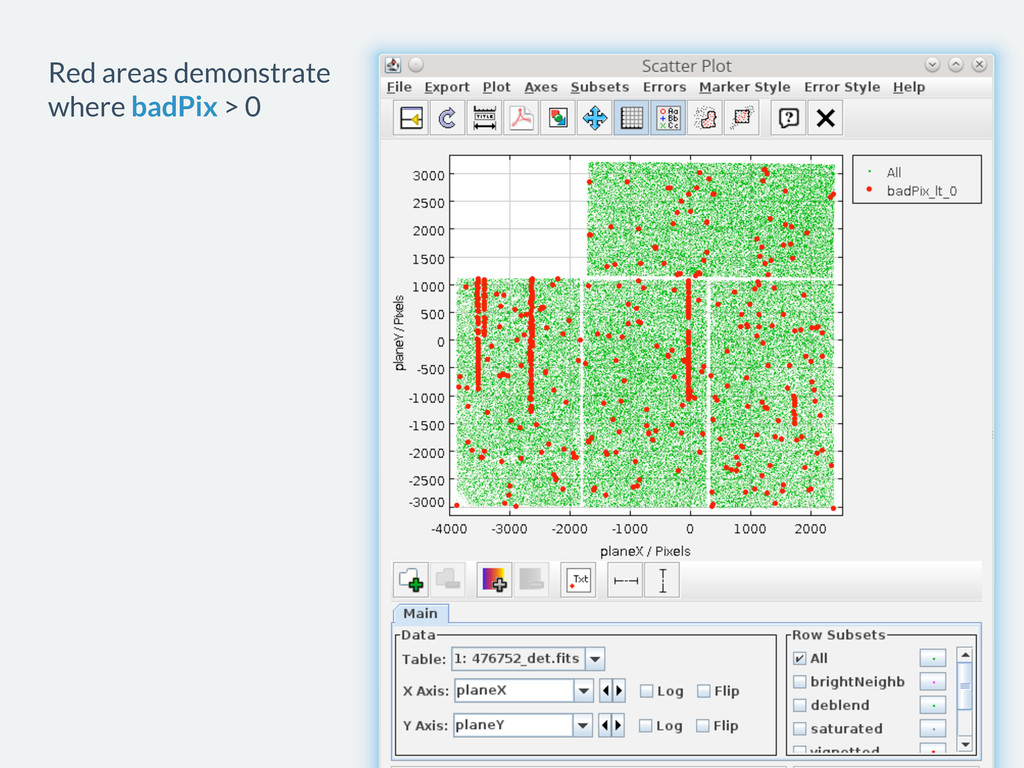
the r, i, Hα detections. 3. Create user-friendly columns and warning flags (we followed UKIDSS conventions). 4. Flag the ‘best’ detection of each unique source. The result is a huge FITS table (50 GB) ‣ 220 million unique sources with SNR > 5 in one band; ‣ 109 million with SNR > 5 in all bands.
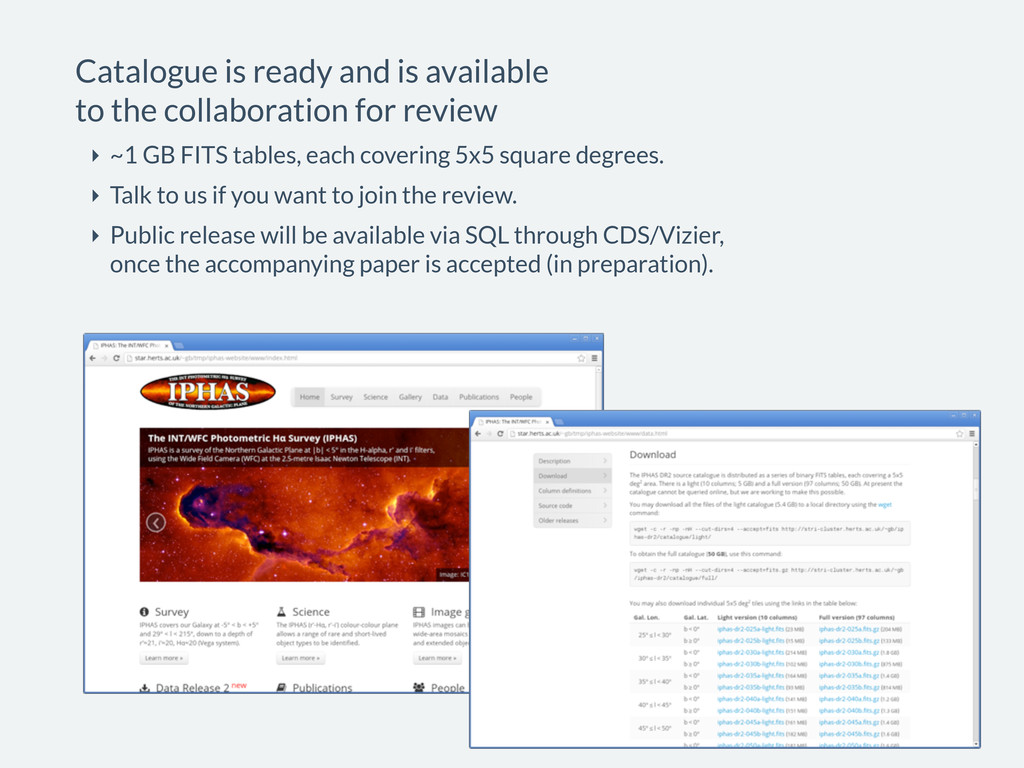
review ‣ ~1 GB FITS tables, each covering 5x5 square degrees. ‣ Talk to us if you want to join the review. ‣ Public release will be available via SQL through CDS/Vizier, once the accompanying paper is accepted (in preparation).
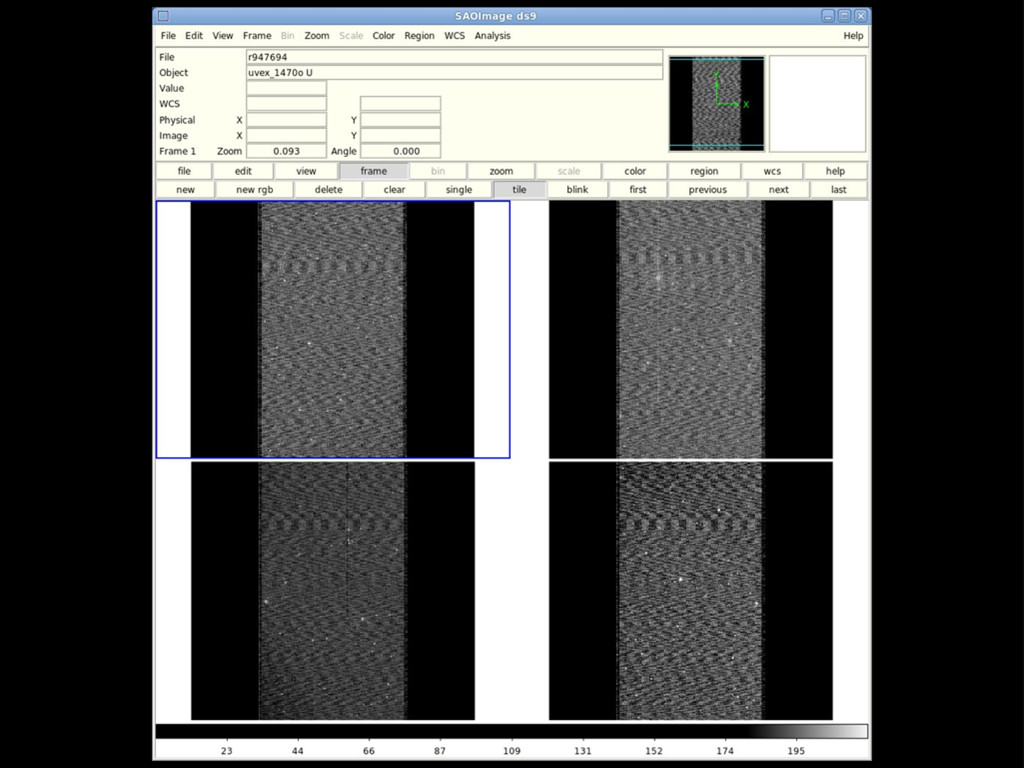
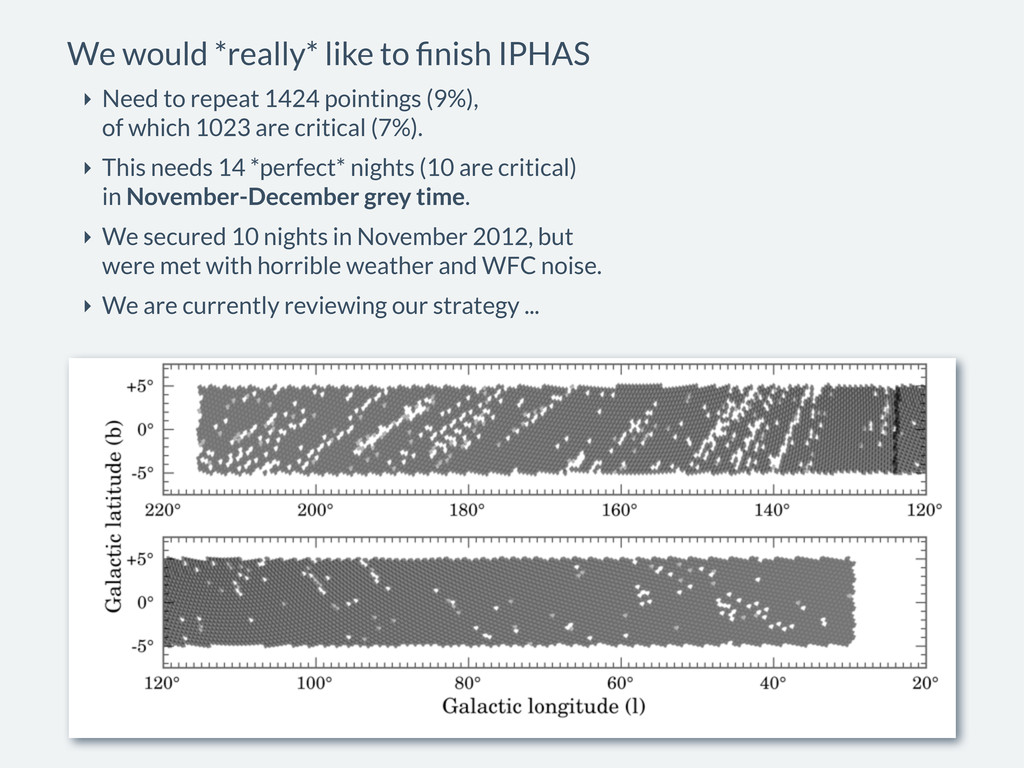
repeat 1424 pointings (9%), of which 1023 are critical (7%). ‣ This needs 14 *perfect* nights (10 are critical) in November-December grey time. ‣ We secured 10 nights in November 2012, but were met with horrible weather and WFC noise. ‣ We are currently reviewing our strategy ...
data exploitation further ‣ IPHAS DR3 catalogue planned ~1 year from now. ‣ We are currently bidding for funding to prepare a full-survey mosaic at arcsecond-resolution. ‣ We will also be bidding for funding to continue our data release work, with the eventual aim of building an integrated IPHAS+UVEX+UKIDSS catalogue which exploits PSF fitting.
INT, IPHAS, is about to release a major legacy data product. ‣ DR2 offers calibrated r, i, Hα photometry for up to 220 million sources across 93% of the northern Galactic plane. ‣ We still need 10-14 good, grey, Nov-Dec nights to finish. ‣ IPHAS DR2 is a template for future IPHAS/UVEX/VPHAS data releases, subject to manpower.
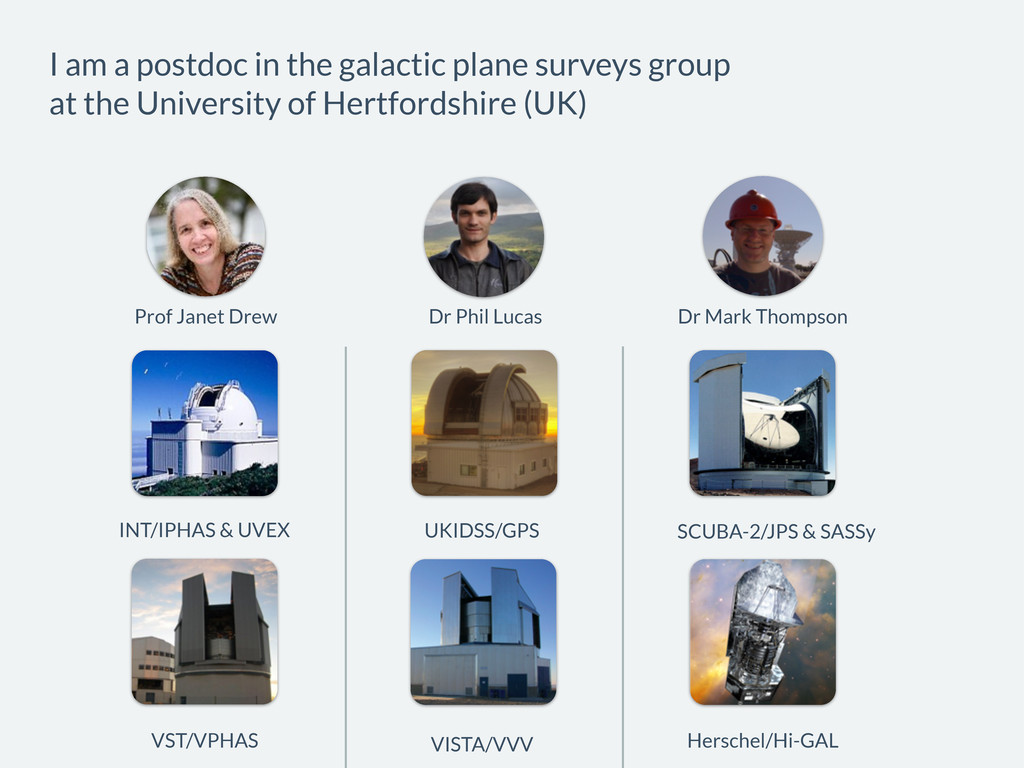
PI) University of Cambridge (pipeline) University of Graz Other members: Instituto de Astrofísica de Canarias, Harvard/Smithsonian CfA, University College London, Imperial College London, University of Warwick, University of Manchester, University of Southampton, Armagh Observatory, Macquarie University, Tautenburg Observatory, ESTEC, University of Valencia. Key individuals: Janet Drew (IPHAS lead), Hywel Farnhill, Geert Barentsen, Robert Greimel, Mike Irwin, Eduardo Gonzalez-Solares, Romano Corradi, Paul Groot (UVEX lead), Danny Steeghs, and many more. Credits