many roads to accomplish that and many tools available, that help you with it. i'll not going to show you all of them, but just what we ended up using at ResearchGate. They work great for us, but depending on your use cases other tools may be more suited to your needs. The important thing to get out of this talk: take care of it
throughout this talk, if you don't understand something, just raise your hand and ask. probably my fault anyways since i spoke to quickly or my accent was too bad
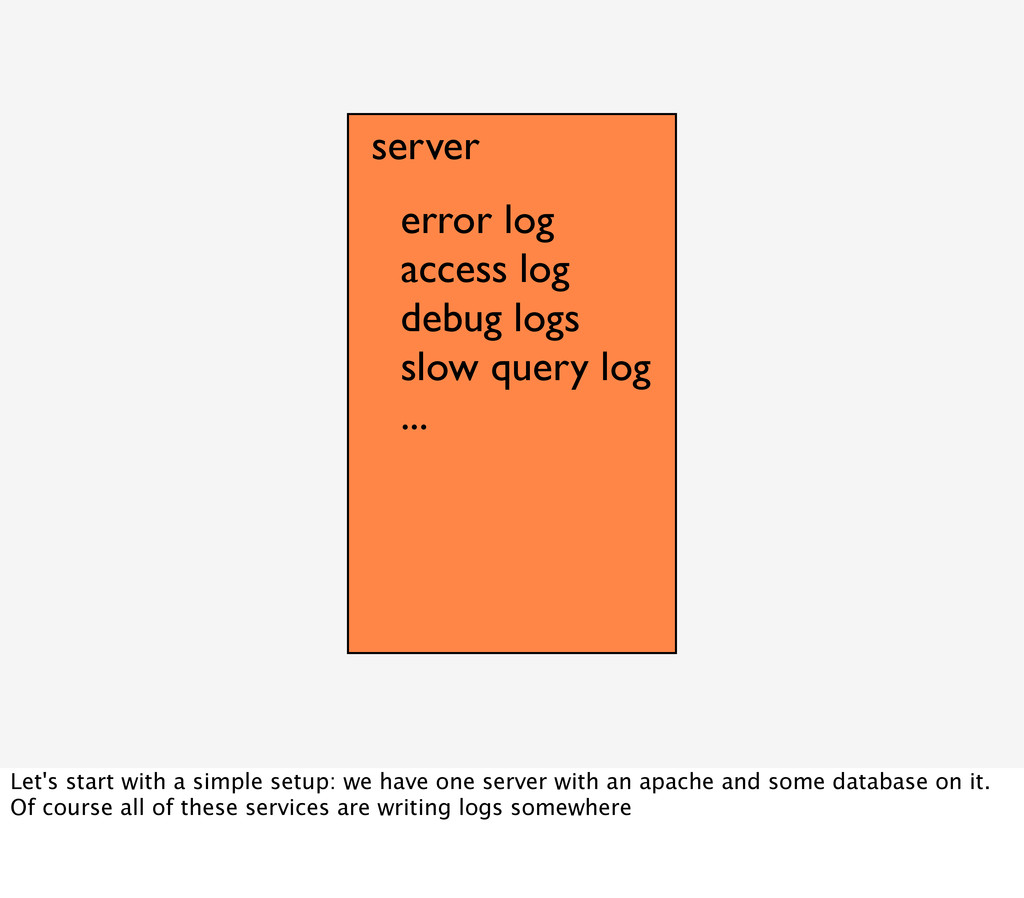
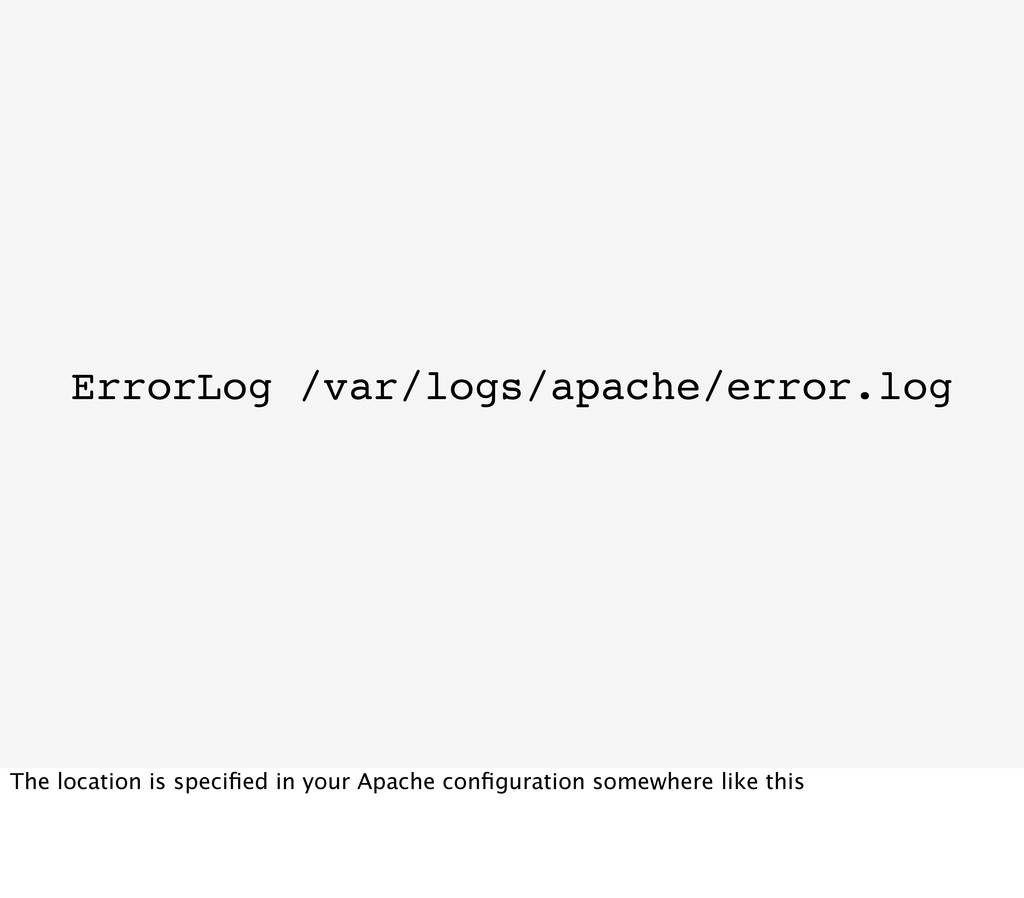
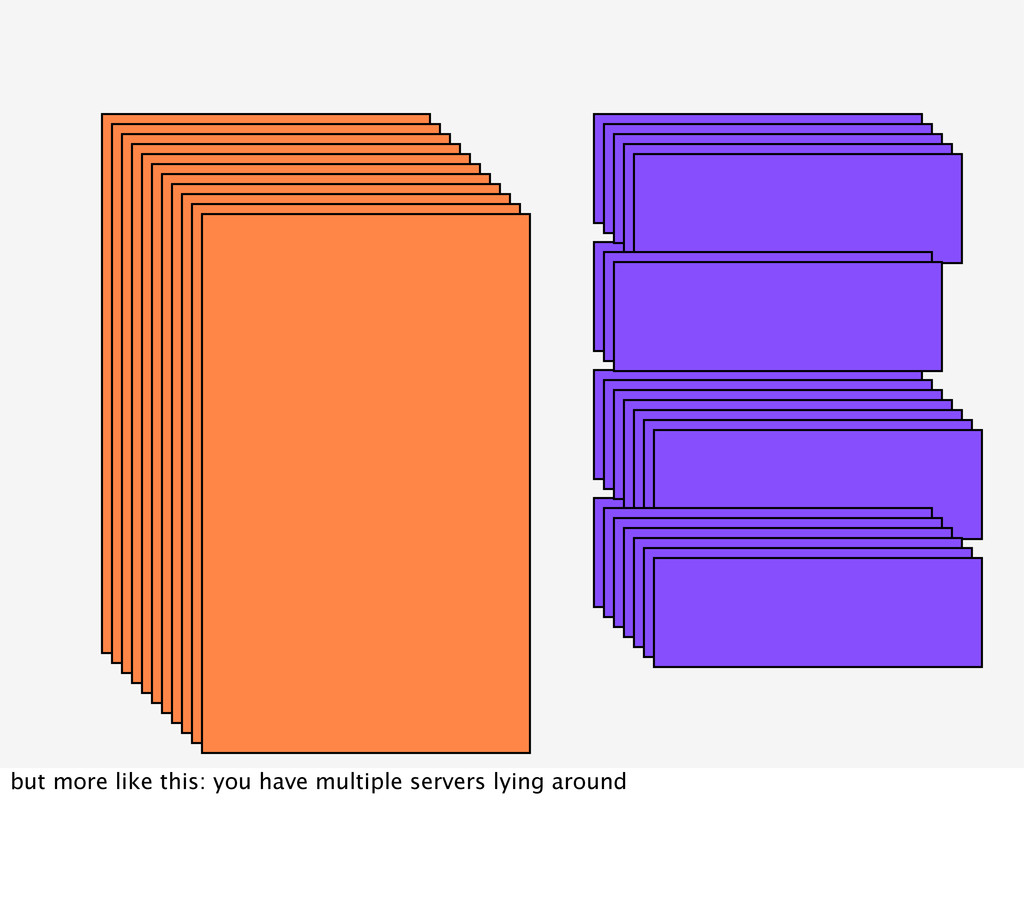
... Let's start with a simple setup: we have one server with an apache and some database on it. Of course all of these services are writing logs somewhere
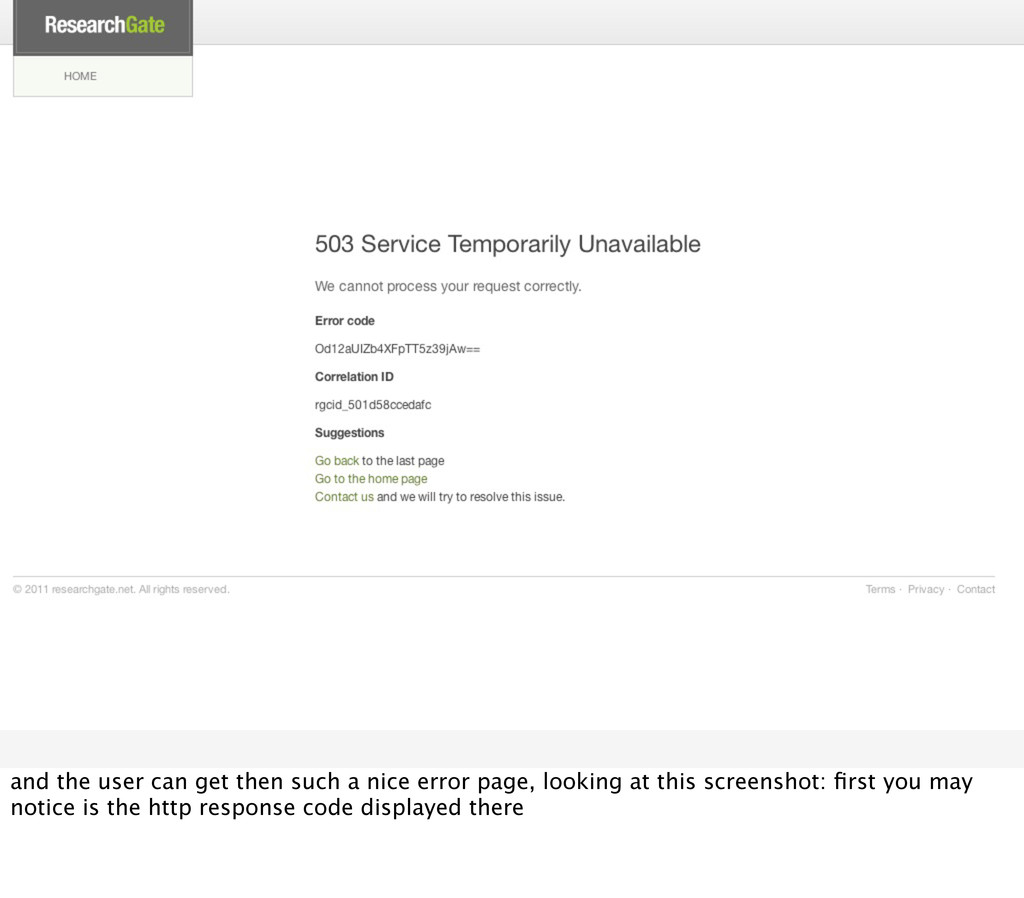
and choose correct ones for your application. helps you greatly with filtering the important stuff from the unimportant later on: a 503 may be much more serious then a 404
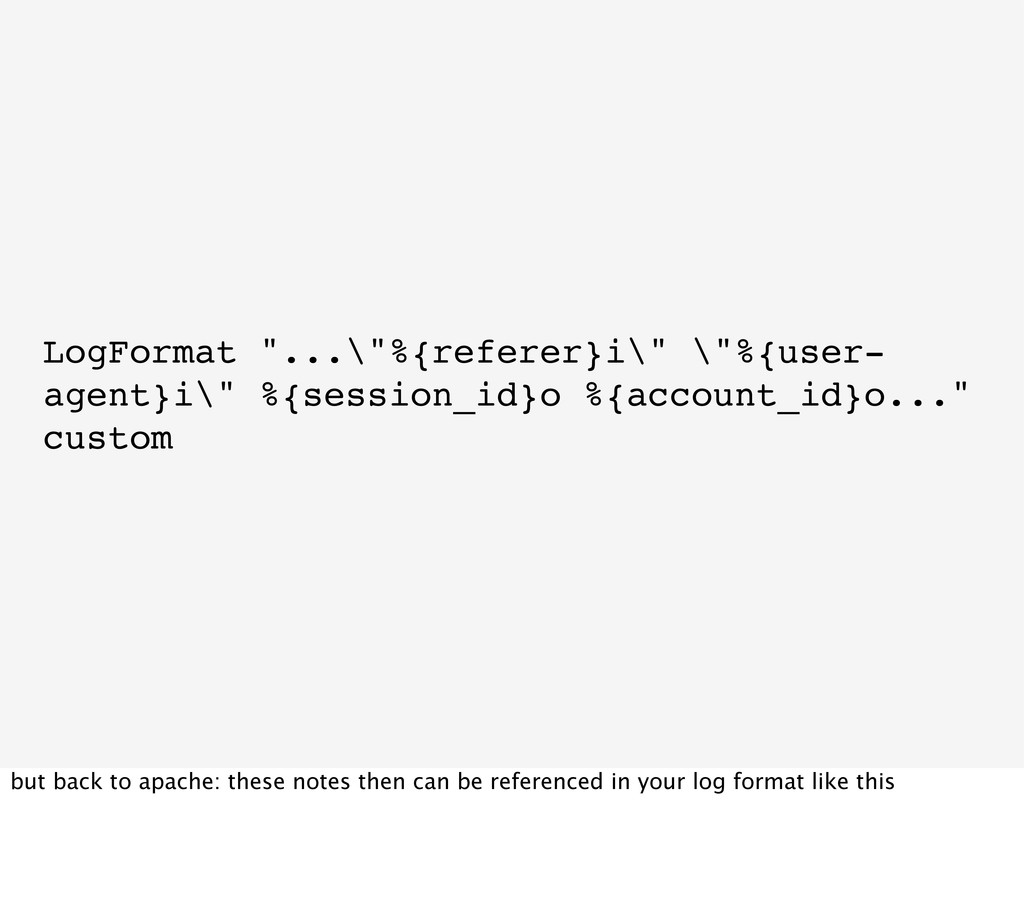
this information but also write it to your log files, you can easily do this in your custom error handler, and if you need to find the error that resulted in this error page you can just grep for the error code
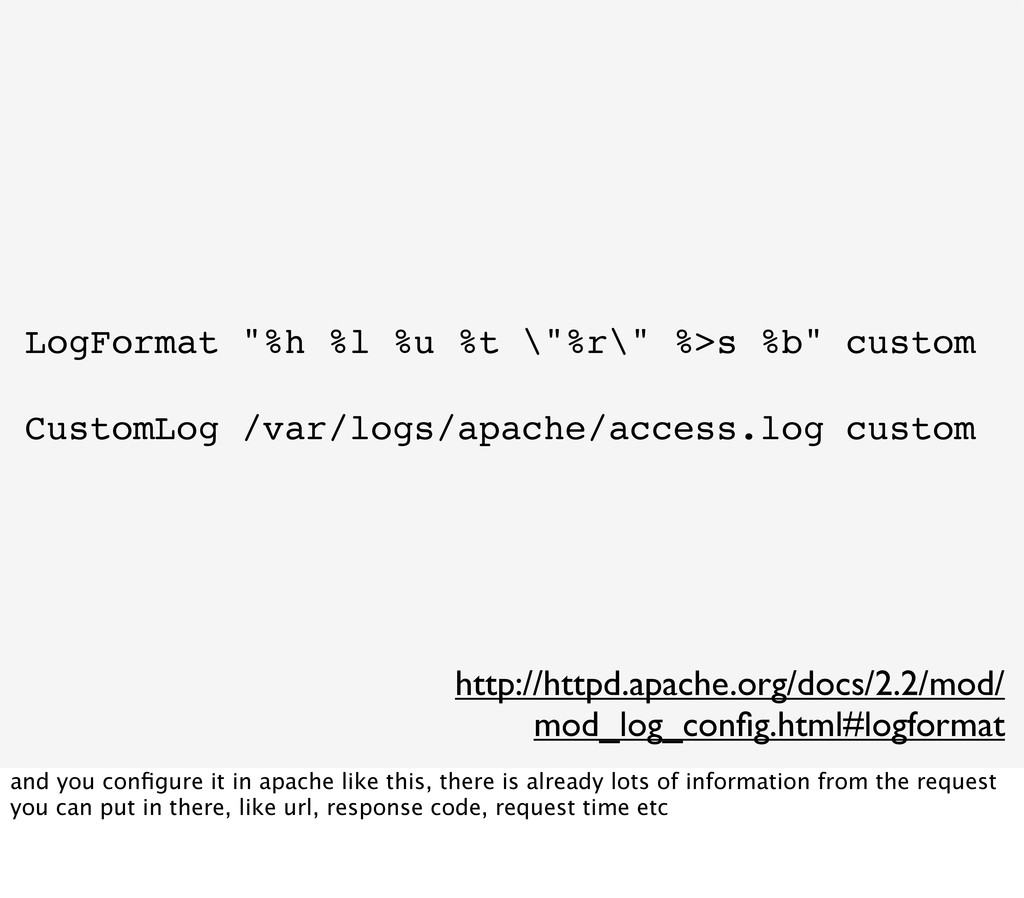
/var/logs/apache/access.log custom http://httpd.apache.org/docs/2.2/mod/ mod_log_config.html#logformat and you configure it in apache like this, there is already lots of information from the request you can put in there, like url, response code, request time etc
result in huge amount of log files, and in 99% of requests you are not interested in them you should have a look at fingers crossed handlers for logging: you just put your logs in this handler but it does not log them directly to a file, only when a certain condition was met, like a threshold all already written logs and all further logs are written to a file
you greatly with managing huge amount of logs with lot's of different additional information in it is logging in a structured way (not only for debug but also for error logs)
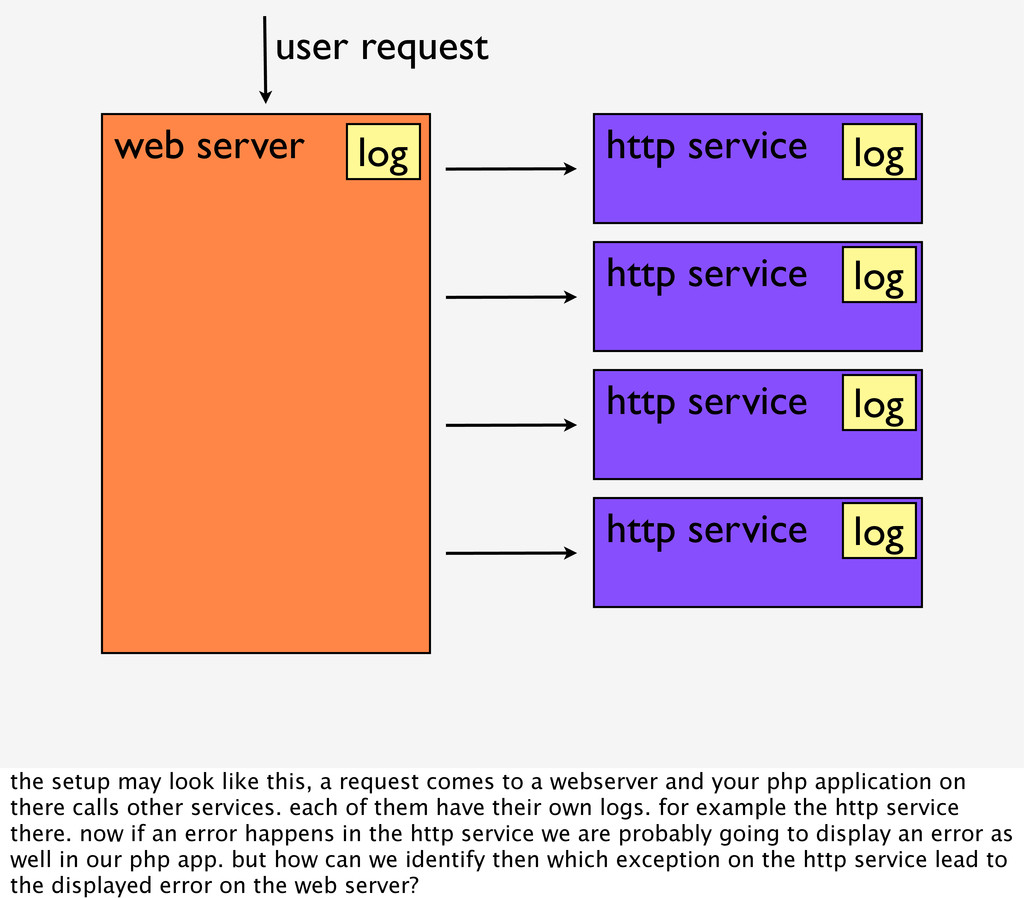
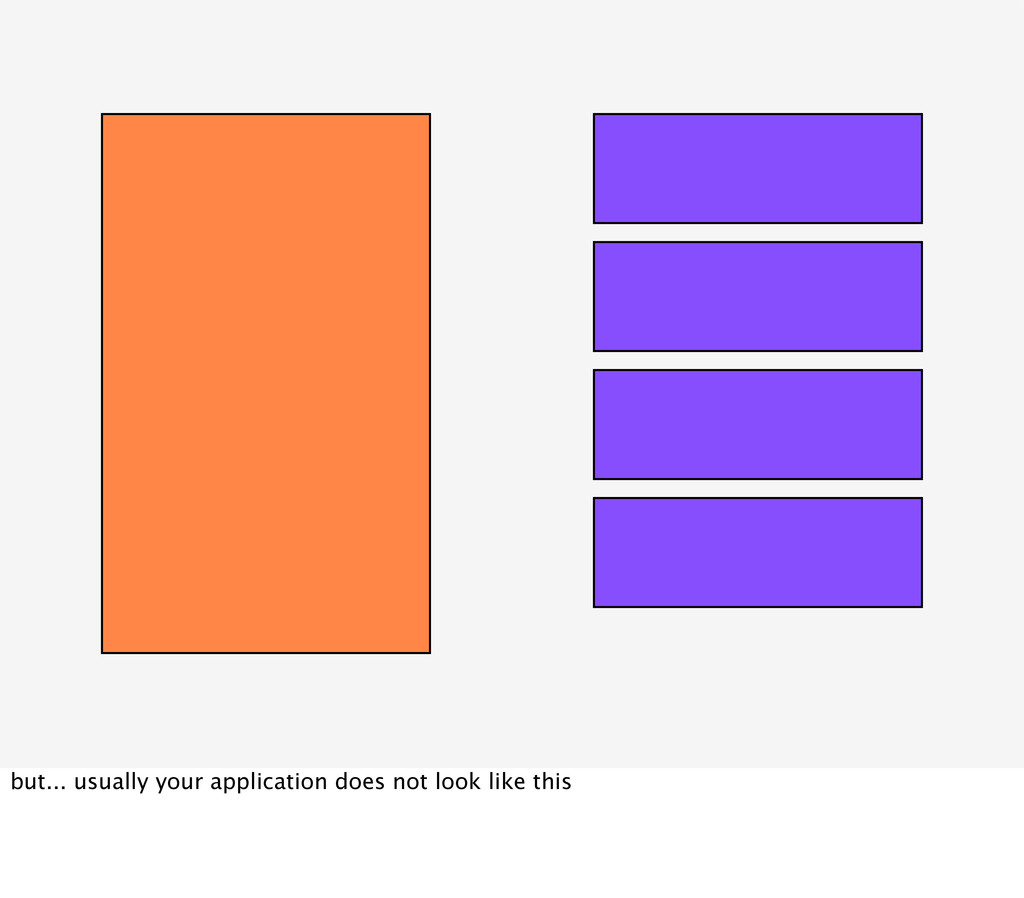
user request log log log log log the setup may look like this, a request comes to a webserver and your php application on there calls other services. each of them have their own logs. for example the http service there. now if an error happens in the http service we are probably going to display an error as well in our php app. but how can we identify then which exception on the http service lead to the displayed error on the web server?
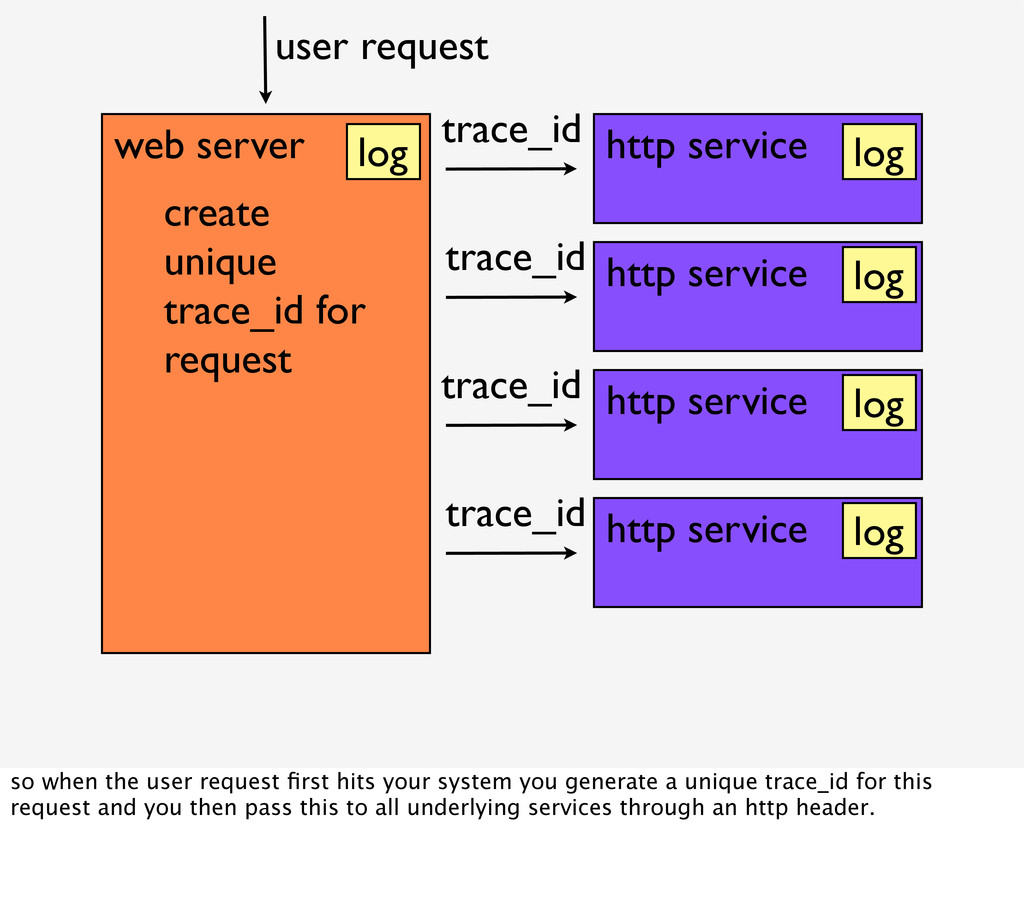
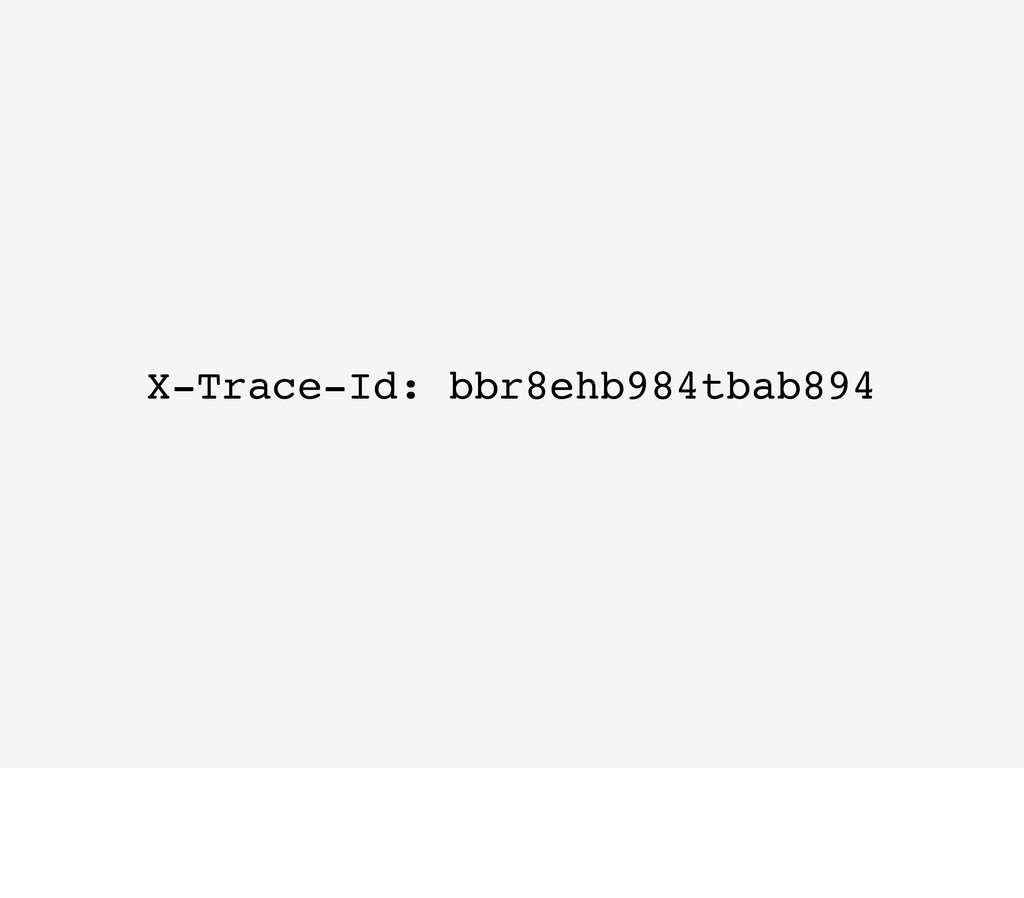
create unique trace_id for request user request trace_id trace_id trace_id trace_id log log log log log so when the user request first hits your system you generate a unique trace_id for this request and you then pass this to all underlying services through an http header.
create unique trace_id for request user request trace_id trace_id trace_id trace_id log log log log log everyone then puts these tracing id in every logs they write. so if you have a tracing id you can easily find all logs for this request by just greping for the trace_id
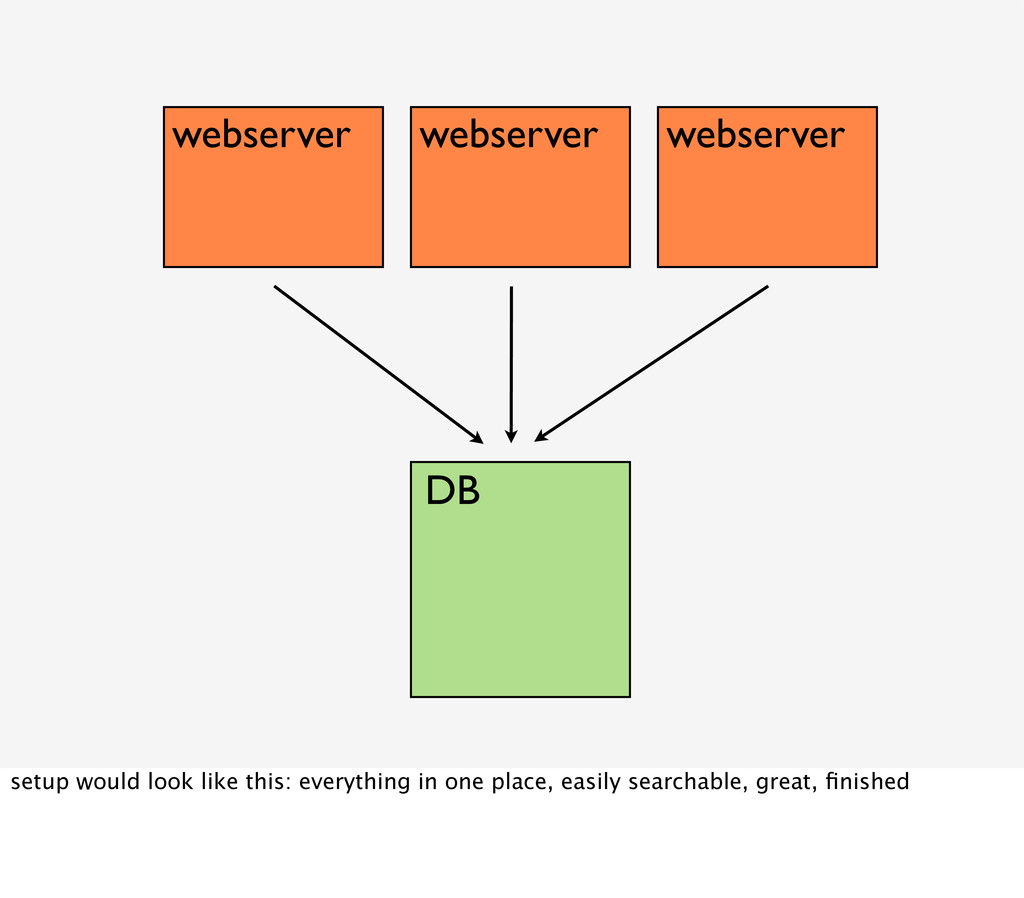
are doing, and chances are if there are problems on your platform and multiple errors are occurring, directly writing to a database will make your problems worse
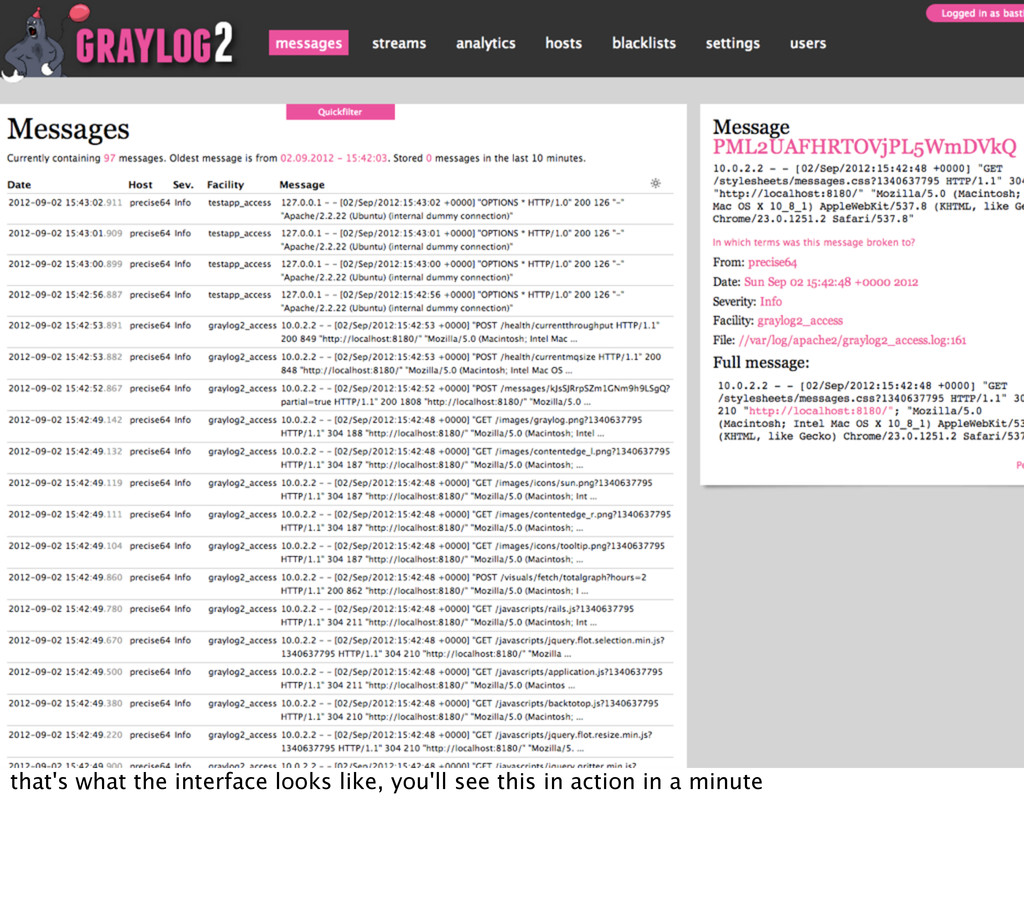
and monitor exceptions, of course there are sql clients, phpmyadmin, rockmongo etc, but they are multi purpose tools and not really made for displaying and filtering logs
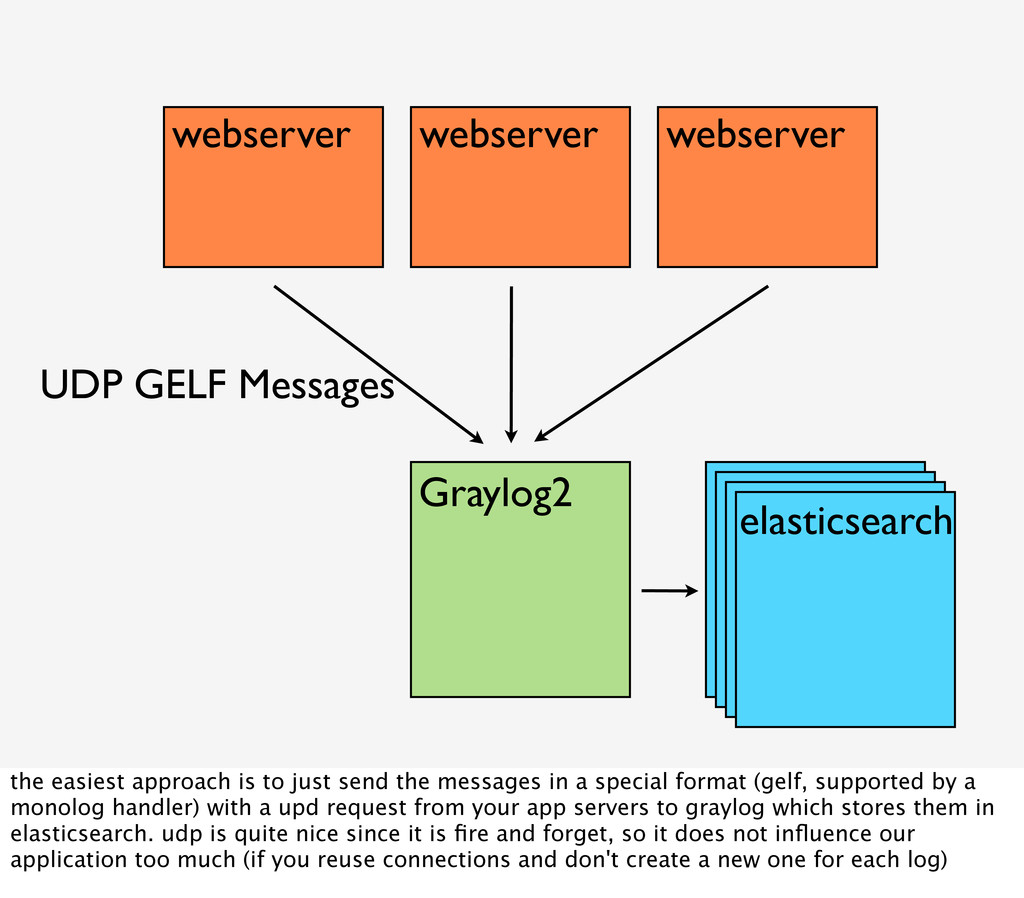
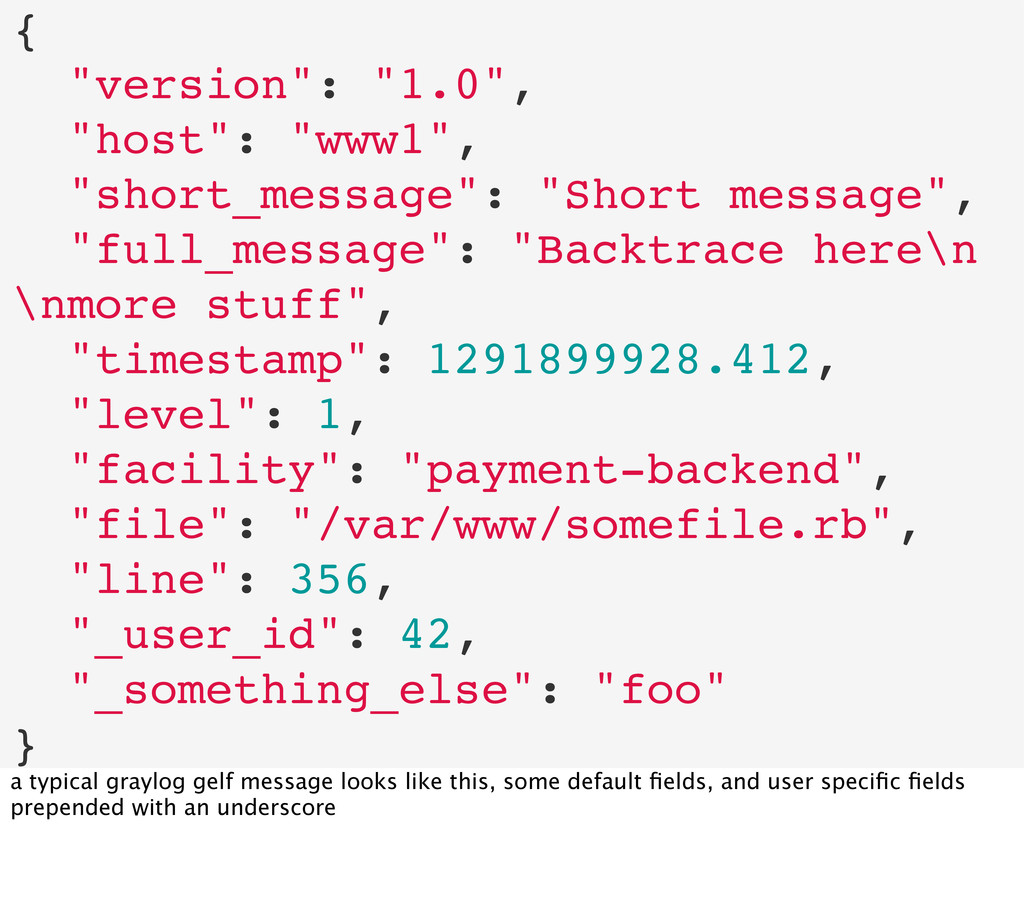
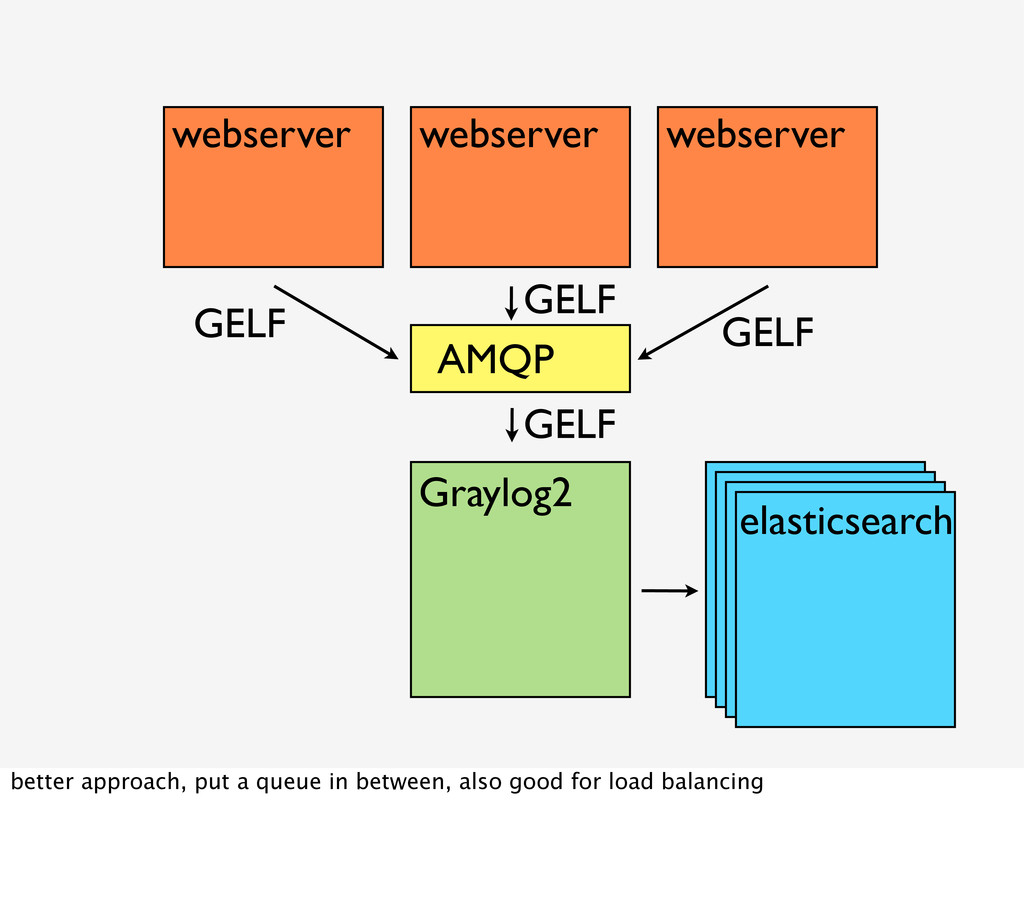
approach is to just send the messages in a special format (gelf, supported by a monolog handler) with a upd request from your app servers to graylog which stores them in elasticsearch. udp is quite nice since it is fire and forget, so it does not influence our application too much (if you reuse connections and don't create a new one for each log)
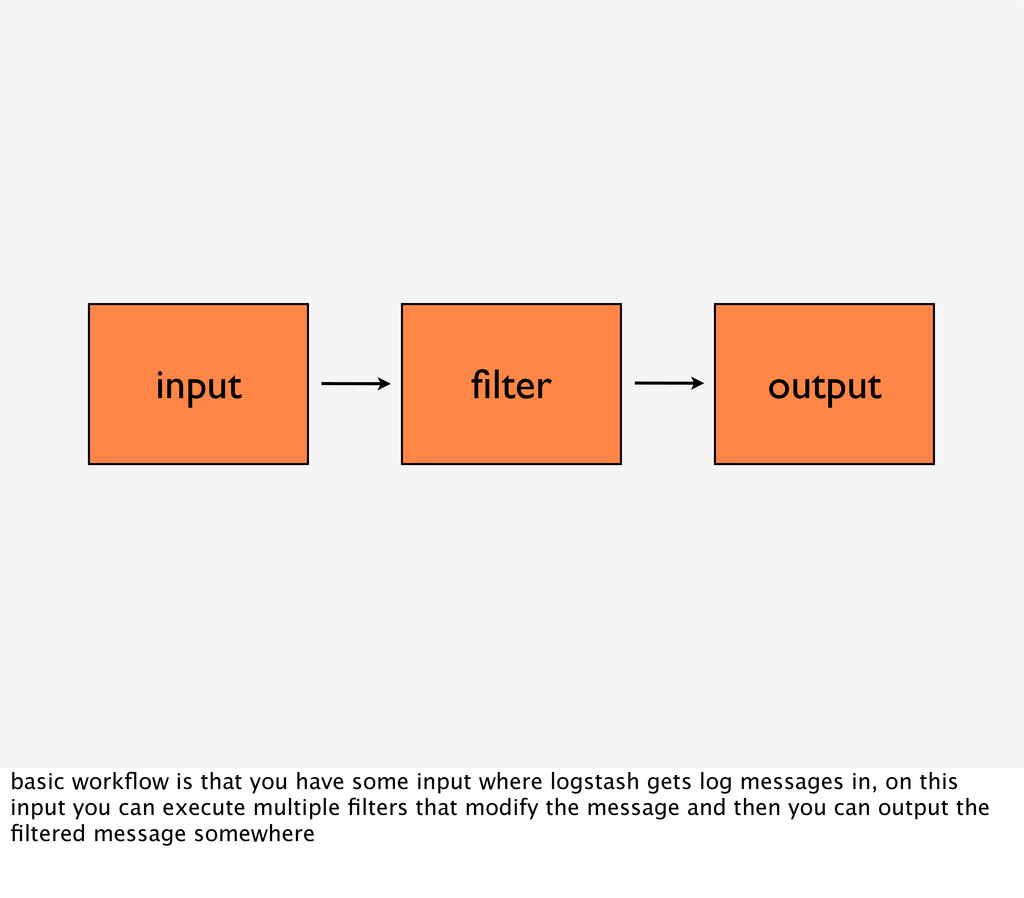
input where logstash gets log messages in, on this input you can execute multiple filters that modify the message and then you can output the filtered message somewhere
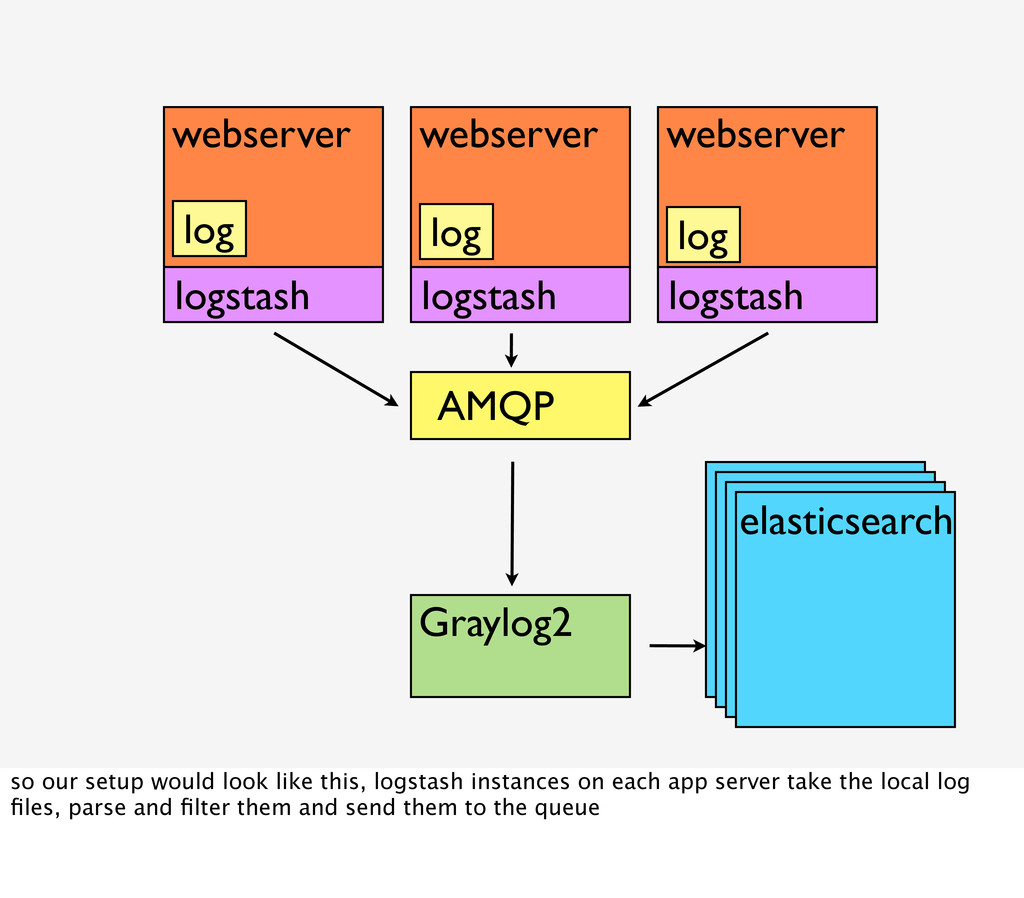
logstash logstash so our setup would look like this, logstash instances on each app server take the local log files, parse and filter them and send them to the queue
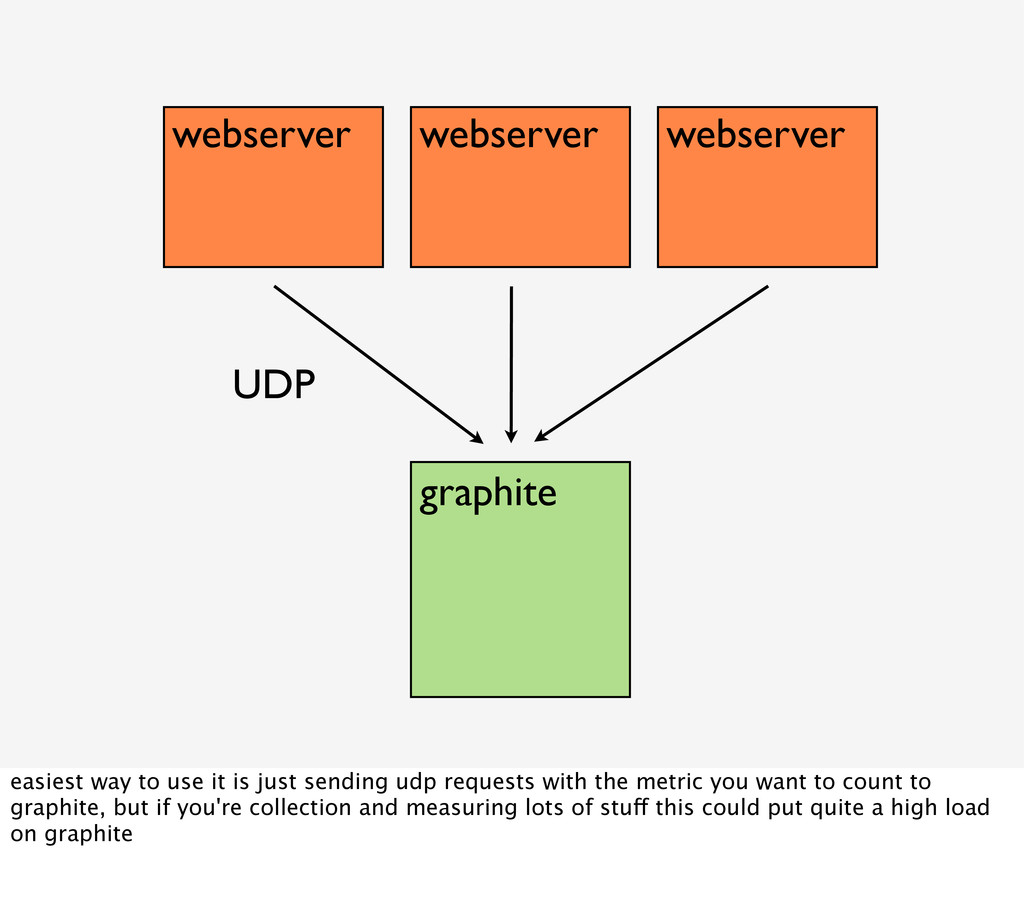
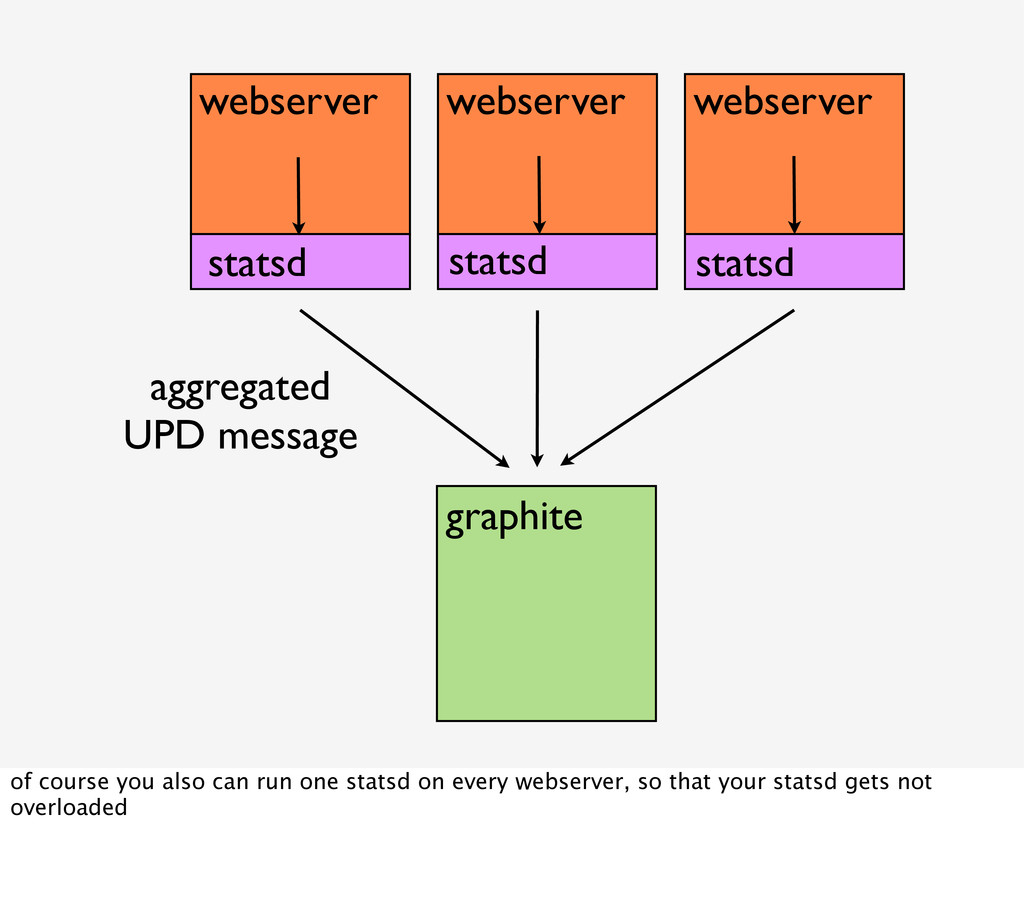
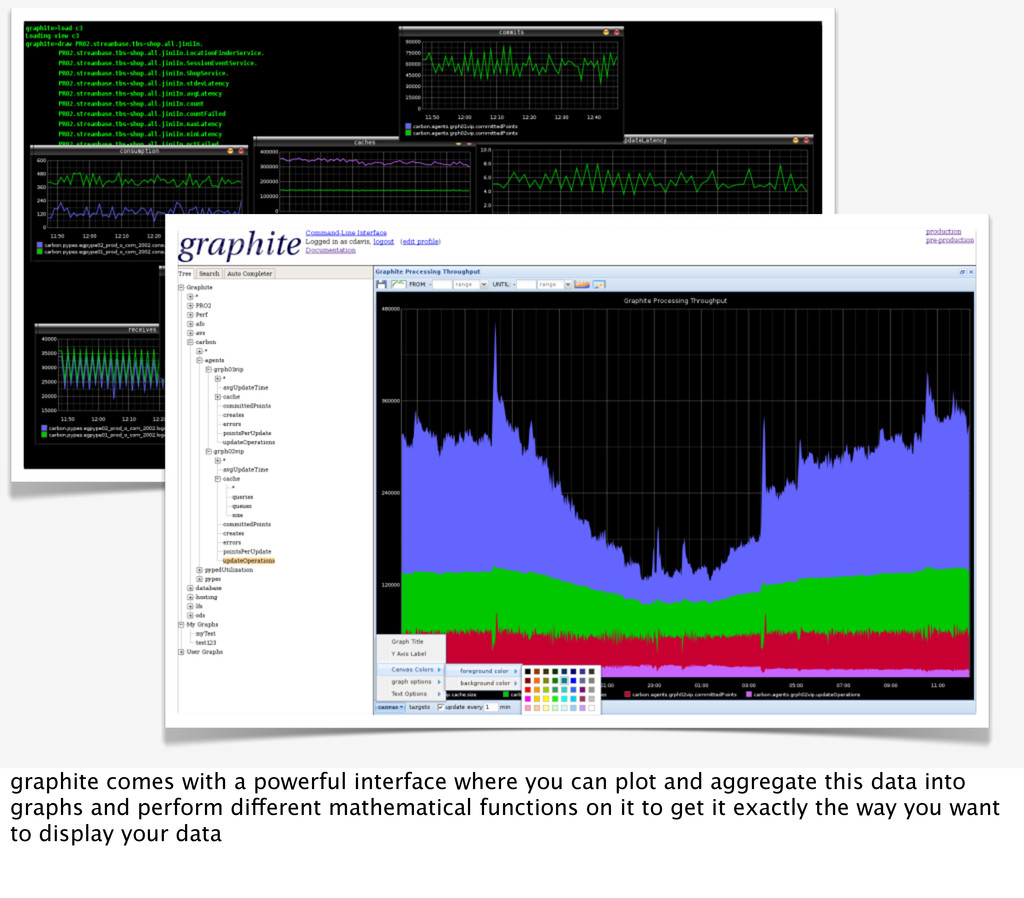
is just sending udp requests with the metric you want to count to graphite, but if you're collection and measuring lots of stuff this could put quite a high load on graphite
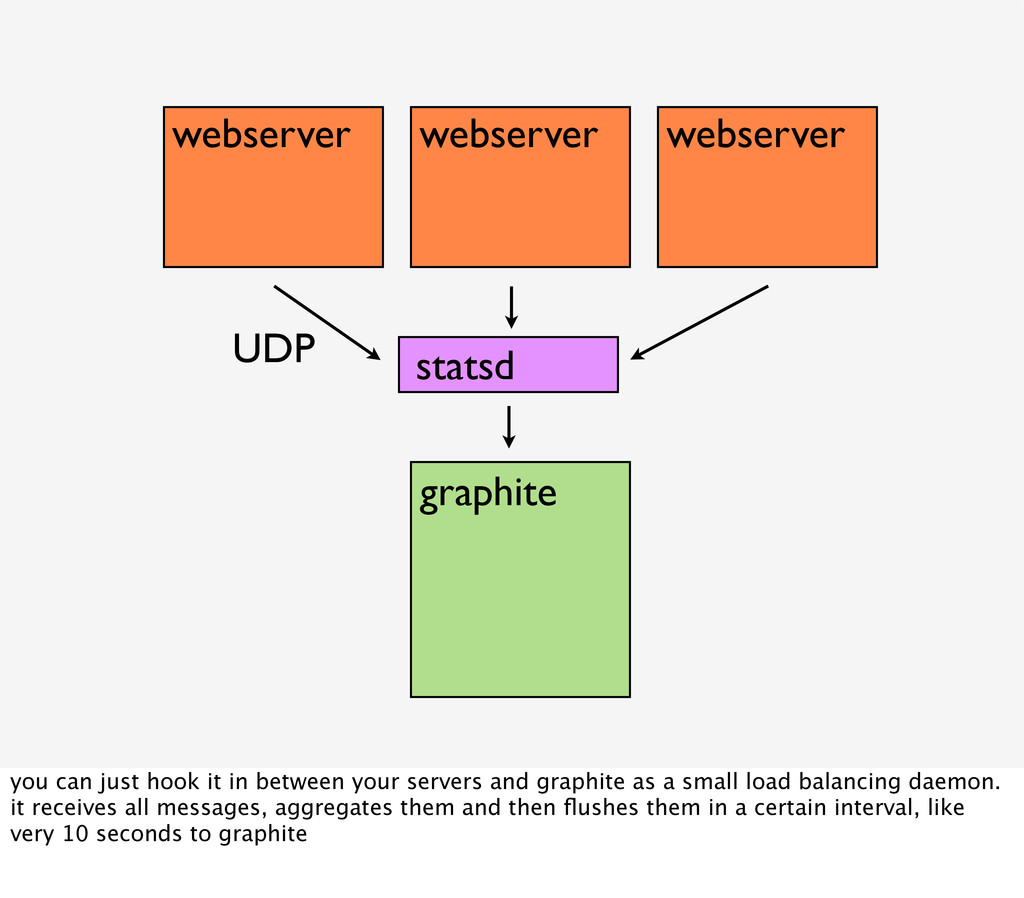
it in between your servers and graphite as a small load balancing daemon. it receives all messages, aggregates them and then flushes them in a certain interval, like very 10 seconds to graphite
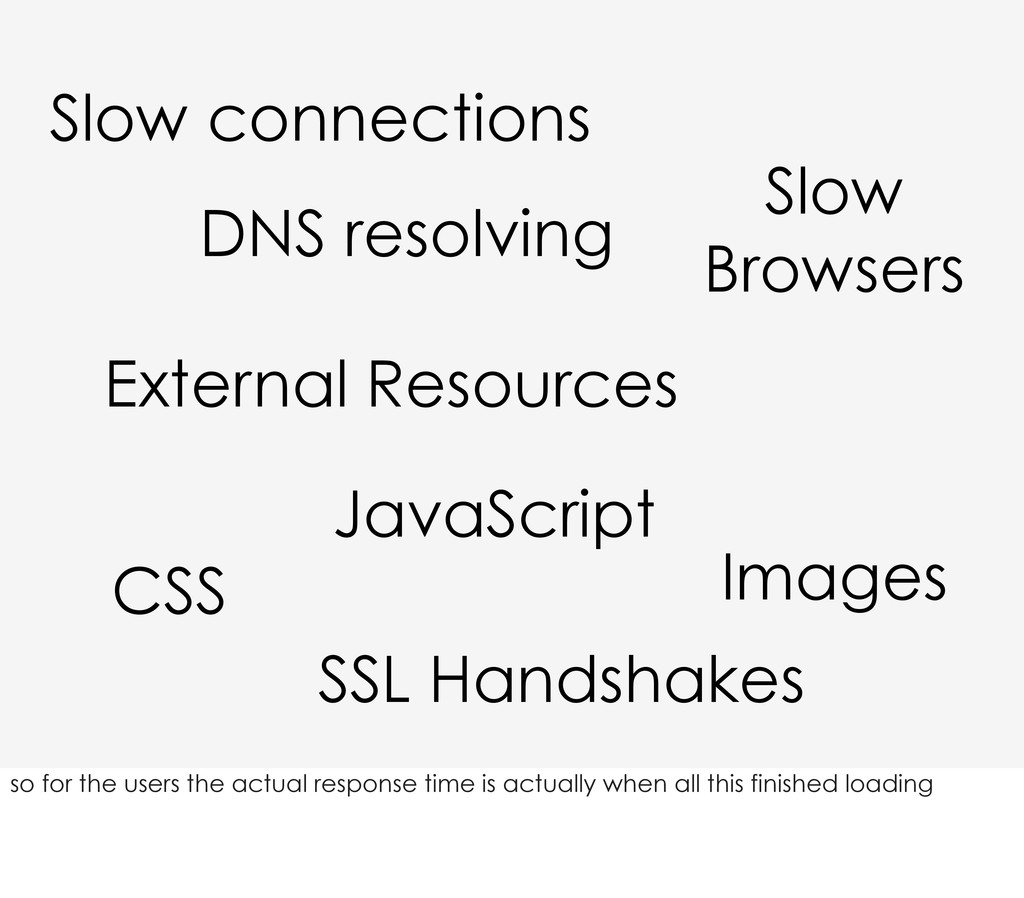
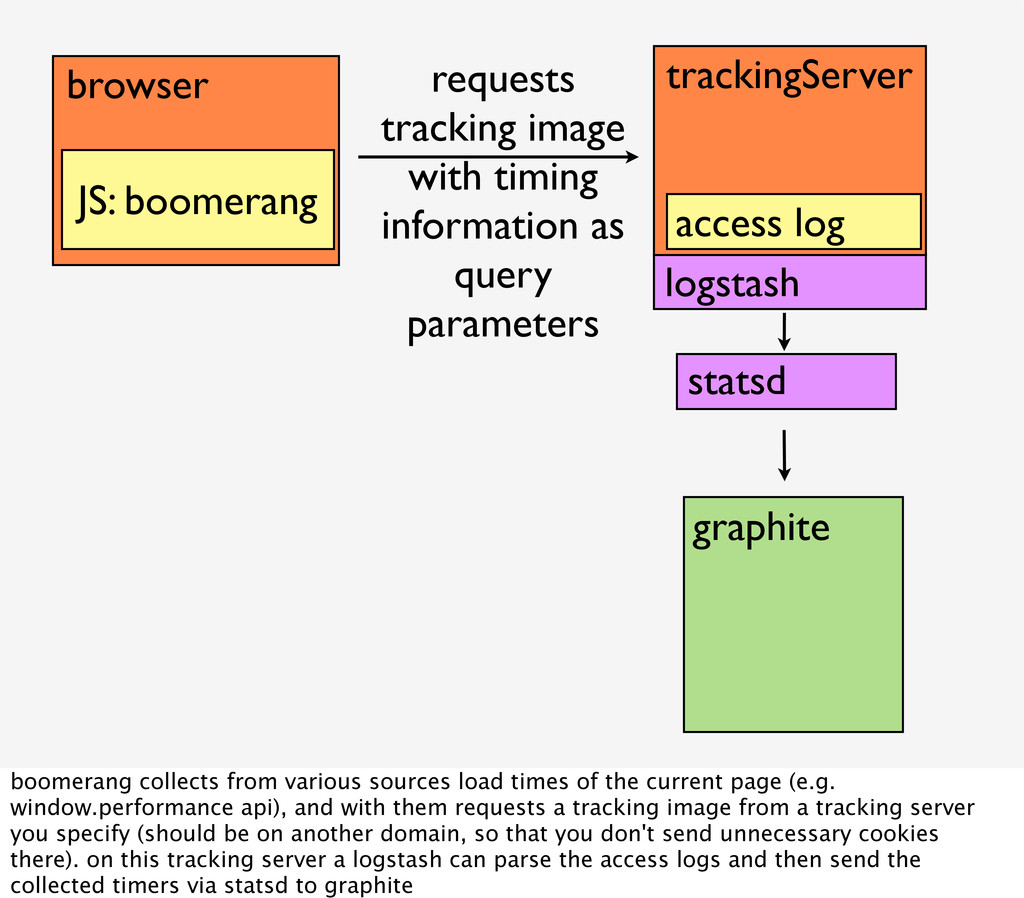
with timing information as query parameters graphite statsd boomerang collects from various sources load times of the current page (e.g. window.performance api), and with them requests a tracking image from a tracking server you specify (should be on another domain, so that you don't send unnecessary cookies there). on this tracking server a logstash can parse the access logs and then send the collected timers via statsd to graphite
![192.168.56.1 - - [09/Jul/2012:19:18:19 +0200] "GET /rg_trunk/webroot/c/af10c/ images/template/rg_logo_default.png HTTP/ 1.1"](https://files.speakerdeck.com/presentations/58b0a750b7f10130a14a7e8eb314bbb5/slide_30.jpg)
![192.168.56.1 - - [09/Jul/2012:19:18:19 +0200] "GET /rg_trunk/webroot/c/af10c/ images/template/rg_logo_default.png HTTP/ 1.1"](https://files.speakerdeck.com/presentations/58b0a750b7f10130a14a7e8eb314bbb5/slide_101.jpg)
![http://twitter.com/BastianHofmann http://profiles.google.com/bashofmann http://lanyrd.com/people/BastianHofmann http://speakerdeck.com/u/bastianhofmann https://github.com/bashofmann https://www.researchgate.net/profile/Bastian_Hofmann/ [email protected] thanks, you can](https://files.speakerdeck.com/presentations/58b0a750b7f10130a14a7e8eb314bbb5/slide_107.jpg)