Upgrade to Pro — share decks privately, control downloads, hide ads and more …

Device Modeling Report: SPICE Model for LTspice...

Device Modeling Report: SPICE Model for LTspice – AK60-39 V3.0 KV80

This document is a device modeling report by Bee Technologies Inc. detailing the SPICE model (for LTspice) for the CubeMars AK60-39 V3.0 KV80 robotic actuator (PMSM + 39:1 planetary gearbox). The report covers the equivalent circuit model, extracted model parameters, and comparison results between SPICE simulations (verified with ngspice-42) and manufacturer specifications or digitized characteristic graph data at 48 VDC. Key updates in Revision 1.1 include fitting speed and DC input current curves, integrating an equivalent FOC driver circuit (FOC_DRV), and implementing saturable inductance and flux linkage.

Avatar for Tsuyoshi Horigome

Tsuyoshi Horigome

November 11, 2026

More Decks by Tsuyoshi Horigome

Other Decks in Technology

Transcript

  1. Device Modeling Report SPICE Model for LTspice AK60-39 V3.0 KV80

    Device type: Robotic actuator (PMSM + 39:1 planetary gearbox) Manufacturer: CubeMars Model type: 3-phase PMSM behavioral model + FOC driver equivalent Simulator: LTspice (functionally verified with ngspice-42) Revision: Rev.1.1 Date: September 25, 2026 Bee Technologies Inc.
  2. Device Modeling Report AK60-39 V3.0 KV80 Contents 1. Overview 2.

    Manufacturer Specifications and Characteristic Graph 3. Equivalent Circuit Model 4. Model Parameters 5. Simulation Results 5.1 Comparison with the Characteristic Graph 5.2 No-Load Speed 5.3 Rated and Peak Points 5.4 Mechanical Time Constant 5.5 Back-Drive Torque 6. Comparison Summary 7. Notes and Limitations 8. Deliverables 9. Revision History Bee Technologies Inc. 1
  3. Device Modeling Report AK60-39 V3.0 KV80 1. Overview This report

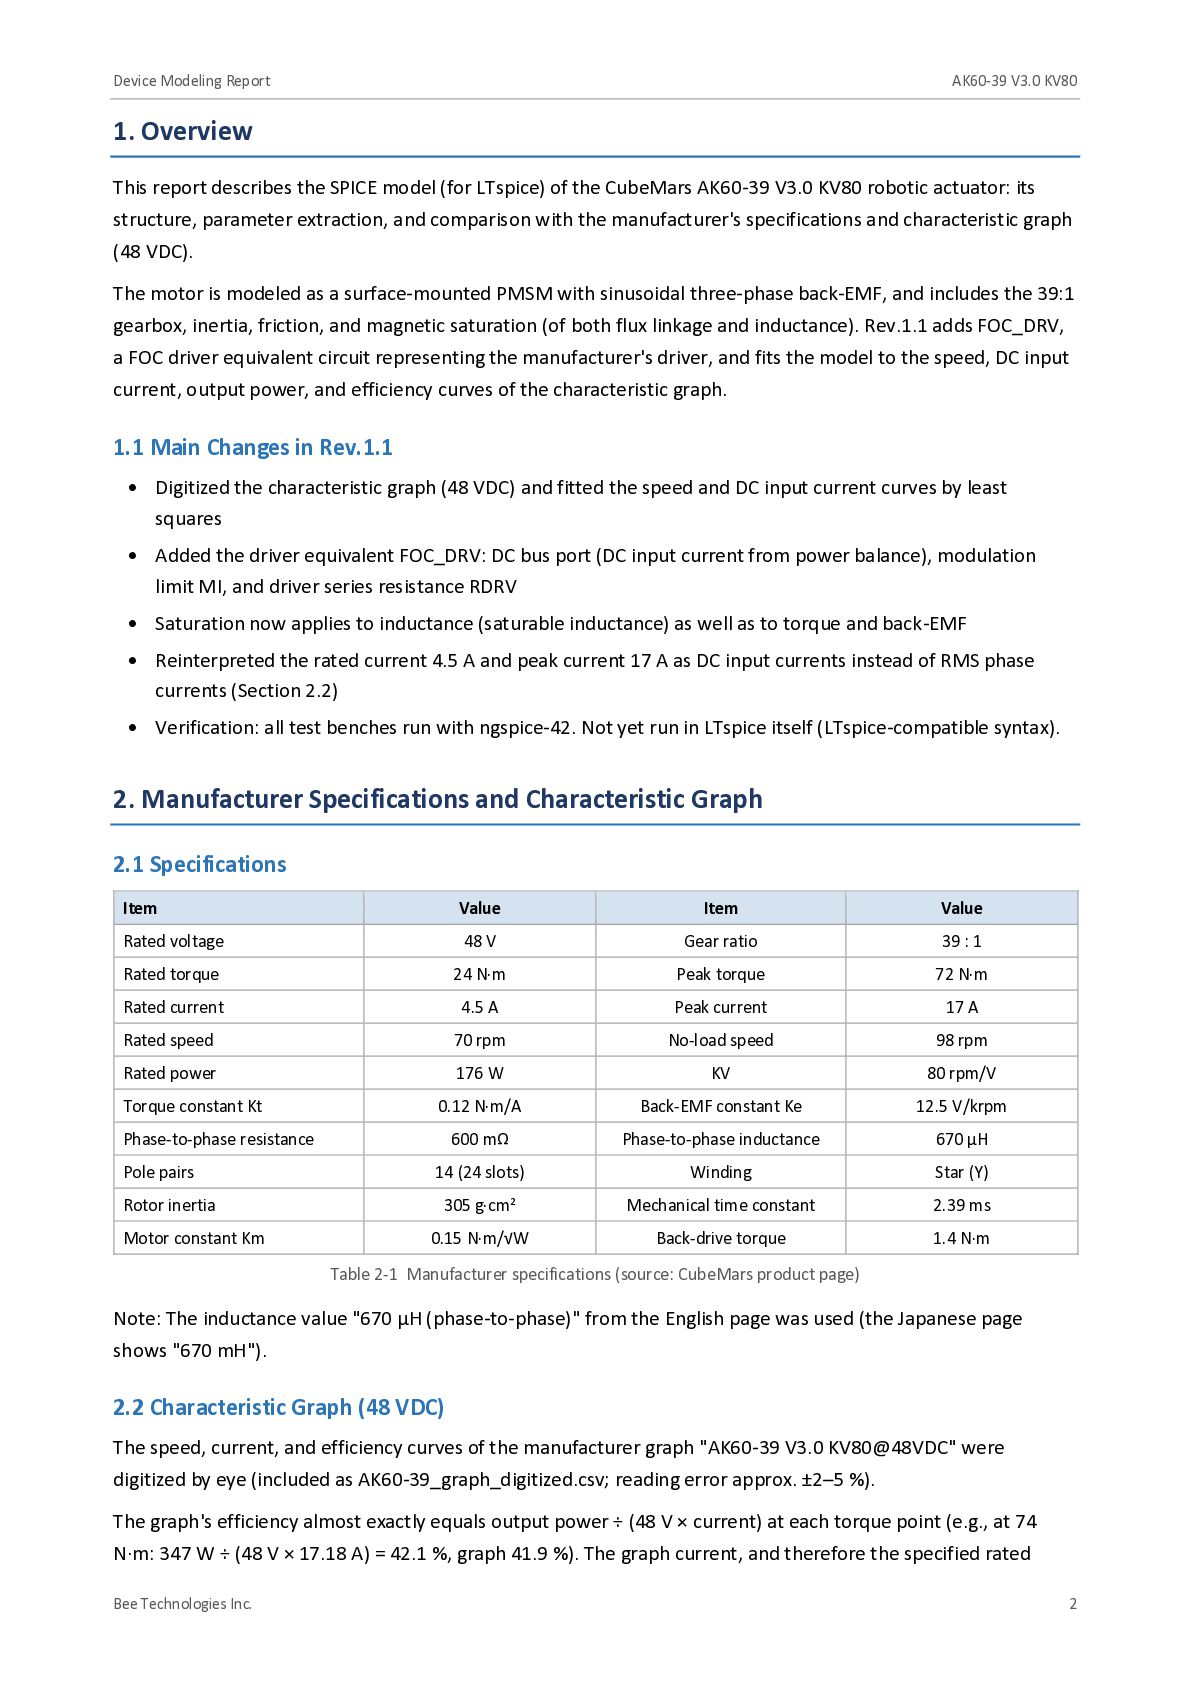
    describes the SPICE model (for LTspice) of the CubeMars AK60-39 V3.0 KV80 robotic actuator: its structure, parameter extraction, and comparison with the manufacturer's specifications and characteristic graph (48 VDC). The motor is modeled as a surface-mounted PMSM with sinusoidal three-phase back-EMF, and includes the 39:1 gearbox, inertia, friction, and magnetic saturation (of both flux linkage and inductance). Rev.1.1 adds FOC_DRV, a FOC driver equivalent circuit representing the manufacturer's driver, and fits the model to the speed, DC input current, output power, and efficiency curves of the characteristic graph. 1.1 Main Changes in Rev.1.1 • Digitized the characteristic graph (48 VDC) and fitted the speed and DC input current curves by least squares • Added the driver equivalent FOC_DRV: DC bus port (DC input current from power balance), modulation limit MI, and driver series resistance RDRV • Saturation now applies to inductance (saturable inductance) as well as to torque and back-EMF • Reinterpreted the rated current 4.5 A and peak current 17 A as DC input currents instead of RMS phase currents (Section 2.2) • Verification: all test benches run with ngspice-42. Not yet run in LTspice itself (LTspice-compatible syntax). 2. Manufacturer Specifications and Characteristic Graph 2.1 Specifications Item Value Item Value Rated voltage 48 V Gear ratio 39 : 1 Rated torque 24 N·m Peak torque 72 N·m Rated current 4.5 A Peak current 17 A Rated speed 70 rpm No-load speed 98 rpm Rated power 176 W KV 80 rpm/V 0.12 N·m/A Back-EMF constant Ke 12.5 V/krpm 600 mΩ Phase-to-phase inductance 670 µH Pole pairs 14 (24 slots) Winding Star (Y) Rotor inertia 305 g·cm² Mechanical time constant 2.39 ms 0.15 N·m/√W Back-drive torque 1.4 N·m Torque constant Kt Phase-to-phase resistance Motor constant Km Table 2-1 Manufacturer specifications (source: CubeMars product page) Note: The inductance value "670 µH (phase-to-phase)" from the English page was used (the Japanese page shows "670 mH"). 2.2 Characteristic Graph (48 VDC) The speed, current, and efficiency curves of the manufacturer graph "AK60-39 V3.0 KV80@48VDC" were digitized by eye (included as AK60-39_graph_digitized.csv; reading error approx. ±2–5 %). The graph's efficiency almost exactly equals output power ÷ (48 V × current) at each torque point (e.g., at 74 N·m: 347 W ÷ (48 V × 17.18 A) = 42.1 %, graph 41.9 %). The graph current, and therefore the specified rated Bee Technologies Inc. 2
  4. Device Modeling Report AK60-39 V3.0 KV80 current 4.5 A and

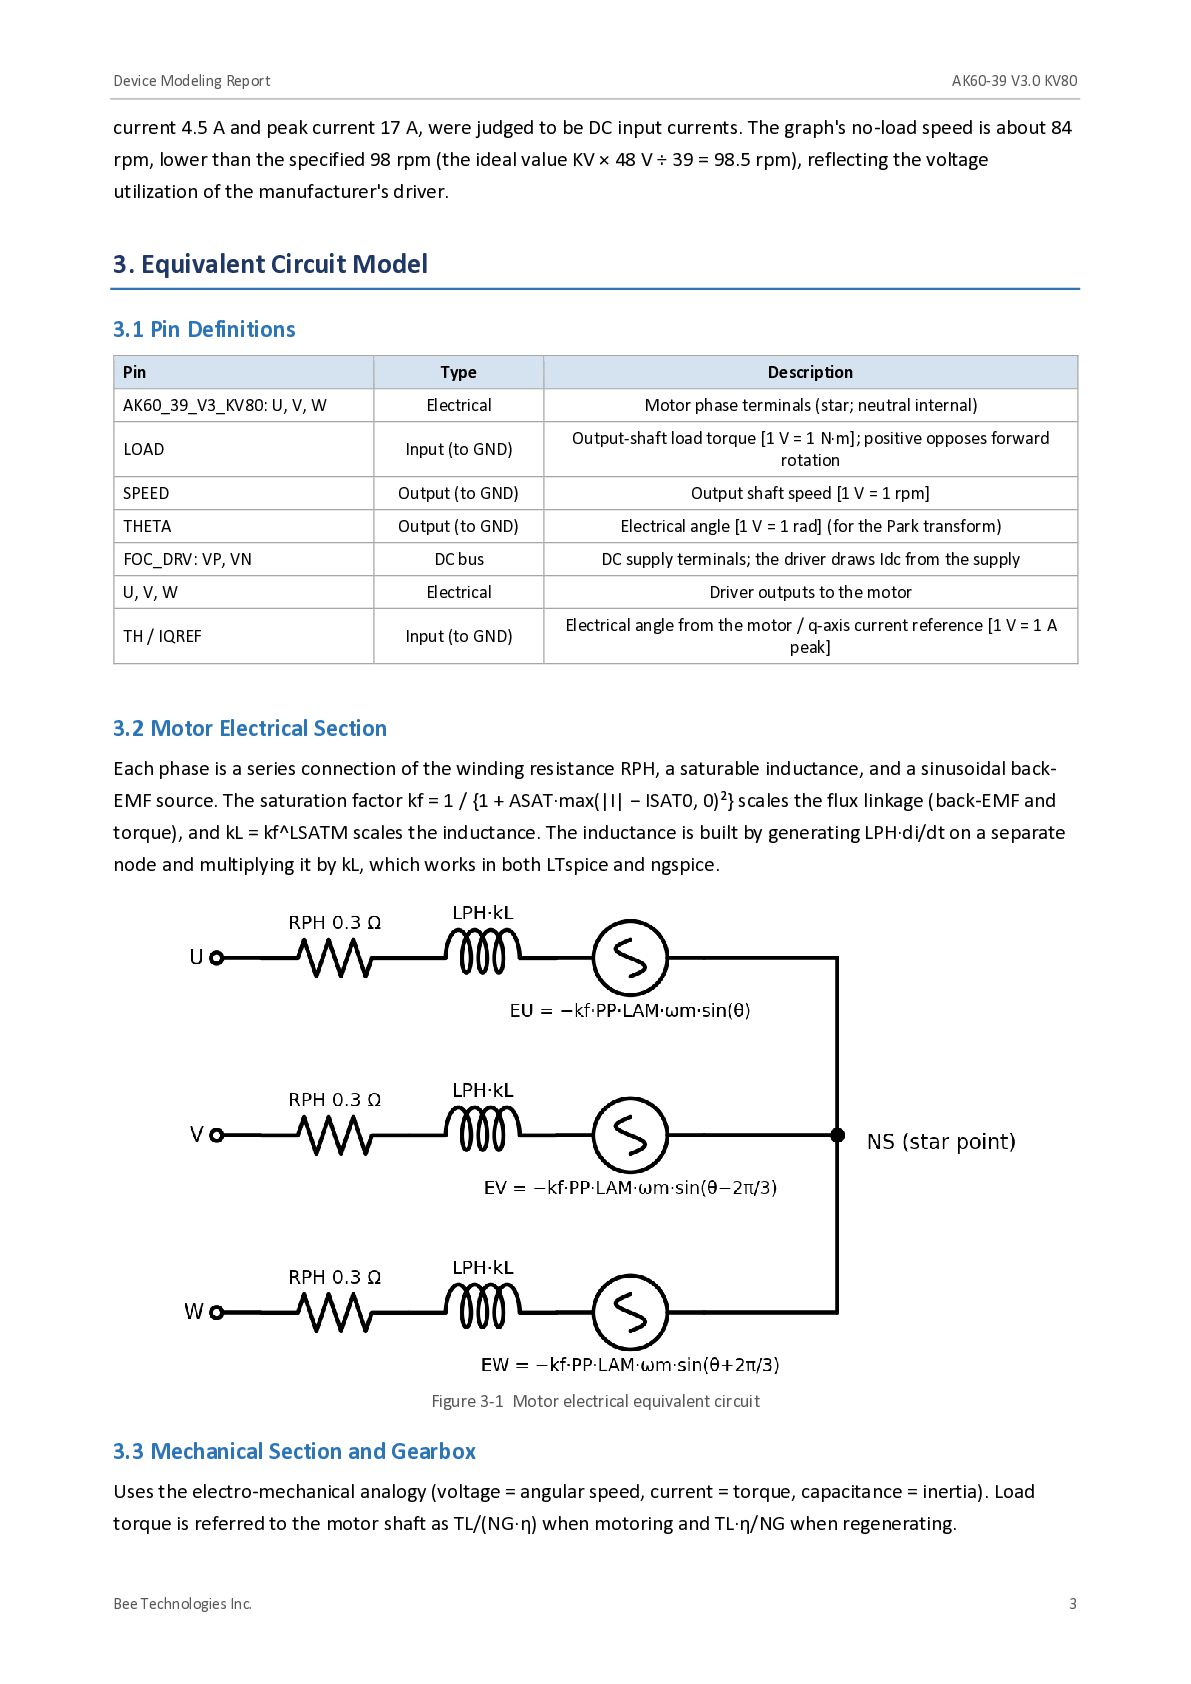
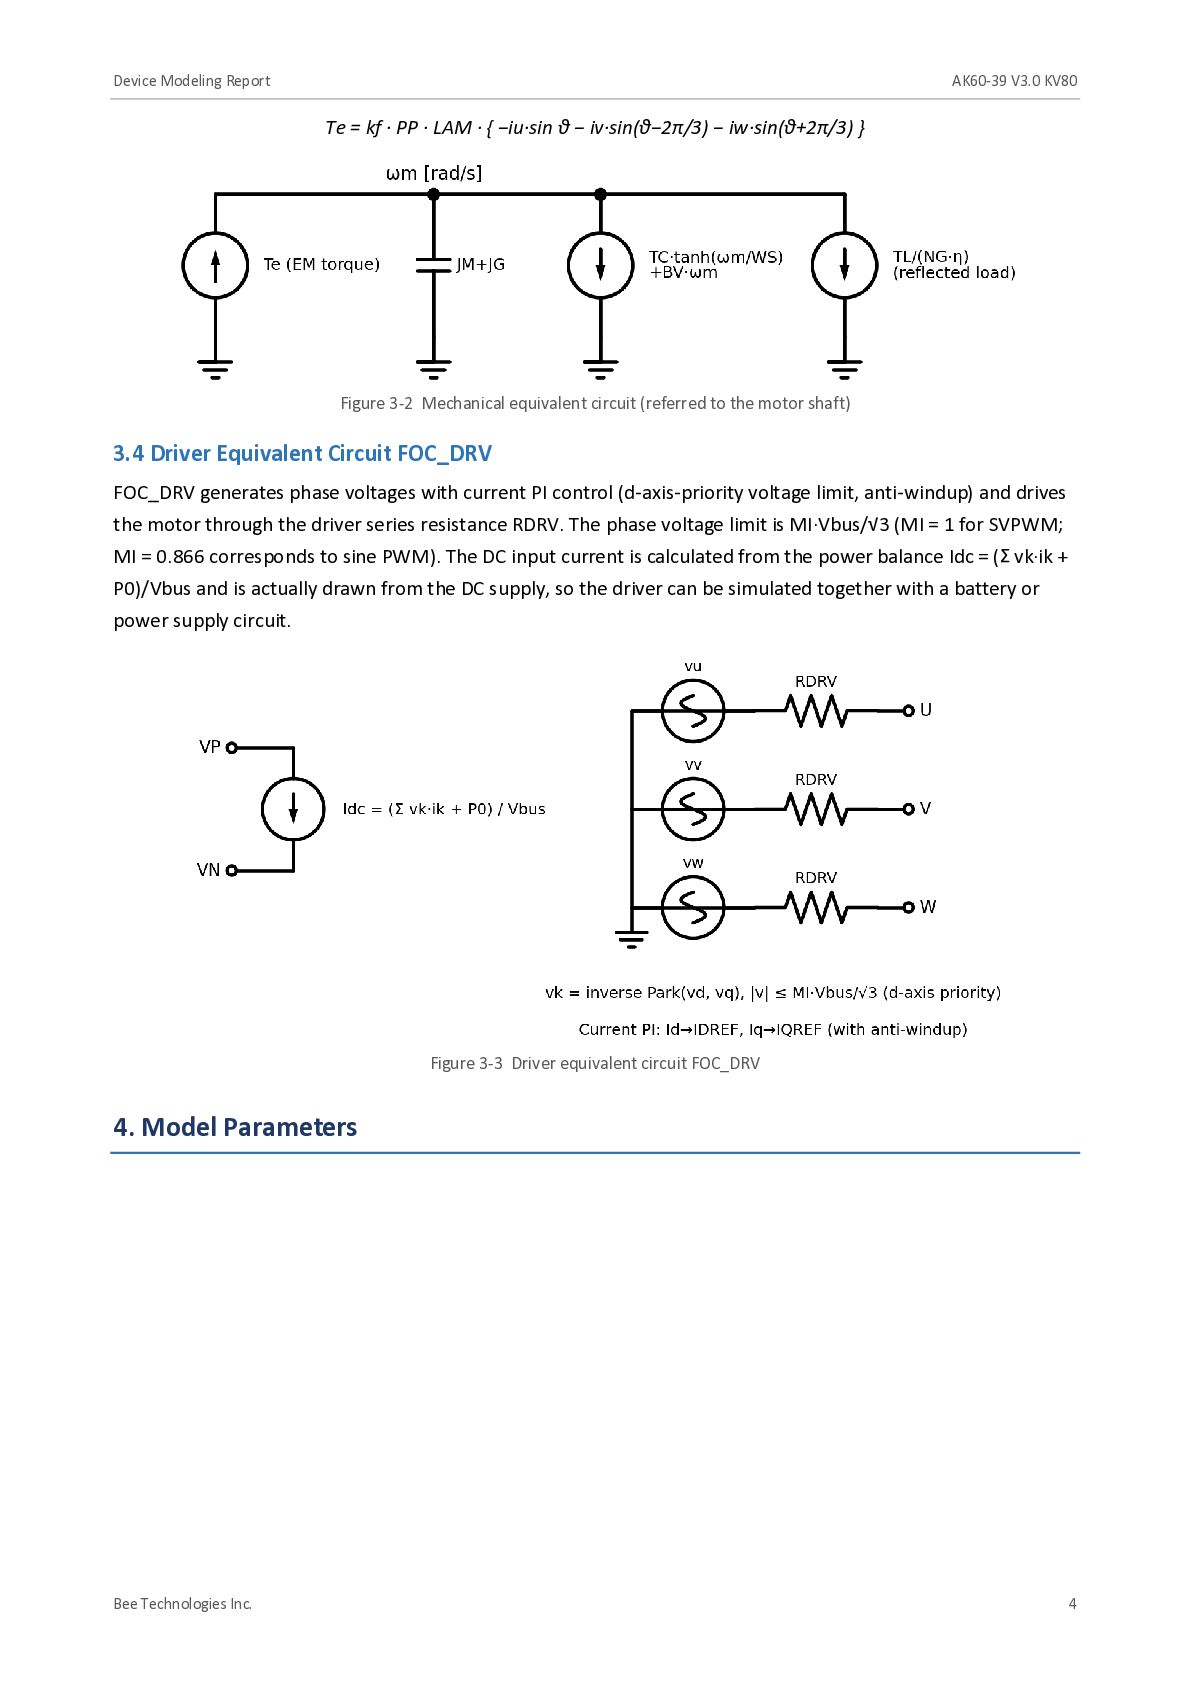
    peak current 17 A, were judged to be DC input currents. The graph's no-load speed is about 84 rpm, lower than the specified 98 rpm (the ideal value KV × 48 V ÷ 39 = 98.5 rpm), reflecting the voltage utilization of the manufacturer's driver. 3. Equivalent Circuit Model 3.1 Pin Definitions Pin Type Description Electrical Motor phase terminals (star; neutral internal) LOAD Input (to GND) Output-shaft load torque [1 V = 1 N·m]; positive opposes forward rotation SPEED Output (to GND) Output shaft speed [1 V = 1 rpm] THETA Output (to GND) Electrical angle [1 V = 1 rad] (for the Park transform) FOC_DRV: VP, VN DC bus DC supply terminals; the driver draws Idc from the supply U, V, W Electrical Driver outputs to the motor TH / IQREF Input (to GND) Electrical angle from the motor / q-axis current reference [1 V = 1 A peak] AK60_39_V3_KV80: U, V, W 3.2 Motor Electrical Section Each phase is a series connection of the winding resistance RPH, a saturable inductance, and a sinusoidal backEMF source. The saturation factor kf = 1 / {1 + ASAT·max(|I| − ISAT0, 0)²} scales the flux linkage (back-EMF and torque), and kL = kf^LSATM scales the inductance. The inductance is built by generating LPH·di/dt on a separate node and multiplying it by kL, which works in both LTspice and ngspice. Figure 3-1 Motor electrical equivalent circuit 3.3 Mechanical Section and Gearbox Uses the electro-mechanical analogy (voltage = angular speed, current = torque, capacitance = inertia). Load torque is referred to the motor shaft as TL/(NG·η) when motoring and TL·η/NG when regenerating. Bee Technologies Inc. 3
  5. Device Modeling Report AK60-39 V3.0 KV80 Te = kf ·

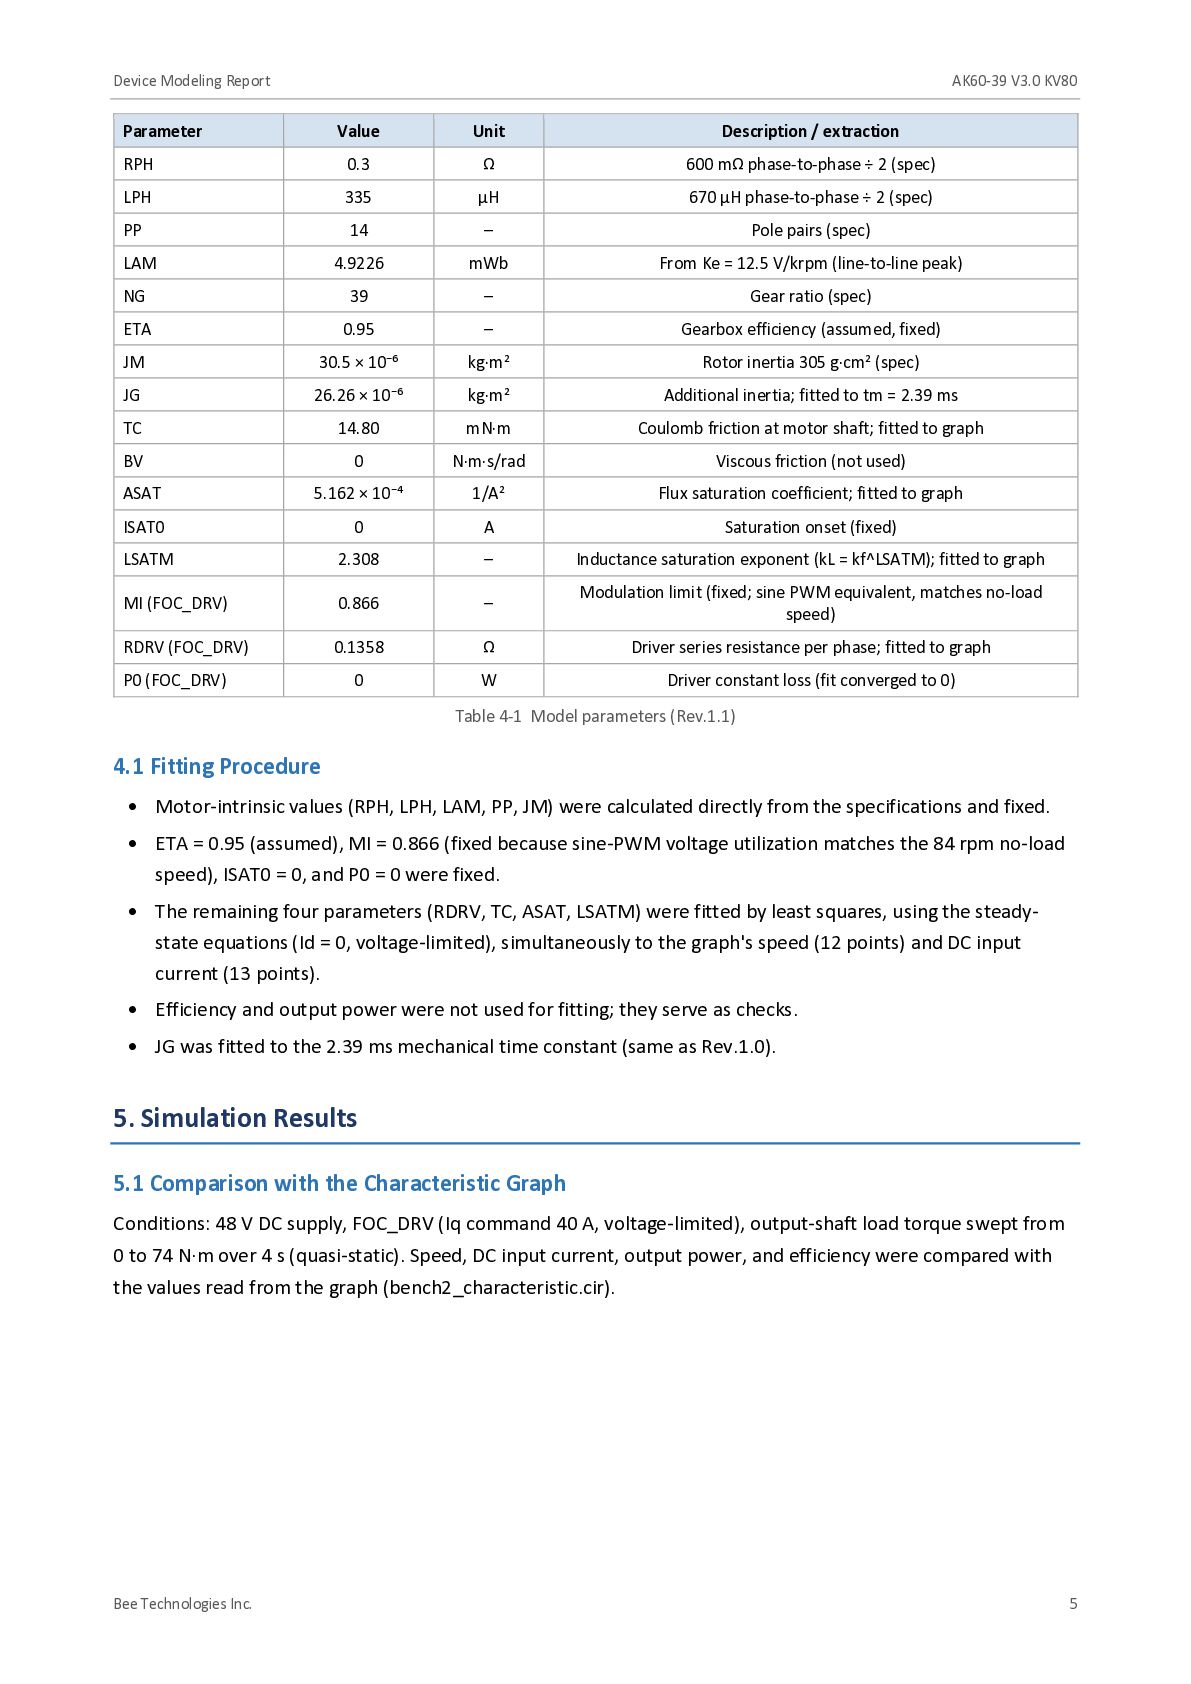
    PP · LAM · { −iu·sin θ − iv·sin(θ−2π/3) − iw·sin(θ+2π/3) } Figure 3-2 Mechanical equivalent circuit (referred to the motor shaft) 3.4 Driver Equivalent Circuit FOC_DRV FOC_DRV generates phase voltages with current PI control (d-axis-priority voltage limit, anti-windup) and drives the motor through the driver series resistance RDRV. The phase voltage limit is MI·Vbus/√3 (MI = 1 for SVPWM; MI = 0.866 corresponds to sine PWM). The DC input current is calculated from the power balance Idc = (Σ vk·ik + P0)/Vbus and is actually drawn from the DC supply, so the driver can be simulated together with a battery or power supply circuit. Figure 3-3 Driver equivalent circuit FOC_DRV 4. Model Parameters Bee Technologies Inc. 4
  6. Device Modeling Report AK60-39 V3.0 KV80 Parameter Value Unit Description

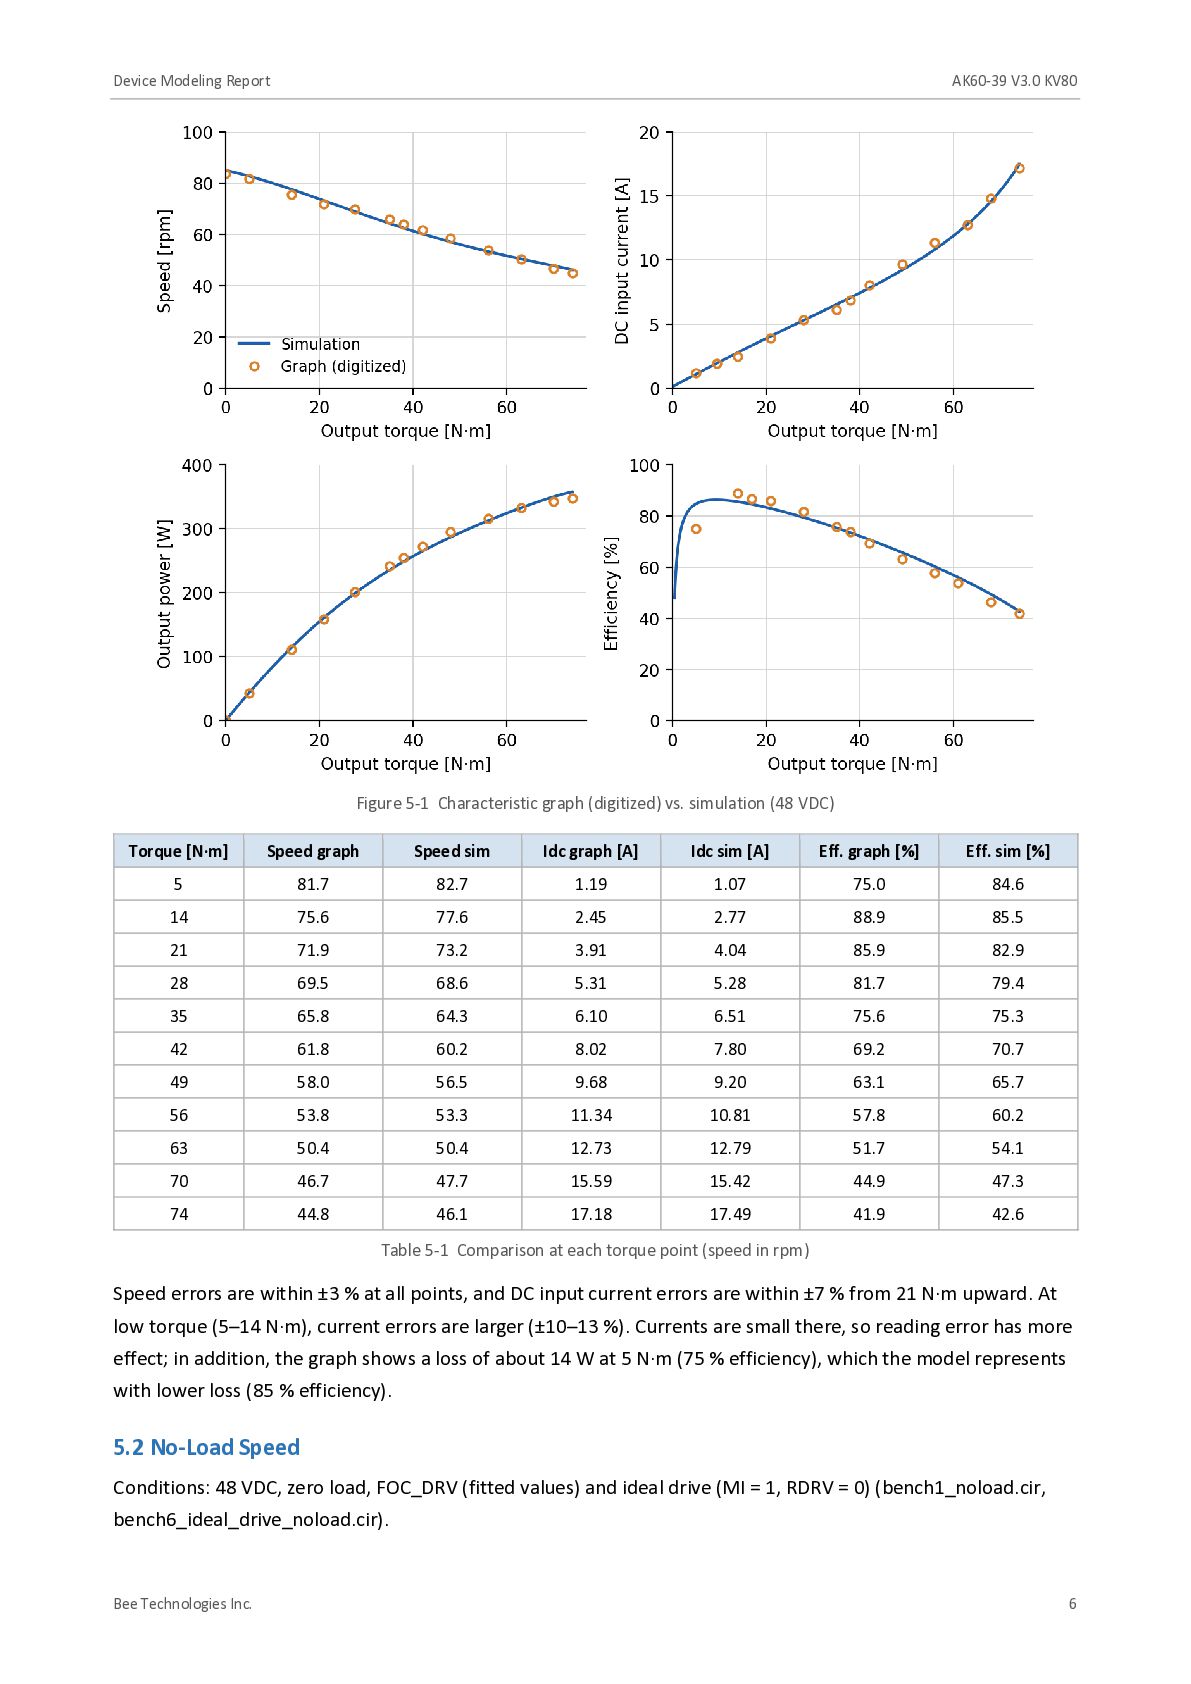
    / extraction RPH 0.3 Ω 600 mΩ phase-to-phase ÷ 2 (spec) LPH 335 µH 670 µH phase-to-phase ÷ 2 (spec) PP 14 – Pole pairs (spec) LAM 4.9226 mWb From Ke = 12.5 V/krpm (line-to-line peak) NG 39 – Gear ratio (spec) ETA 0.95 – Gearbox efficiency (assumed, fixed) JM 30.5 × 10⁻⁶ kg·m² Rotor inertia 305 g·cm² (spec) JG 26.26 × 10⁻⁶ kg·m² Additional inertia; fitted to tm = 2.39 ms TC 14.80 mN·m Coulomb friction at motor shaft; fitted to graph BV 0 N·m·s/rad Viscous friction (not used) ASAT 5.162 × 10⁻⁴ 1/A² Flux saturation coefficient; fitted to graph ISAT0 0 A Saturation onset (fixed) LSATM 2.308 – Inductance saturation exponent (kL = kf^LSATM); fitted to graph MI (FOC_DRV) 0.866 – Modulation limit (fixed; sine PWM equivalent, matches no-load speed) RDRV (FOC_DRV) 0.1358 Ω Driver series resistance per phase; fitted to graph P0 (FOC_DRV) 0 W Driver constant loss (fit converged to 0) Table 4-1 Model parameters (Rev.1.1) 4.1 Fitting Procedure • Motor-intrinsic values (RPH, LPH, LAM, PP, JM) were calculated directly from the specifications and fixed. • ETA = 0.95 (assumed), MI = 0.866 (fixed because sine-PWM voltage utilization matches the 84 rpm no-load speed), ISAT0 = 0, and P0 = 0 were fixed. • The remaining four parameters (RDRV, TC, ASAT, LSATM) were fitted by least squares, using the steadystate equations (Id = 0, voltage-limited), simultaneously to the graph's speed (12 points) and DC input current (13 points). • Efficiency and output power were not used for fitting; they serve as checks. • JG was fitted to the 2.39 ms mechanical time constant (same as Rev.1.0). 5. Simulation Results 5.1 Comparison with the Characteristic Graph Conditions: 48 V DC supply, FOC_DRV (Iq command 40 A, voltage-limited), output-shaft load torque swept from 0 to 74 N·m over 4 s (quasi-static). Speed, DC input current, output power, and efficiency were compared with the values read from the graph (bench2_characteristic.cir). Bee Technologies Inc. 5
  7. Device Modeling Report AK60-39 V3.0 KV80 Figure 5-1 Characteristic graph

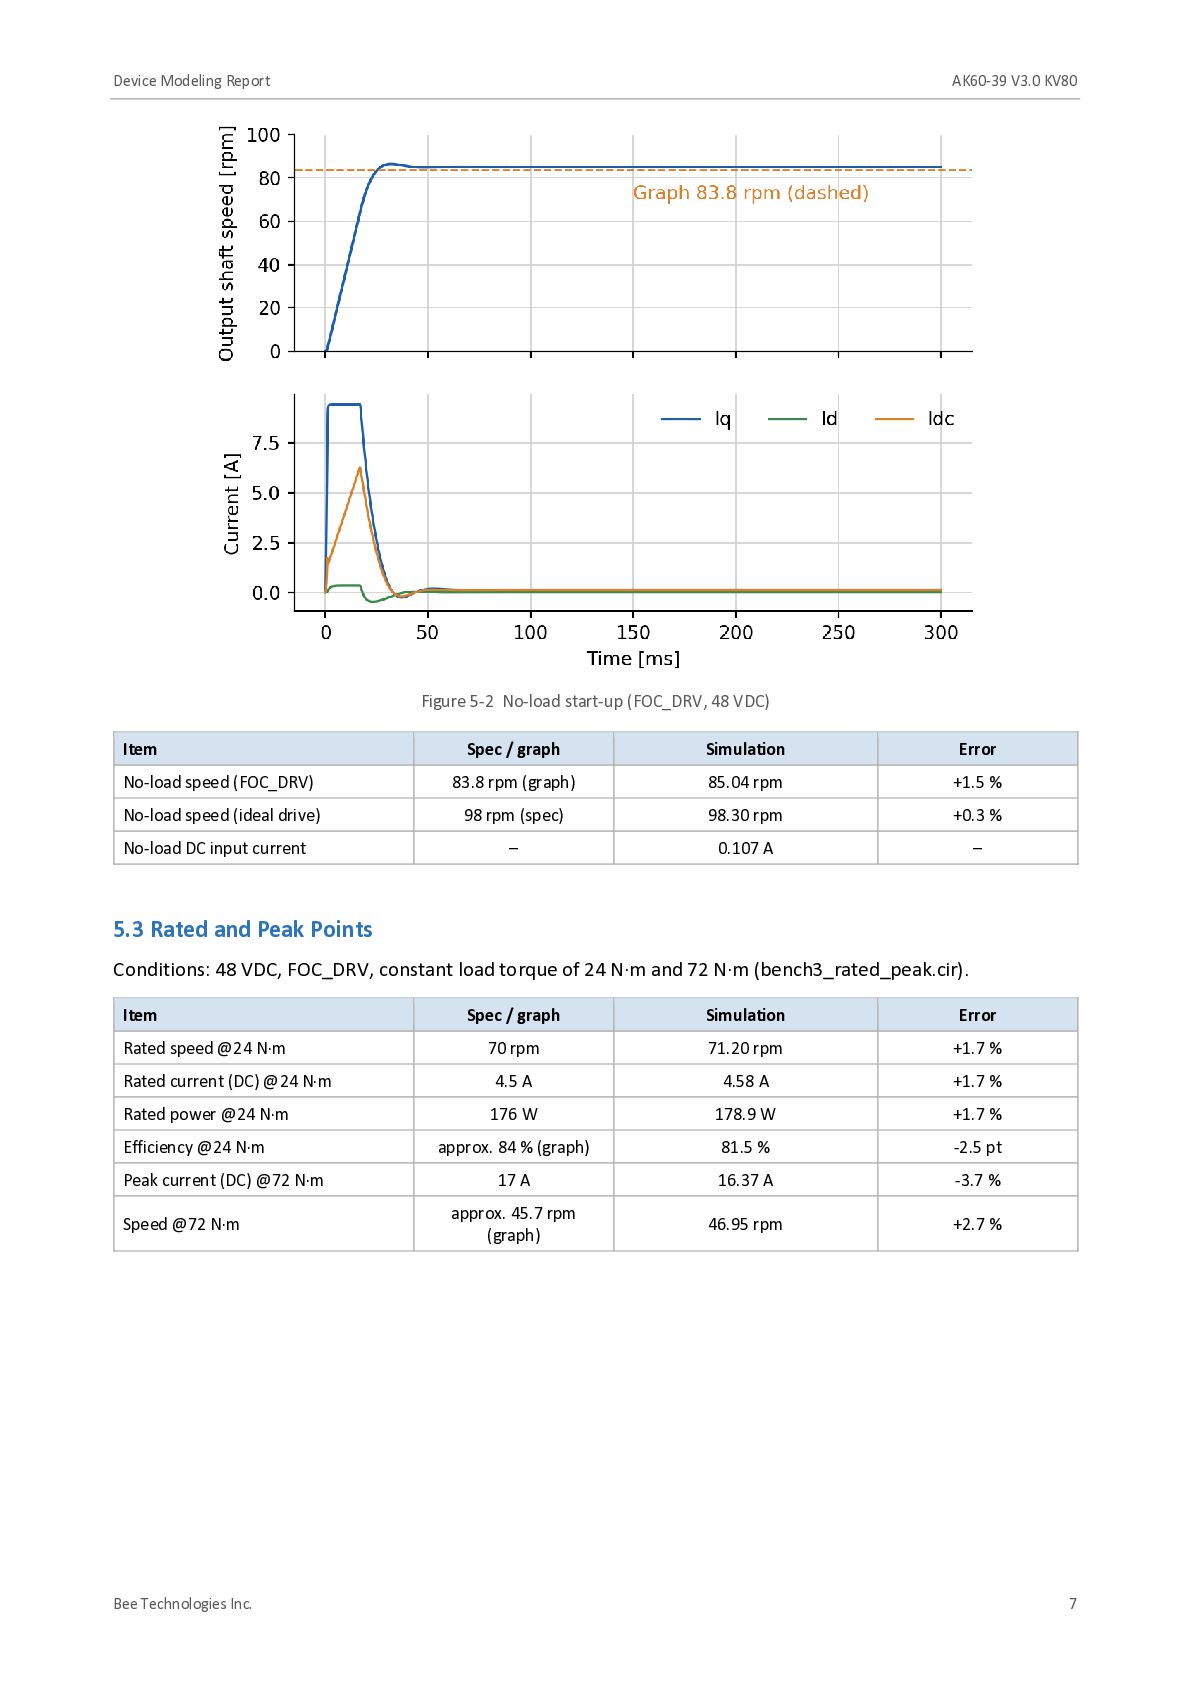
    (digitized) vs. simulation (48 VDC) Torque [N·m] Speed graph Speed sim Idc graph [A] Idc sim [A] Eff. graph [%] Eff. sim [%] 5 81.7 82.7 1.19 1.07 75.0 84.6 14 75.6 77.6 2.45 2.77 88.9 85.5 21 71.9 73.2 3.91 4.04 85.9 82.9 28 69.5 68.6 5.31 5.28 81.7 79.4 35 65.8 64.3 6.10 6.51 75.6 75.3 42 61.8 60.2 8.02 7.80 69.2 70.7 49 58.0 56.5 9.68 9.20 63.1 65.7 56 53.8 53.3 11.34 10.81 57.8 60.2 63 50.4 50.4 12.73 12.79 51.7 54.1 70 46.7 47.7 15.59 15.42 44.9 47.3 74 44.8 46.1 17.18 17.49 41.9 42.6 Table 5-1 Comparison at each torque point (speed in rpm) Speed errors are within ±3 % at all points, and DC input current errors are within ±7 % from 21 N·m upward. At low torque (5–14 N·m), current errors are larger (±10–13 %). Currents are small there, so reading error has more effect; in addition, the graph shows a loss of about 14 W at 5 N·m (75 % efficiency), which the model represents with lower loss (85 % efficiency). 5.2 No-Load Speed Conditions: 48 VDC, zero load, FOC_DRV (fitted values) and ideal drive (MI = 1, RDRV = 0) (bench1_noload.cir, bench6_ideal_drive_noload.cir). Bee Technologies Inc. 6
  8. Device Modeling Report AK60-39 V3.0 KV80 Figure 5-2 No-load start-up

    (FOC_DRV, 48 VDC) Item Spec / graph Simulation Error No-load speed (FOC_DRV) 83.8 rpm (graph) 85.04 rpm +1.5 % No-load speed (ideal drive) 98 rpm (spec) 98.30 rpm +0.3 % No-load DC input current – 0.107 A – 5.3 Rated and Peak Points Conditions: 48 VDC, FOC_DRV, constant load torque of 24 N·m and 72 N·m (bench3_rated_peak.cir). Item Spec / graph Simulation Error Rated speed @24 N·m 70 rpm 71.20 rpm +1.7 % Rated current (DC) @24 N·m 4.5 A 4.58 A +1.7 % Rated power @24 N·m 176 W 178.9 W +1.7 % Efficiency @24 N·m approx. 84 % (graph) 81.5 % -2.5 pt 17 A 16.37 A -3.7 % approx. 45.7 rpm (graph) 46.95 rpm +2.7 % Peak current (DC) @72 N·m Speed @72 N·m Bee Technologies Inc. 7
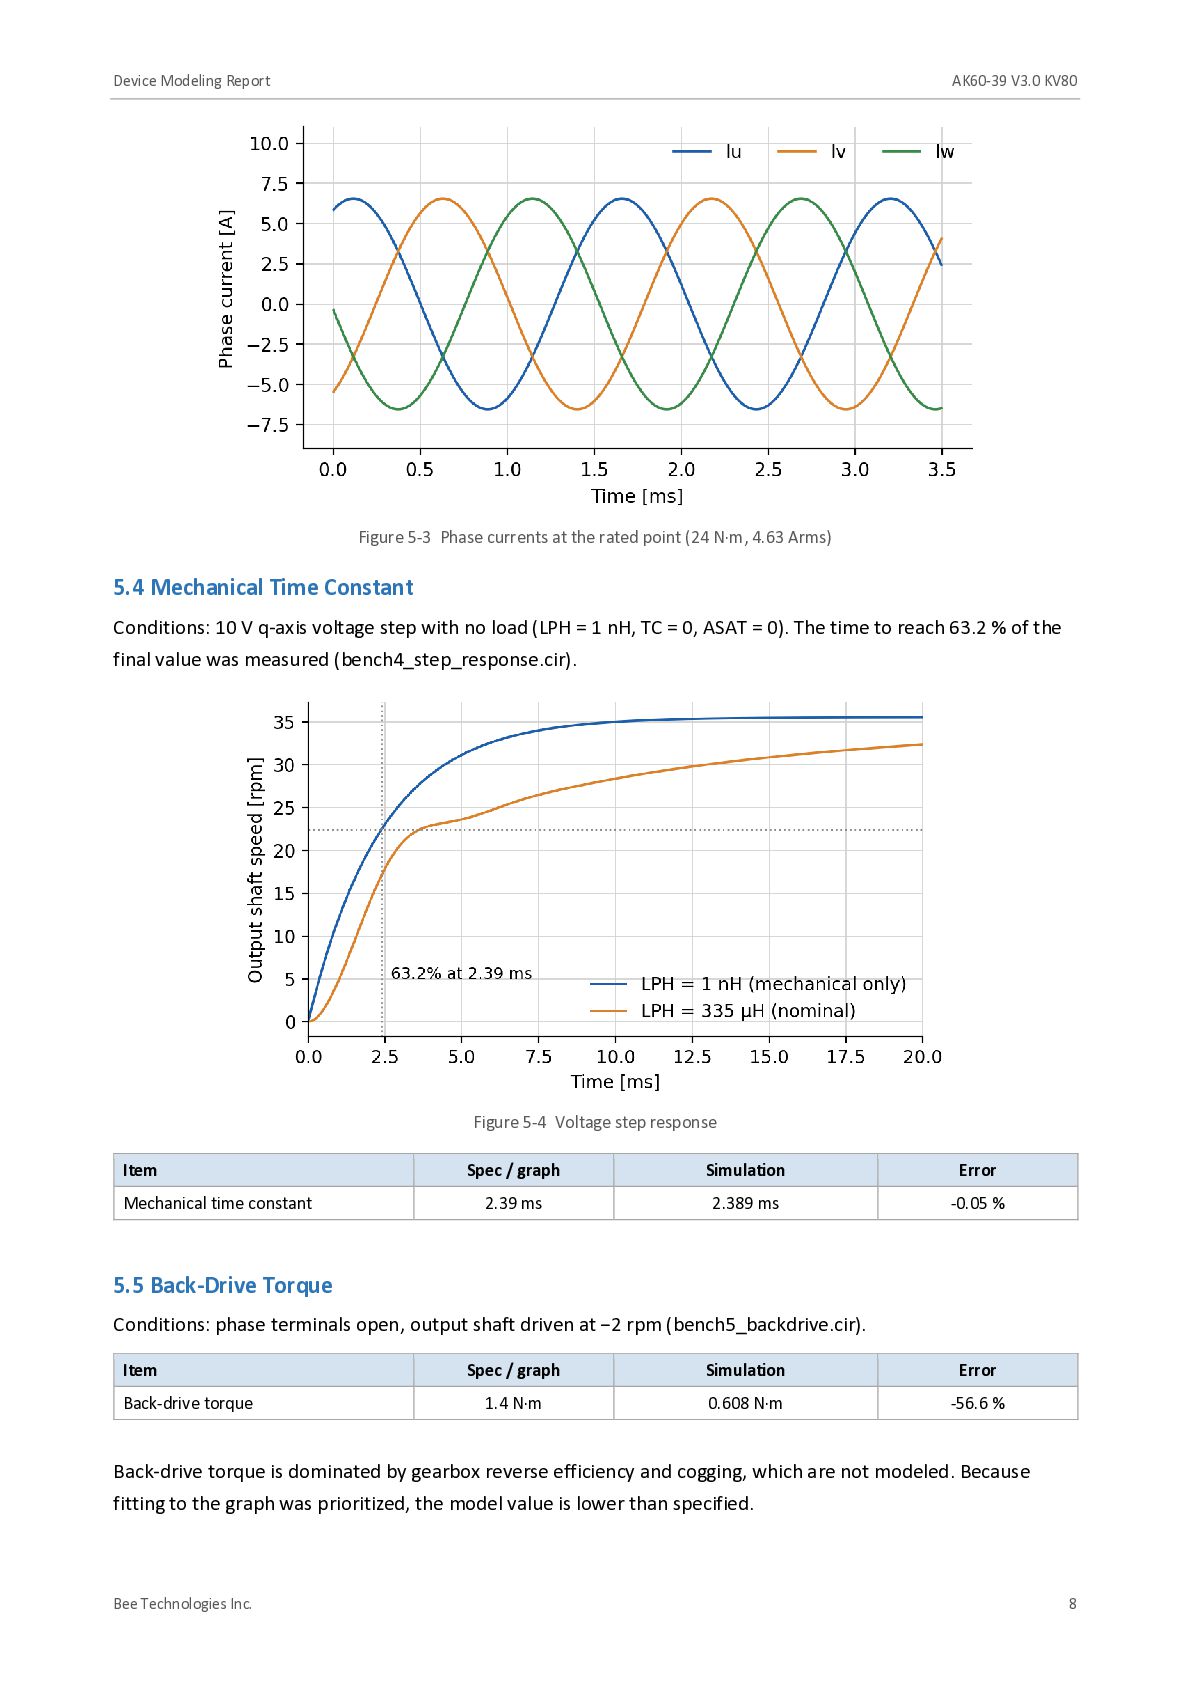
  9. Device Modeling Report AK60-39 V3.0 KV80 Figure 5-3 Phase currents

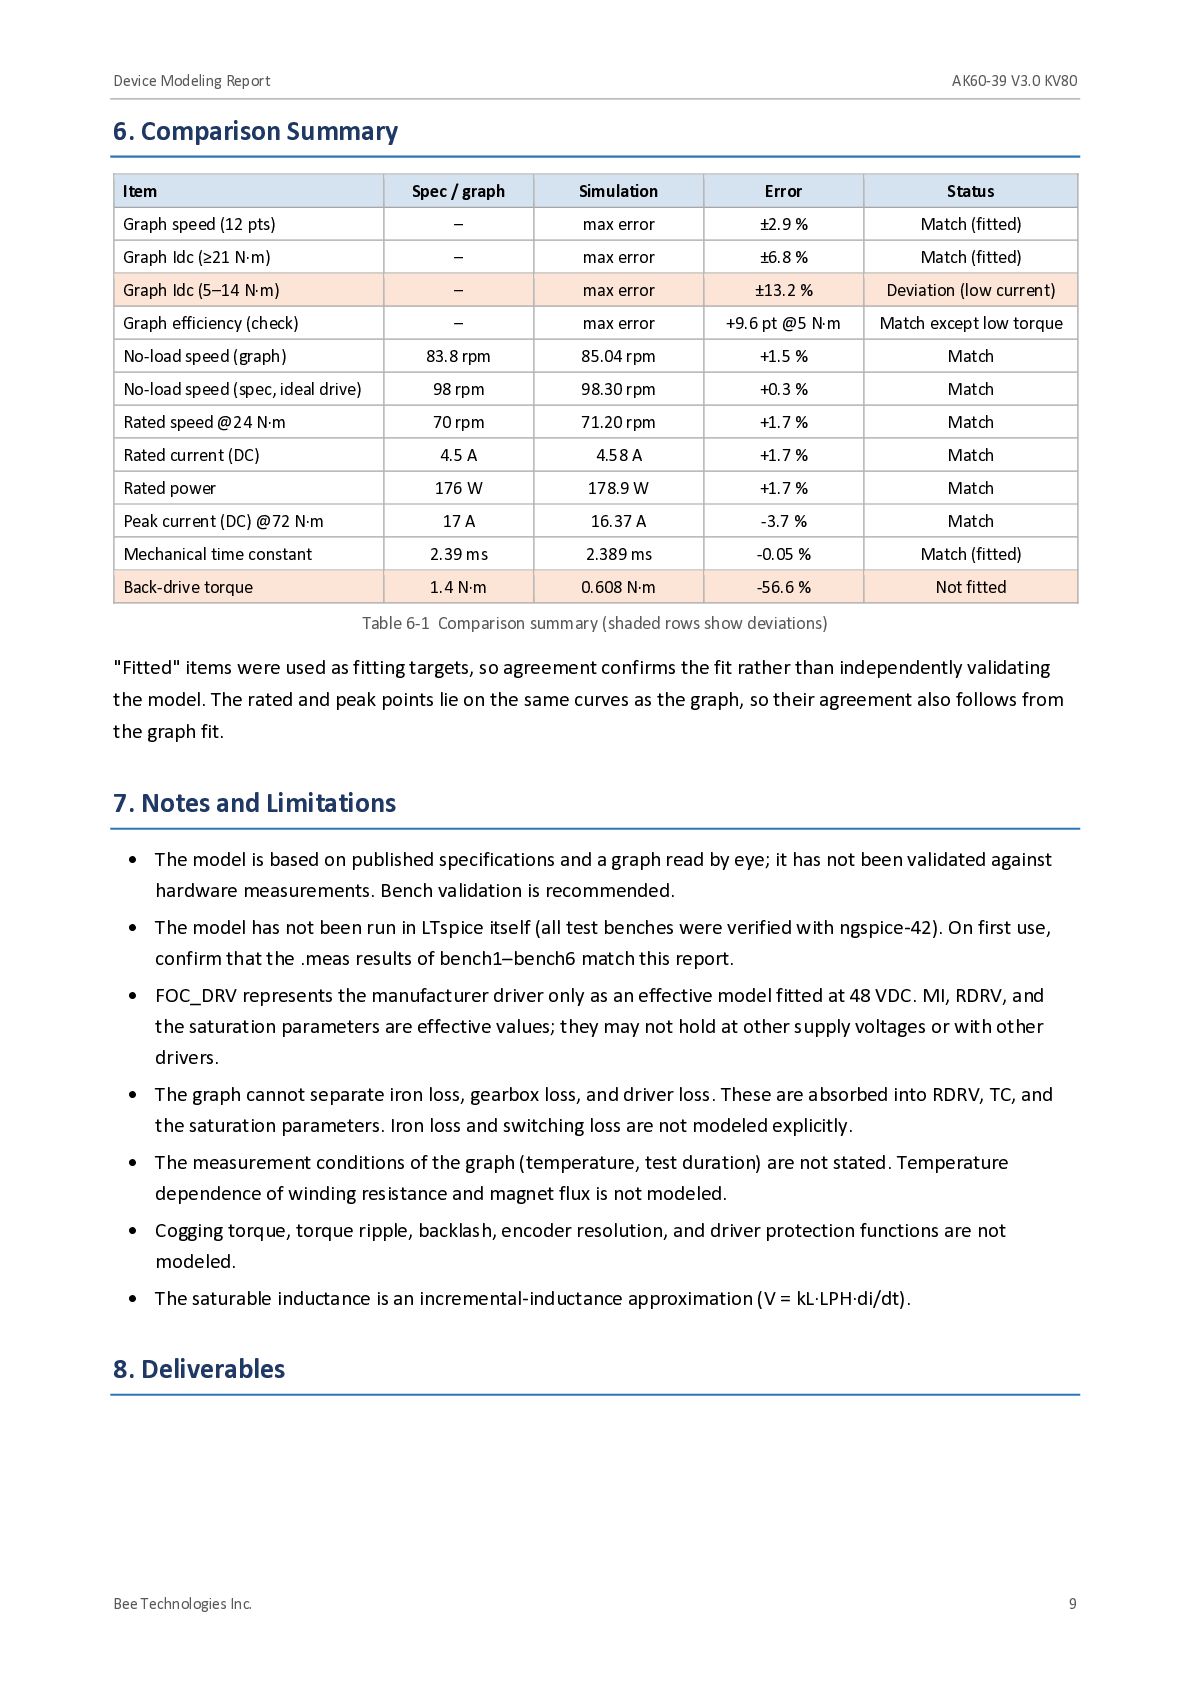
    at the rated point (24 N·m, 4.63 Arms) 5.4 Mechanical Time Constant Conditions: 10 V q-axis voltage step with no load (LPH = 1 nH, TC = 0, ASAT = 0). The time to reach 63.2 % of the final value was measured (bench4_step_response.cir). Figure 5-4 Voltage step response Item Mechanical time constant Spec / graph Simulation Error 2.39 ms 2.389 ms -0.05 % 5.5 Back-Drive Torque Conditions: phase terminals open, output shaft driven at −2 rpm (bench5_backdrive.cir). Item Back-drive torque Spec / graph Simulation Error 1.4 N·m 0.608 N·m -56.6 % Back-drive torque is dominated by gearbox reverse efficiency and cogging, which are not modeled. Because fitting to the graph was prioritized, the model value is lower than specified. Bee Technologies Inc. 8
  10. Device Modeling Report AK60-39 V3.0 KV80 6. Comparison Summary Item

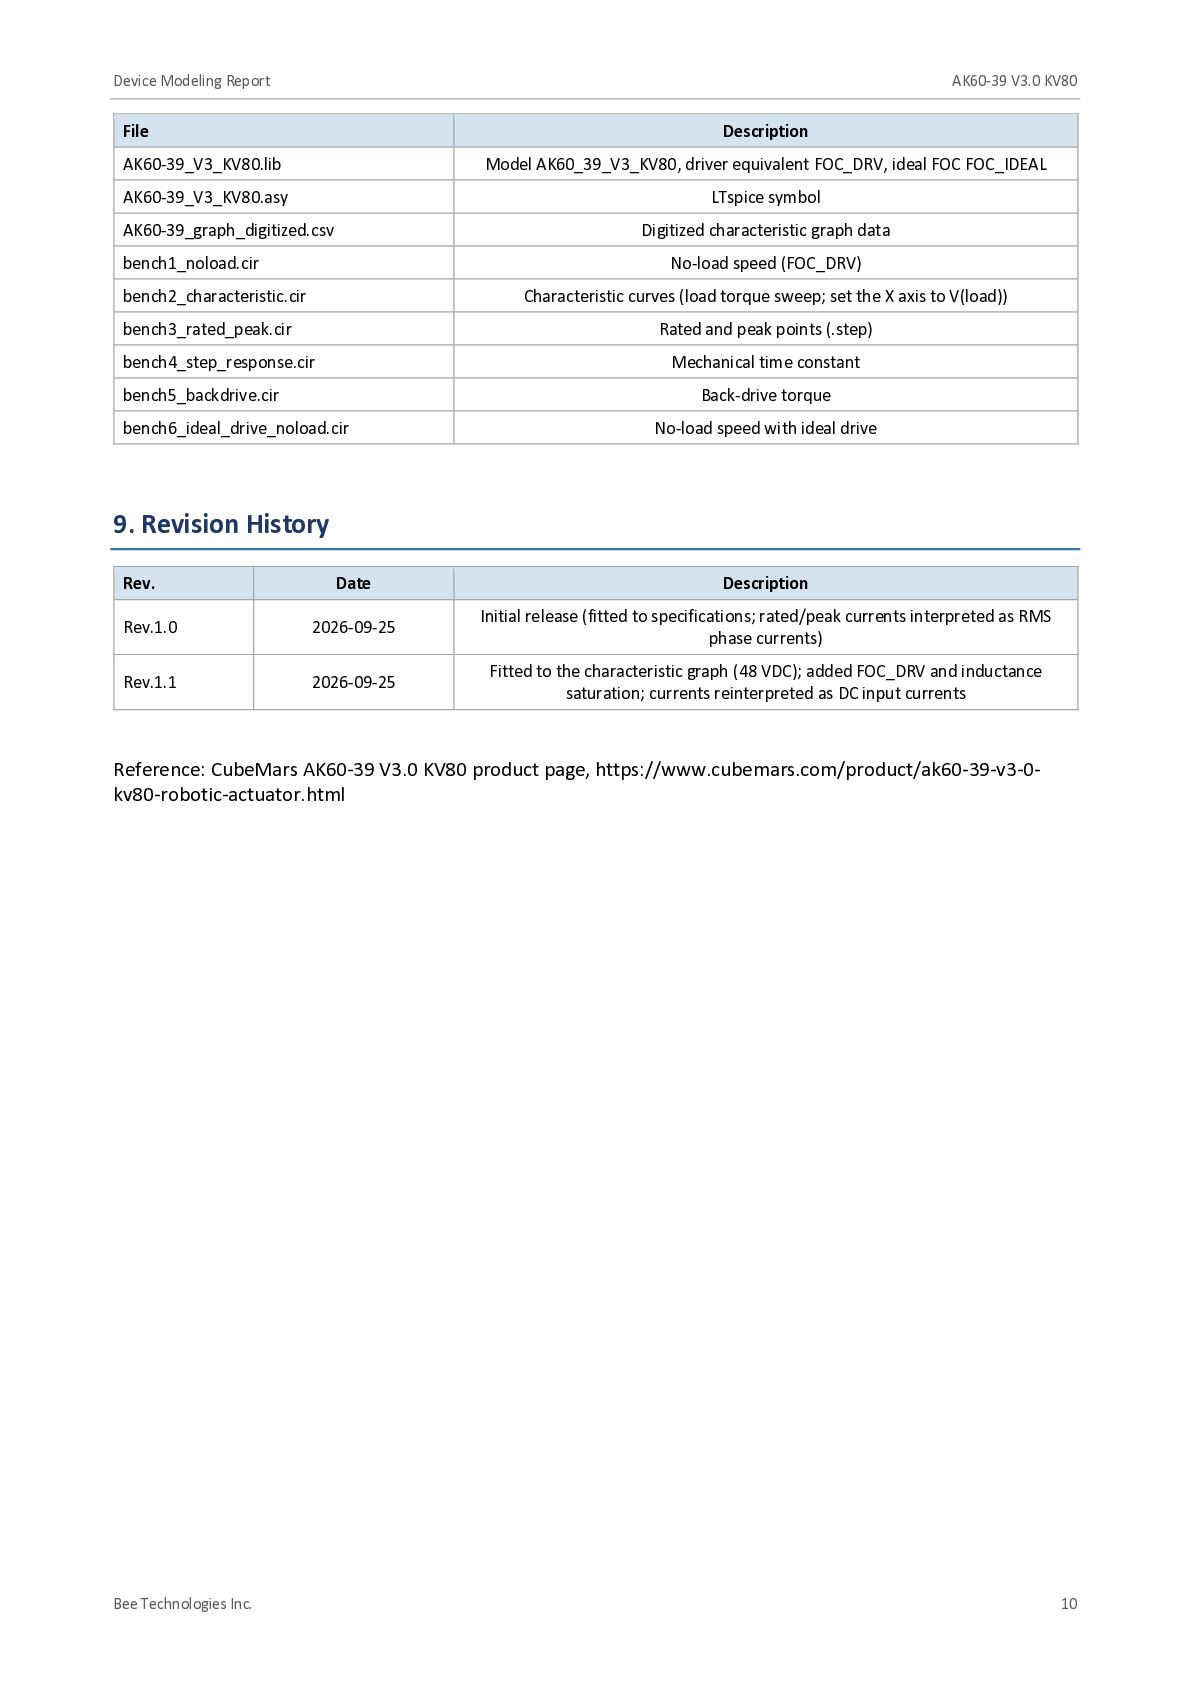
    Spec / graph Simulation Error Status Graph speed (12 pts) – max error ±2.9 % Match (fitted) Graph Idc (≥21 N·m) – max error ±6.8 % Match (fitted) Graph Idc (5–14 N·m) – max error ±13.2 % Deviation (low current) Graph efficiency (check) – max error +9.6 pt @5 N·m Match except low torque No-load speed (graph) 83.8 rpm 85.04 rpm +1.5 % Match No-load speed (spec, ideal drive) 98 rpm 98.30 rpm +0.3 % Match Rated speed @24 N·m 70 rpm 71.20 rpm +1.7 % Match Rated current (DC) 4.5 A 4.58 A +1.7 % Match Rated power 176 W 178.9 W +1.7 % Match Peak current (DC) @72 N·m 17 A 16.37 A -3.7 % Match Mechanical time constant 2.39 ms 2.389 ms -0.05 % Match (fitted) Back-drive torque 1.4 N·m 0.608 N·m -56.6 % Not fitted Table 6-1 Comparison summary (shaded rows show deviations) "Fitted" items were used as fitting targets, so agreement confirms the fit rather than independently validating the model. The rated and peak points lie on the same curves as the graph, so their agreement also follows from the graph fit. 7. Notes and Limitations • The model is based on published specifications and a graph read by eye; it has not been validated against hardware measurements. Bench validation is recommended. • The model has not been run in LTspice itself (all test benches were verified with ngspice-42). On first use, confirm that the .meas results of bench1–bench6 match this report. • FOC_DRV represents the manufacturer driver only as an effective model fitted at 48 VDC. MI, RDRV, and the saturation parameters are effective values; they may not hold at other supply voltages or with other drivers. • The graph cannot separate iron loss, gearbox loss, and driver loss. These are absorbed into RDRV, TC, and the saturation parameters. Iron loss and switching loss are not modeled explicitly. • The measurement conditions of the graph (temperature, test duration) are not stated. Temperature dependence of winding resistance and magnet flux is not modeled. • Cogging torque, torque ripple, backlash, encoder resolution, and driver protection functions are not modeled. • The saturable inductance is an incremental-inductance approximation (V = kL·LPH·di/dt). 8. Deliverables Bee Technologies Inc. 9
  11. Device Modeling Report AK60-39 V3.0 KV80 File Description AK60-39_V3_KV80.lib Model

    AK60_39_V3_KV80, driver equivalent FOC_DRV, ideal FOC FOC_IDEAL AK60-39_V3_KV80.asy LTspice symbol AK60-39_graph_digitized.csv Digitized characteristic graph data bench1_noload.cir No-load speed (FOC_DRV) bench2_characteristic.cir Characteristic curves (load torque sweep; set the X axis to V(load)) bench3_rated_peak.cir Rated and peak points (.step) bench4_step_response.cir Mechanical time constant bench5_backdrive.cir Back-drive torque bench6_ideal_drive_noload.cir No-load speed with ideal drive 9. Revision History Rev. Date Description Rev.1.0 2026-09-25 Initial release (fitted to specifications; rated/peak currents interpreted as RMS phase currents) Rev.1.1 2026-09-25 Fitted to the characteristic graph (48 VDC); added FOC_DRV and inductance saturation; currents reinterpreted as DC input currents Reference: CubeMars AK60-39 V3.0 KV80 product page, https://www.cubemars.com/product/ak60-39-v3-0kv80-robotic-actuator.html Bee Technologies Inc. 10