I gave this presentation on November 3rd at the 2011 HOW Interactive Design Conference in San Francisco, CA.
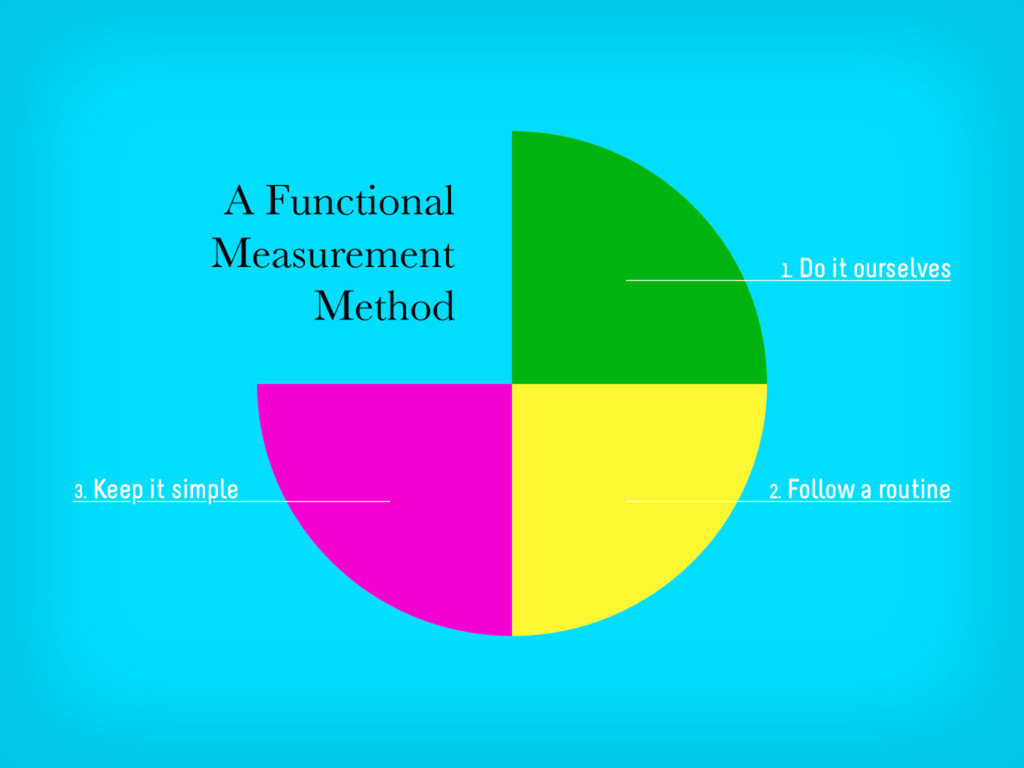
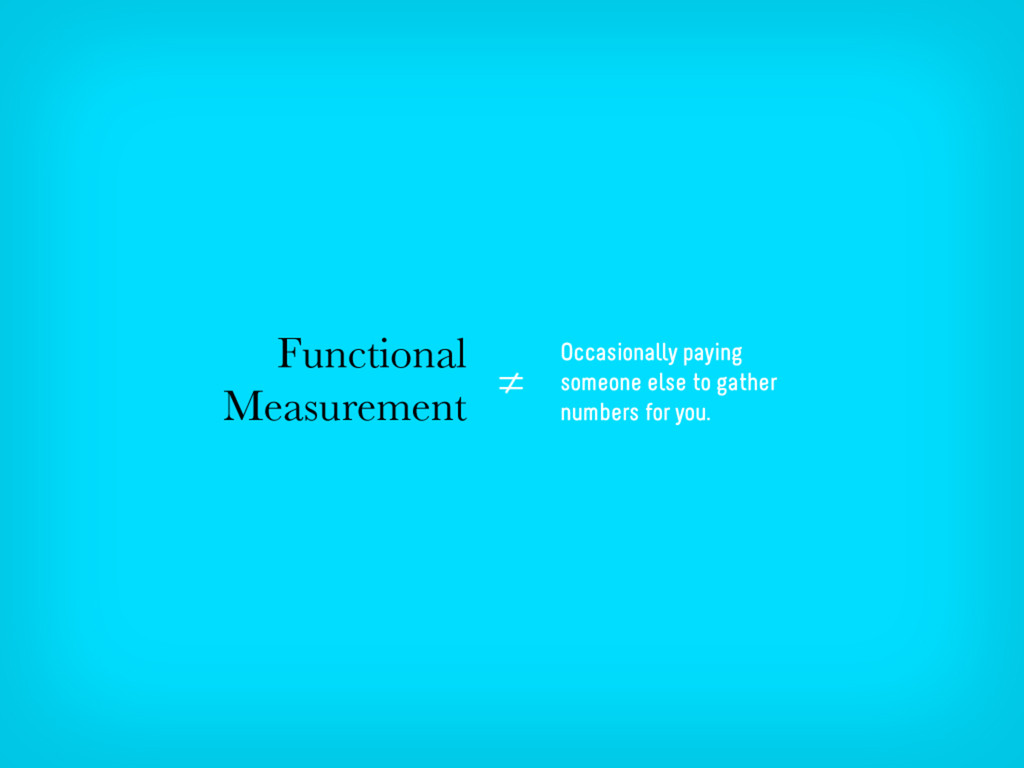
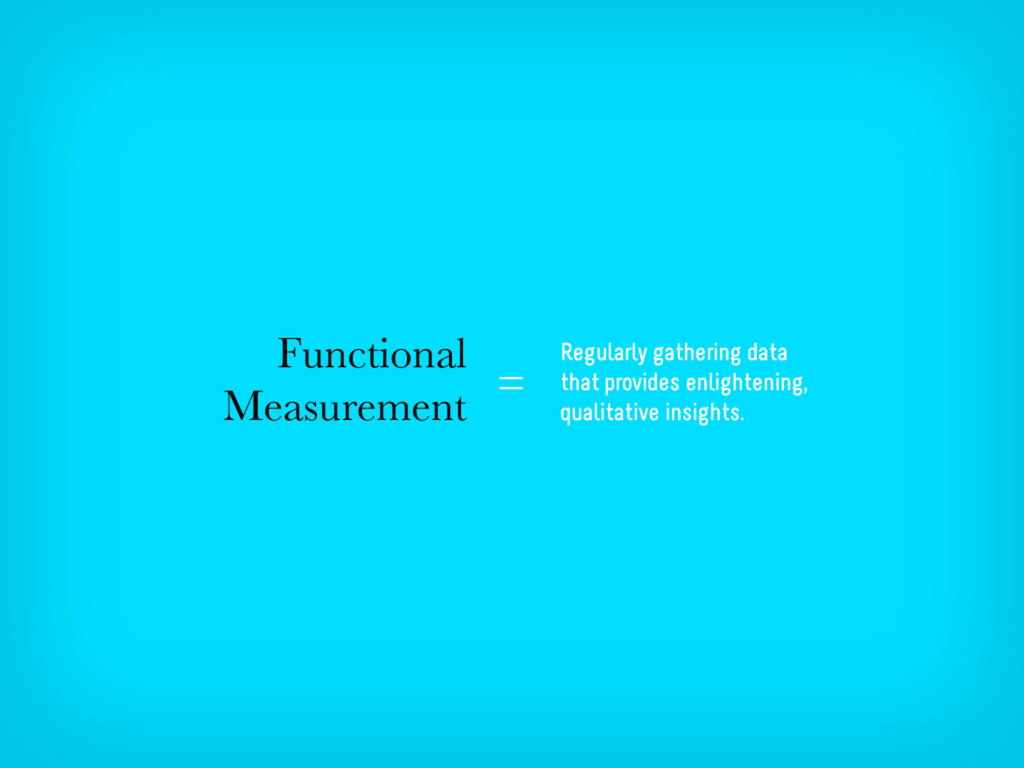
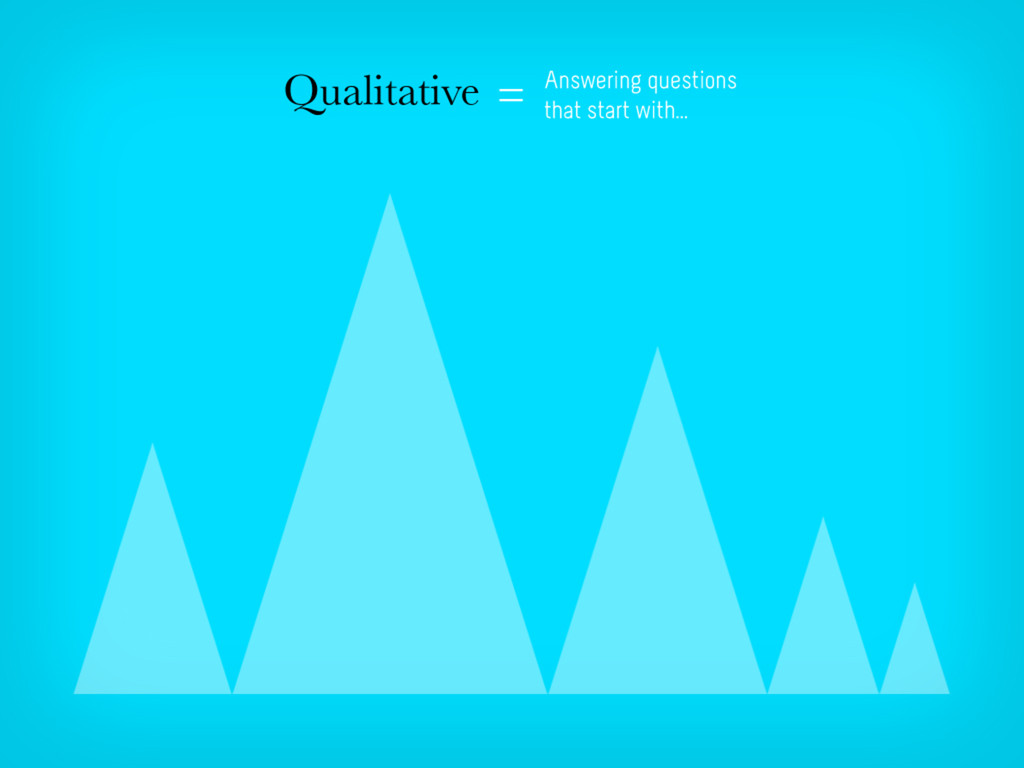
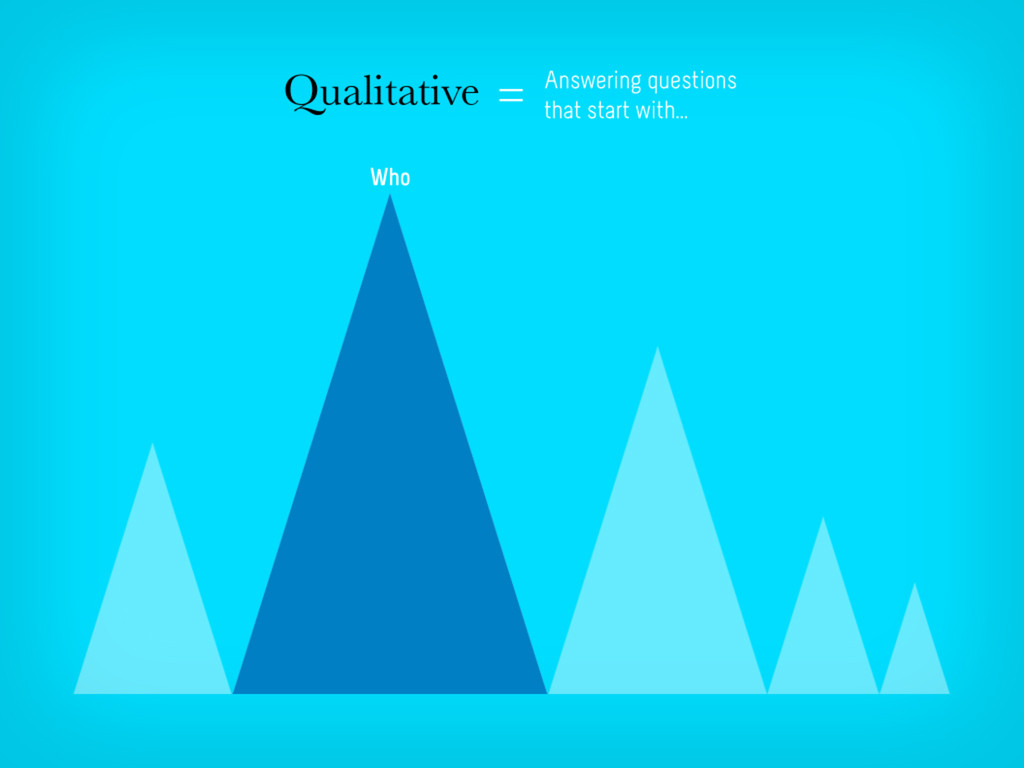
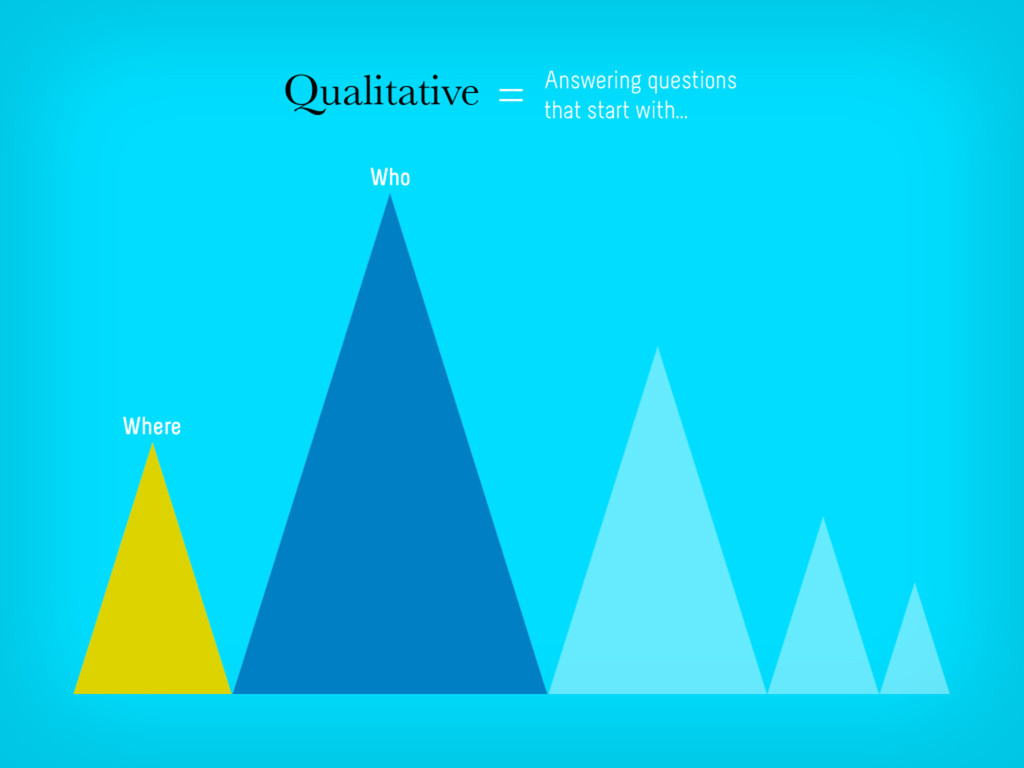
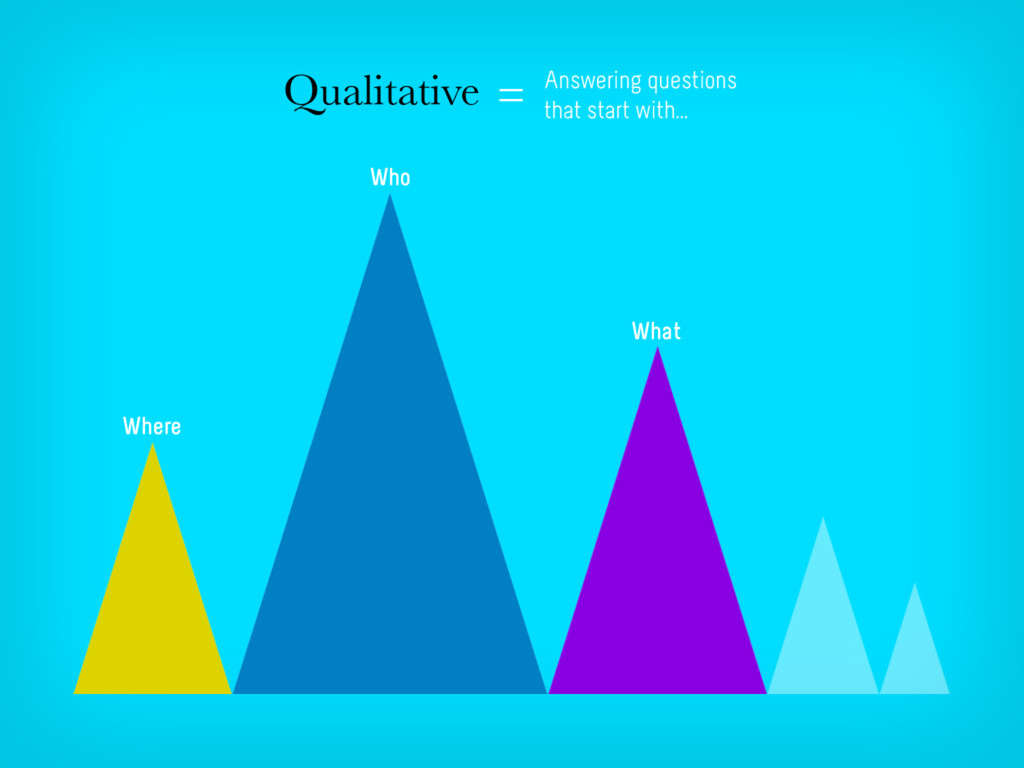
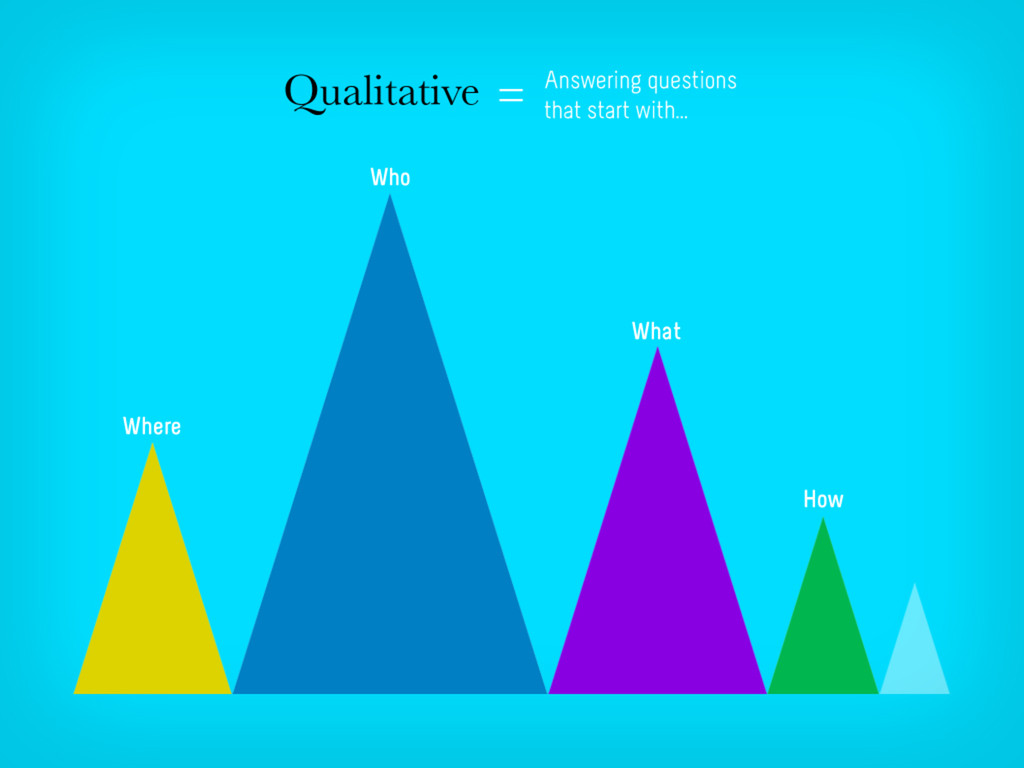
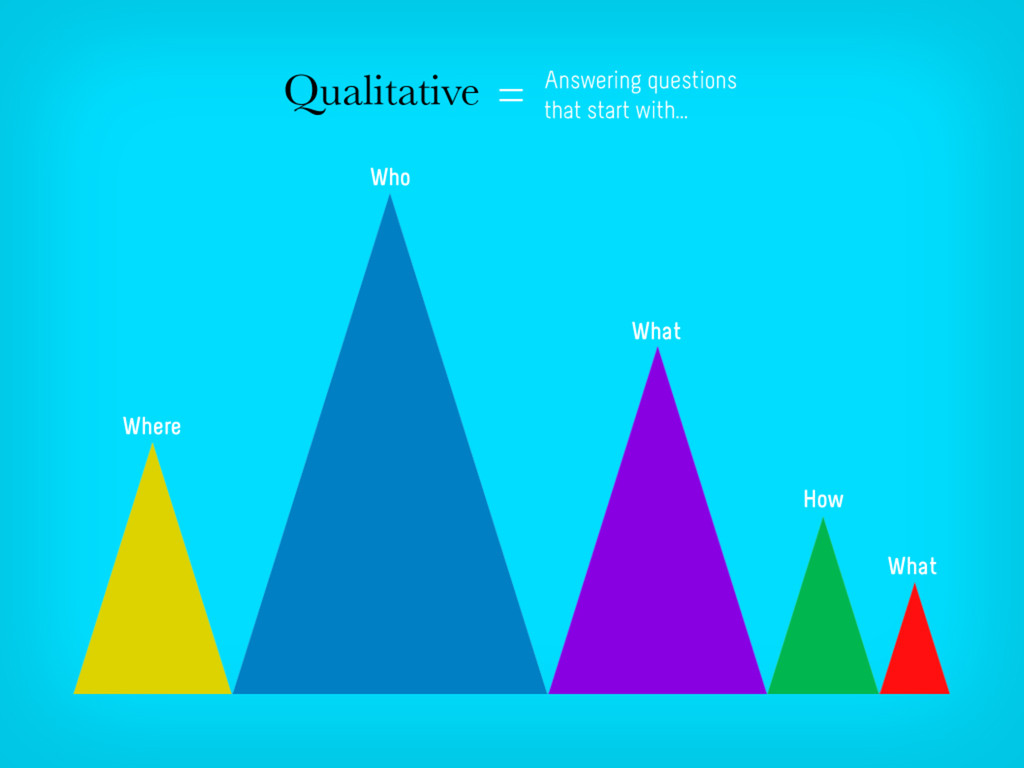
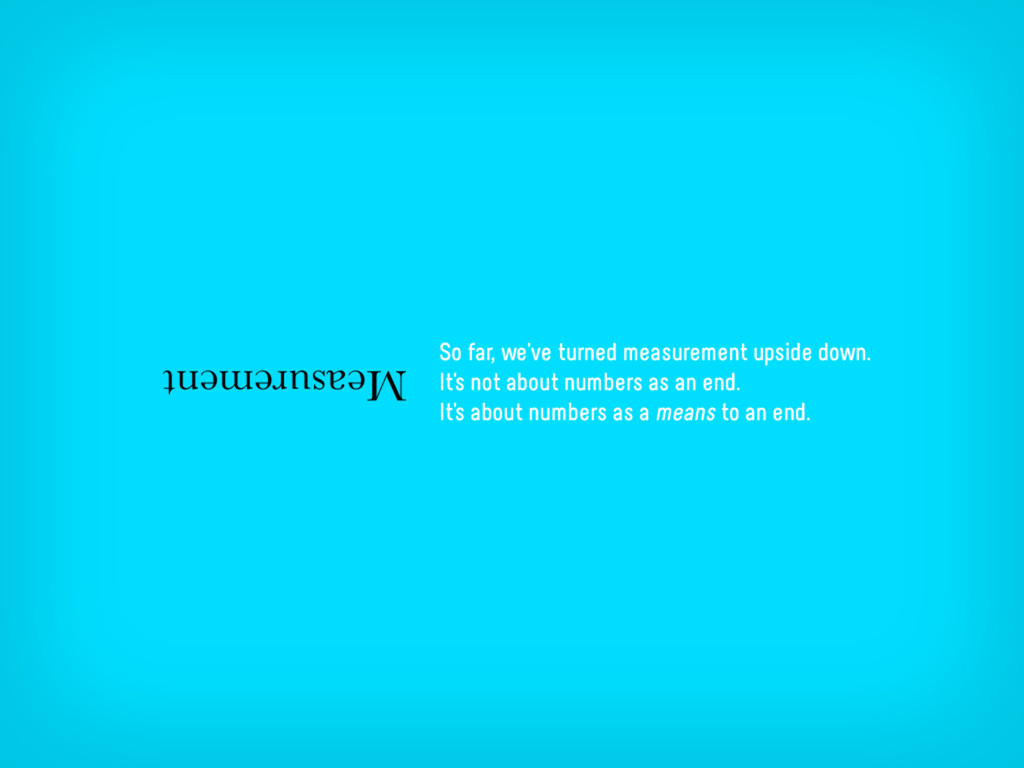
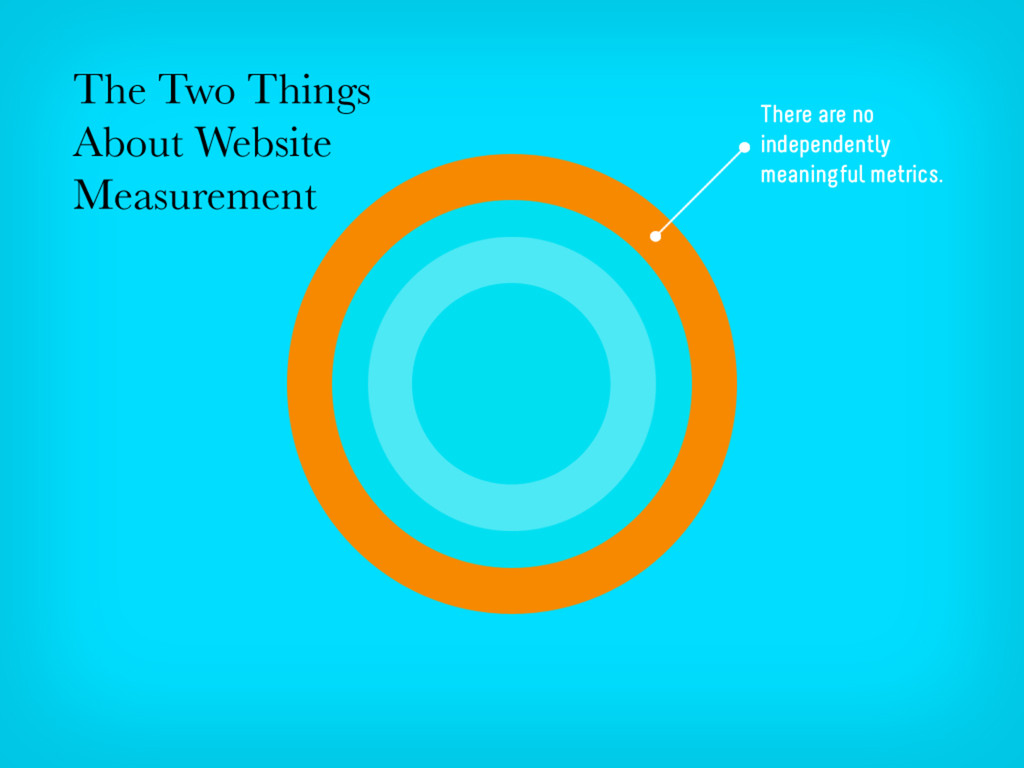
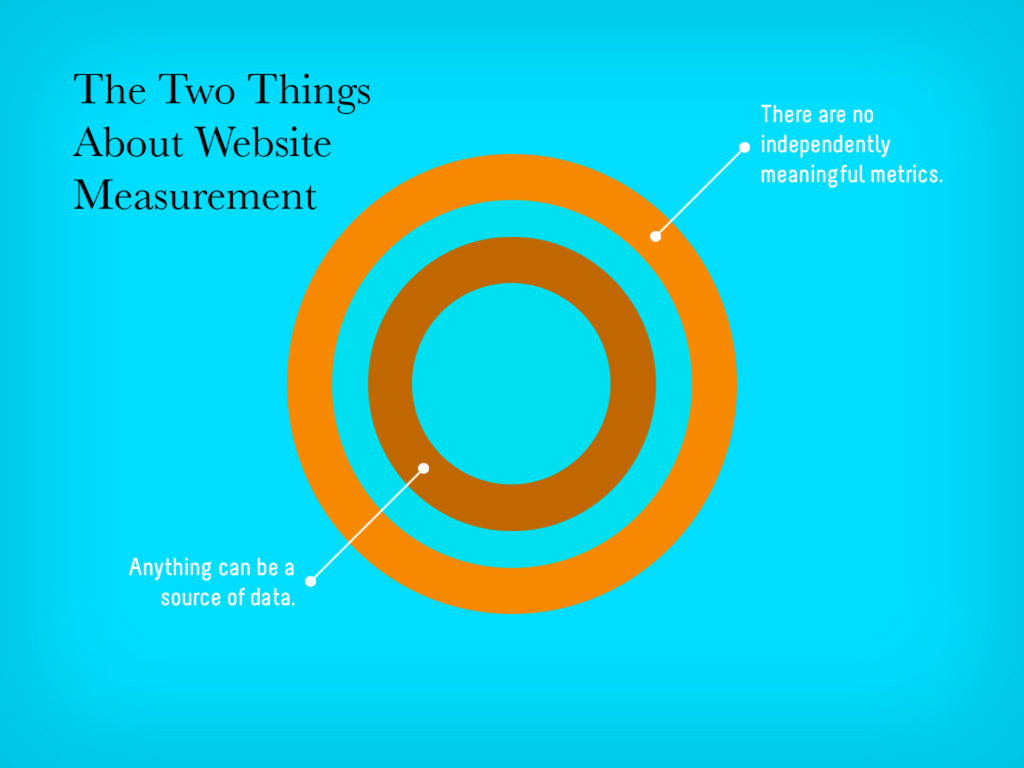
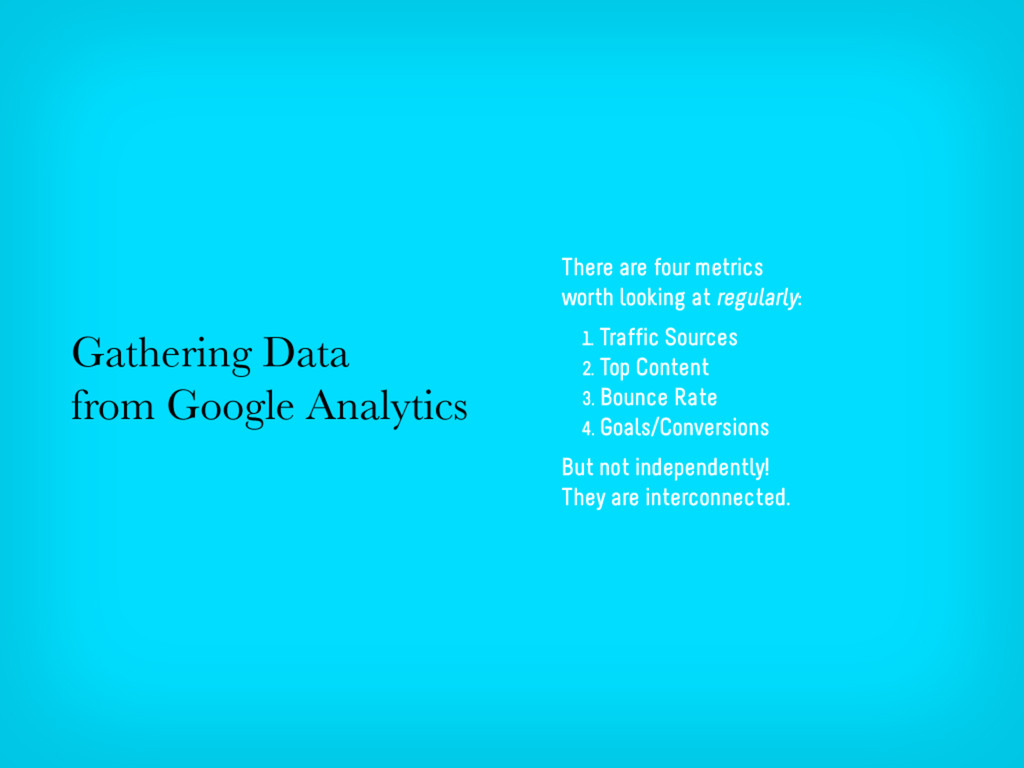
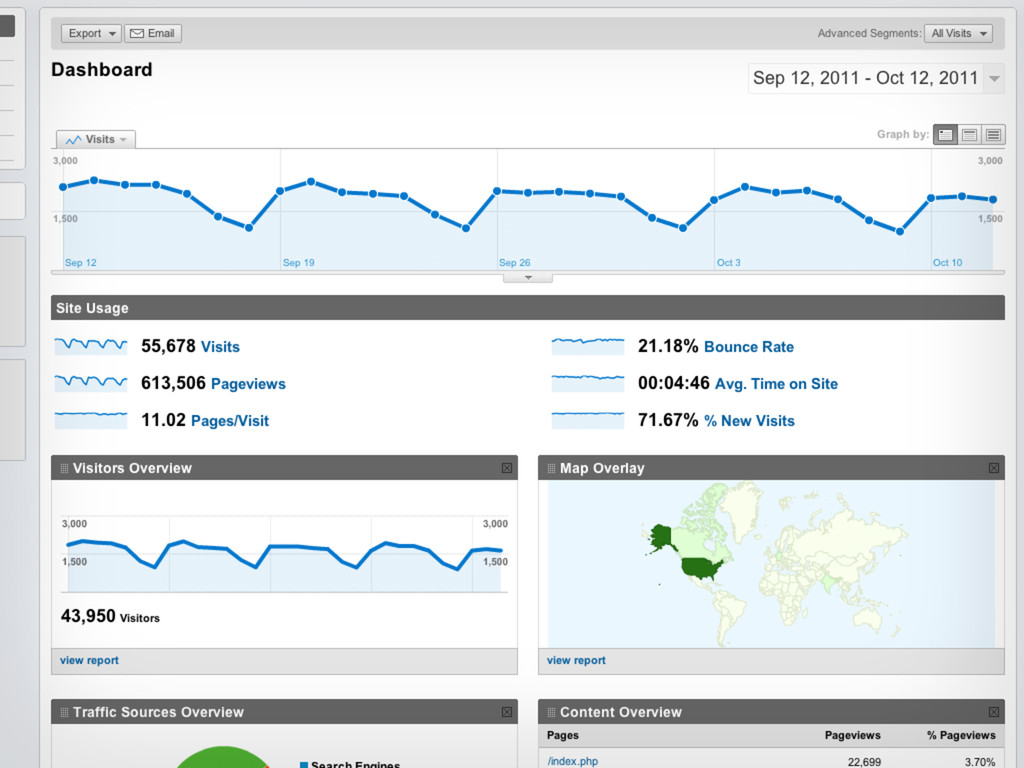
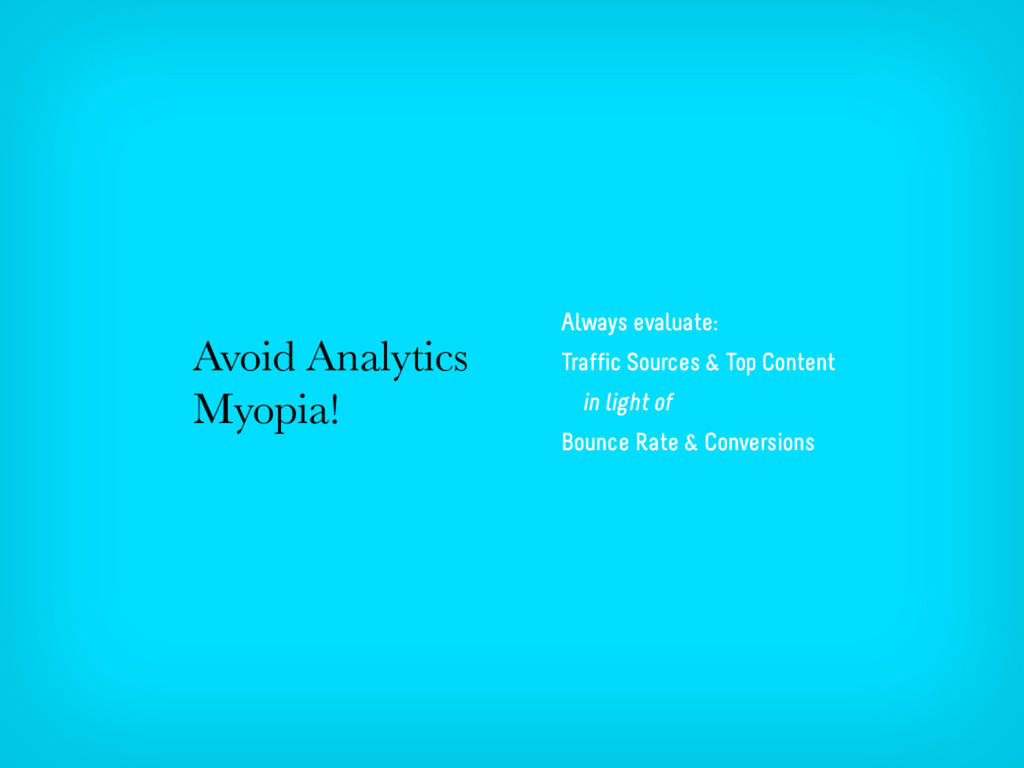
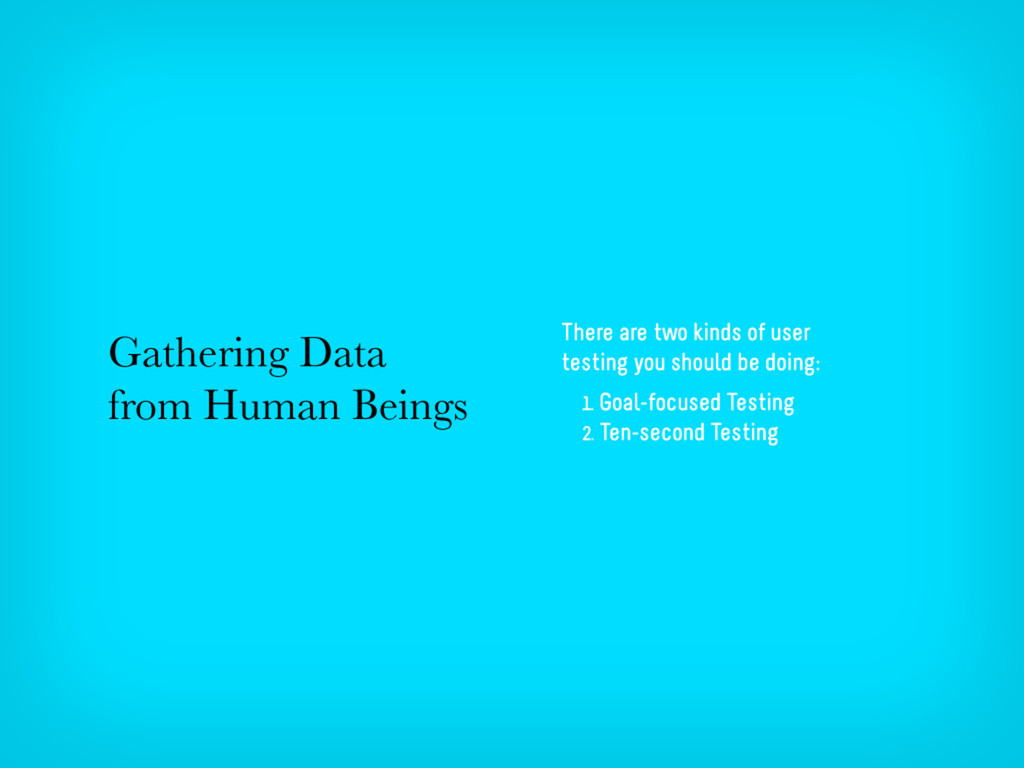
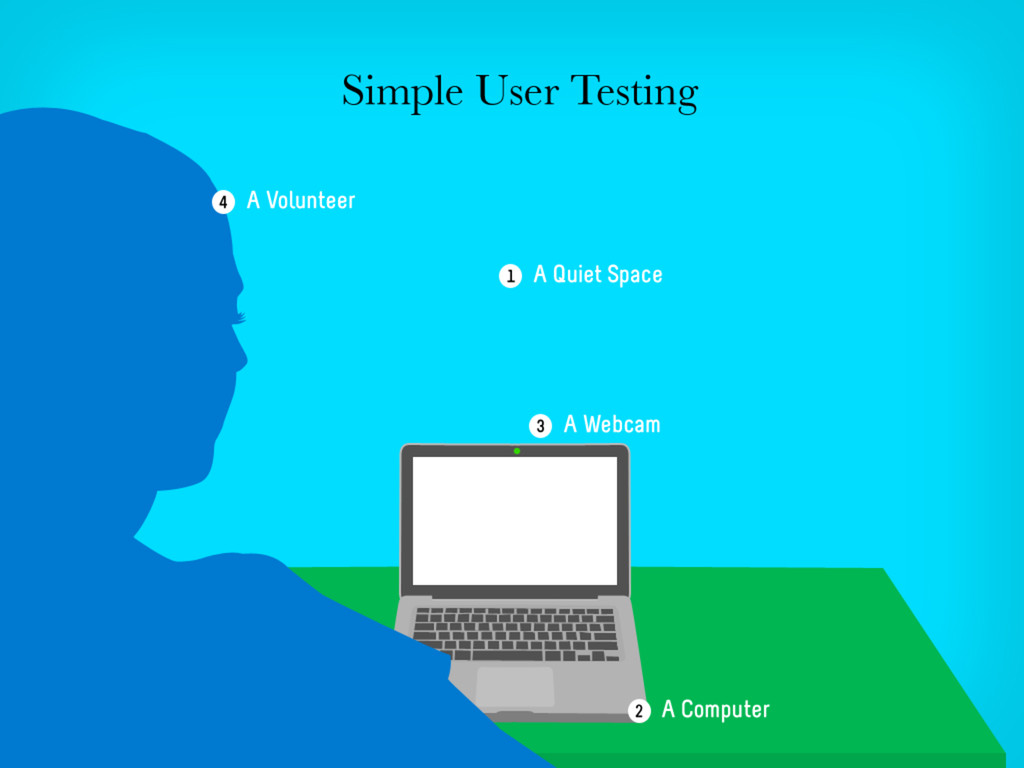
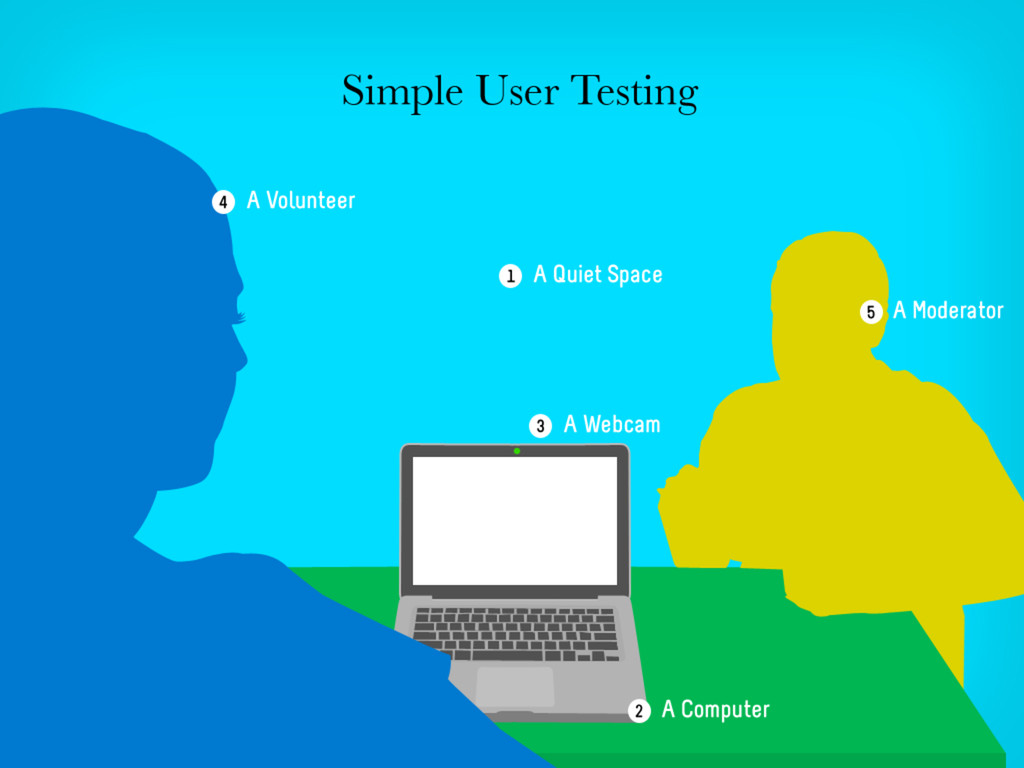
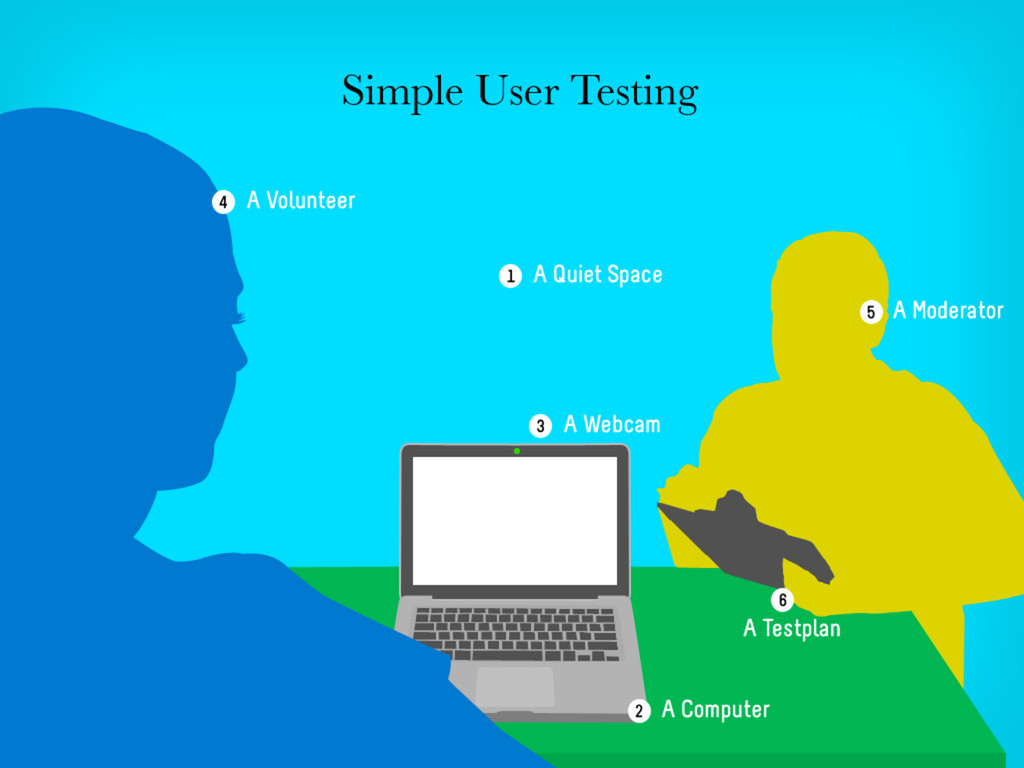
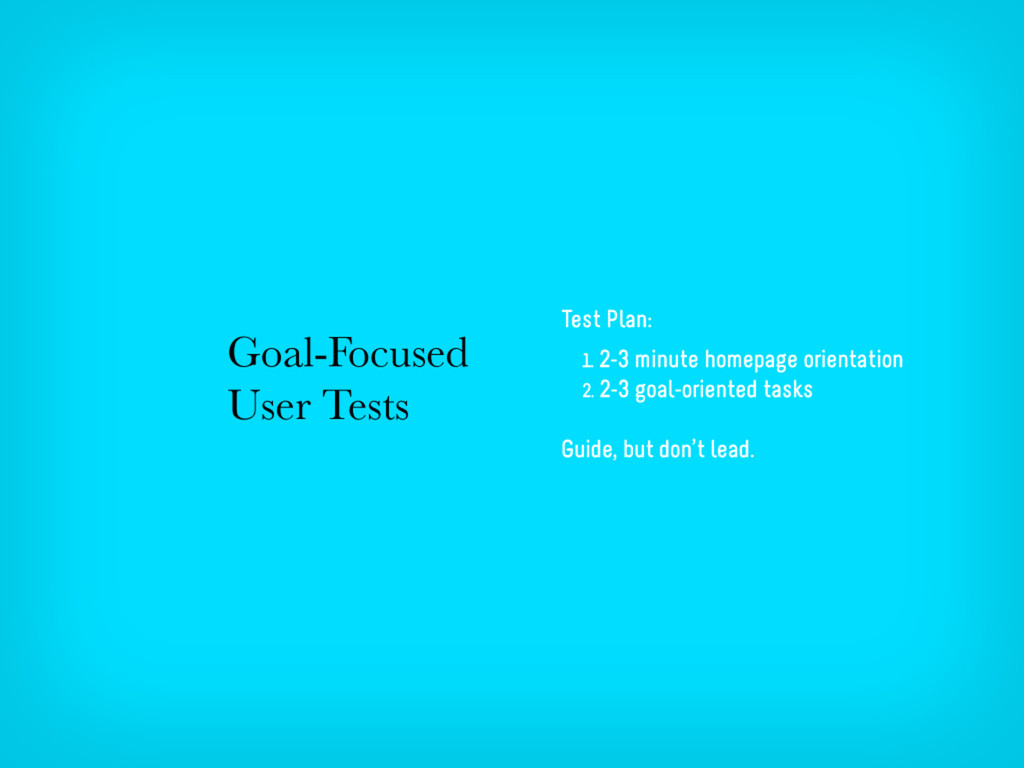
Rounding out a program that included many fascinating topics presented by a fantastic, talented group of people, I focused on what, comparatively, is the boring side of interactive design: making sense of the data. You'll learn how to start regularly gathering data that provides enlightening, qualitative insights, how to meaningfully connect metrics from analytics tools, and how to gather data from real, live people.
You can also read a full transcript presented along with the full slide deck here: http://www.newfangled.com/making_sense_of_the_data