Upgrade to Pro
— share decks privately, control downloads, hide ads and more …
Speaker Deck
Features
Speaker Deck
PRO
Sign in
Sign up for free
Search
Search
SOC 4650/5650 - Lab-03 Replication
Search
Christopher Prener
February 04, 2019
Education
470
0
Share
Embed
Copy iframe code
Copy JS code
Copy link
Start on current slide
SOC 4650/5650 - Lab-03 Replication
Replication process for Lab-03 - Major Tornados in the St. Louis Area
Christopher Prener
February 04, 2019
More Decks by Christopher Prener
See All by Christopher Prener
washu-lec
chrisprener
0
190
slu_ahead.pdf
chrisprener
0
260
fundamental-causes-psych
chrisprener
0
140
fundamental-causes- slu-geriatric
chrisprener
0
230
fundamental-causes-ances
chrisprener
0
490
stitching-across-data-seams-stlc
chrisprener
0
120
fundamental-causes-slu-med
chrisprener
0
150
data-seams-paa
chrisprener
0
190
ami_hospitalizations
chrisprener
0
100
Other Decks in Education
See All in Education
DECADE_ゴルフ_コースマネジメント完全ガイド.pdf
ozekinote
0
120
アラムコSTEAMチャレンジ 実践報告書
codeforeveryone
0
180
コミュニティを通じた_キャリア設計のススメ_20260424.pdf
masakiokuda
0
360
「機械学習と因果推論」入門 ⑤ 因果効果推定の一般化
masakat0
0
160
From Days to Minutes: How We Taught an AI to Onboard 50+ Tenants on our AI Features
mfcabrera
0
210
Data Management and Analytics Specialisation
signer
PRO
0
1.9k
!コスパよくインターンに受かる方法!
ruribou
1
300
AI-Based Speaking Assessment of a Short-Term Study Abroad Program
uranoken
0
370
[2026前期火5] 論理学(京都大学文学部 前期 第6回)「かつとまたはの規則」
yatabe
0
430
2026年度春学期 統計学 第8回(オンデマンド配信回) 演習(1)・問題に対する答案の書き方 (2026. 5. 21)
akiraasano
PRO
0
130
自己紹介 / who-am-i
yasulab
6
7k
Implicit and Cross-Device Interaction - Lecture 10 - Next Generation User Interfaces (4018166FNR)
signer
PRO
2
2.3k
Featured
See All Featured
Marketing to machines
jonoalderson
1
5.6k
Mozcon NYC 2025: Stop Losing SEO Traffic
samtorres
1
360
Design of three-dimensional binary manipulators for pick-and-place task avoiding obstacles (IECON2024)
konakalab
0
490
Test your architecture with Archunit
thirion
1
2.3k
Designing for Timeless Needs
cassininazir
1
360
More Than Pixels: Becoming A User Experience Designer
marktimemedia
3
460
Art, The Web, and Tiny UX
lynnandtonic
304
22k
Digital Ethics as a Driver of Design Innovation
axbom
PRO
1
340
Leo the Paperboy
mayatellez
8
1.9k
Learning to Love Humans: Emotional Interface Design
aarron
275
41k
Intergalactic Javascript Robots from Outer Space
tanoku
273
27k
Kristin Tynski - Automating Marketing Tasks With AI
techseoconnect
PRO
0
290
Transcript
Lab-03 Replication Major Tornadoes in the St. Louis Area
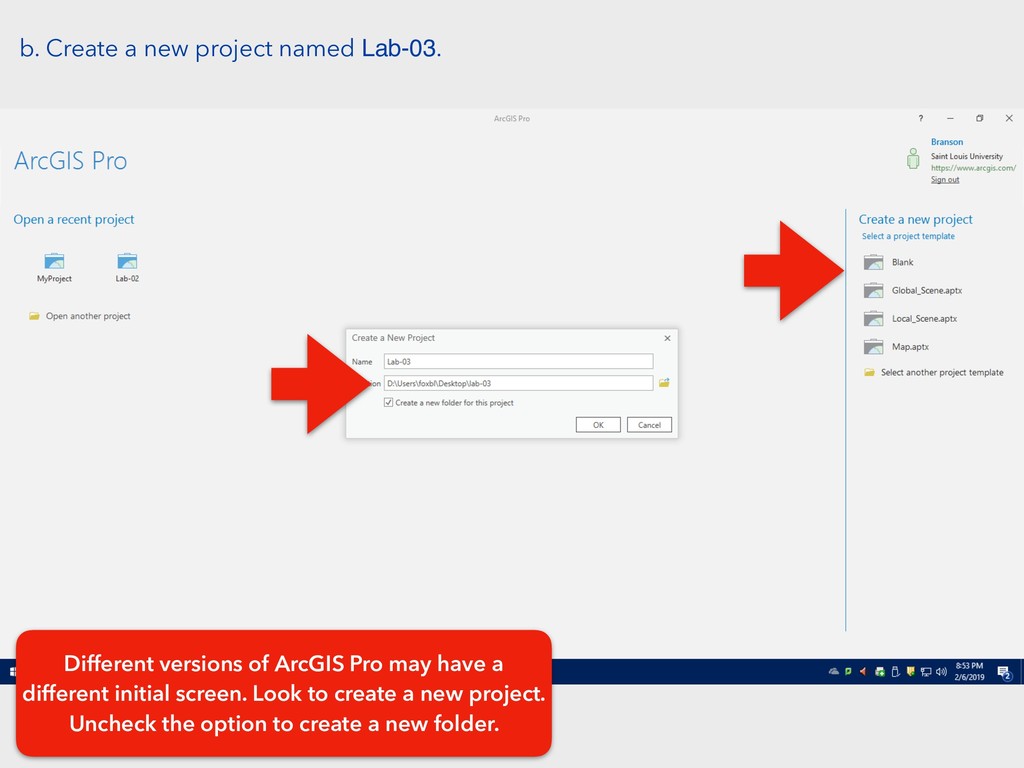
b. Create a new project named Lab-03. Different versions of
ArcGIS Pro may have a different initial screen. Look to create a new project. Uncheck the option to create a new folder.
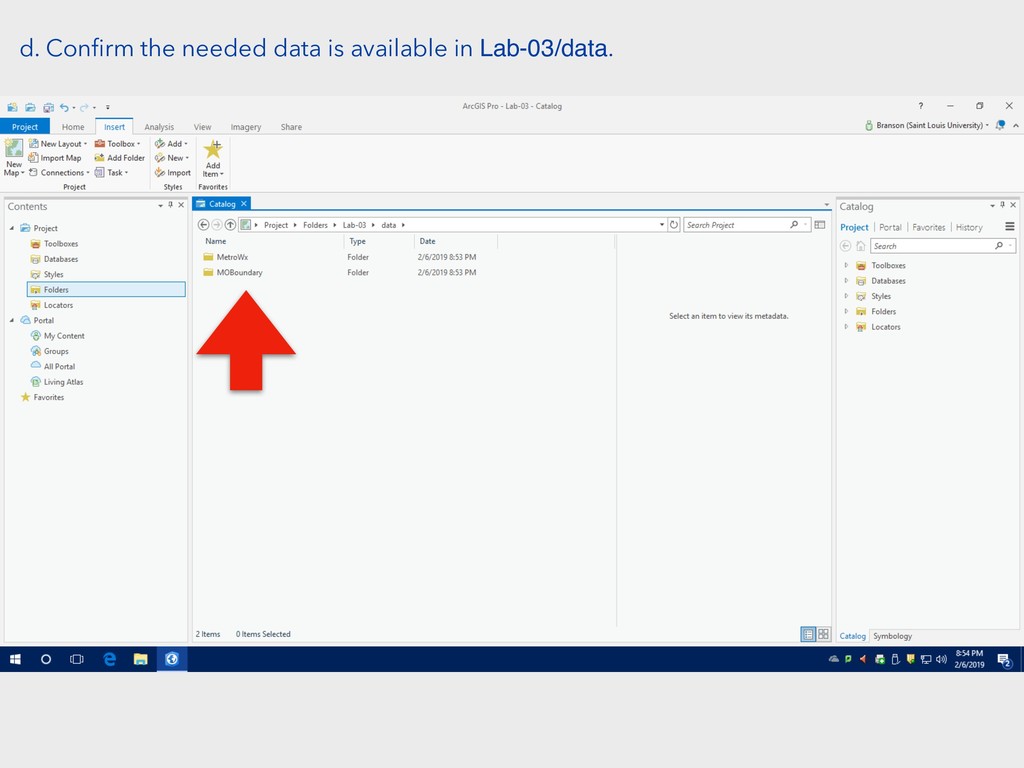
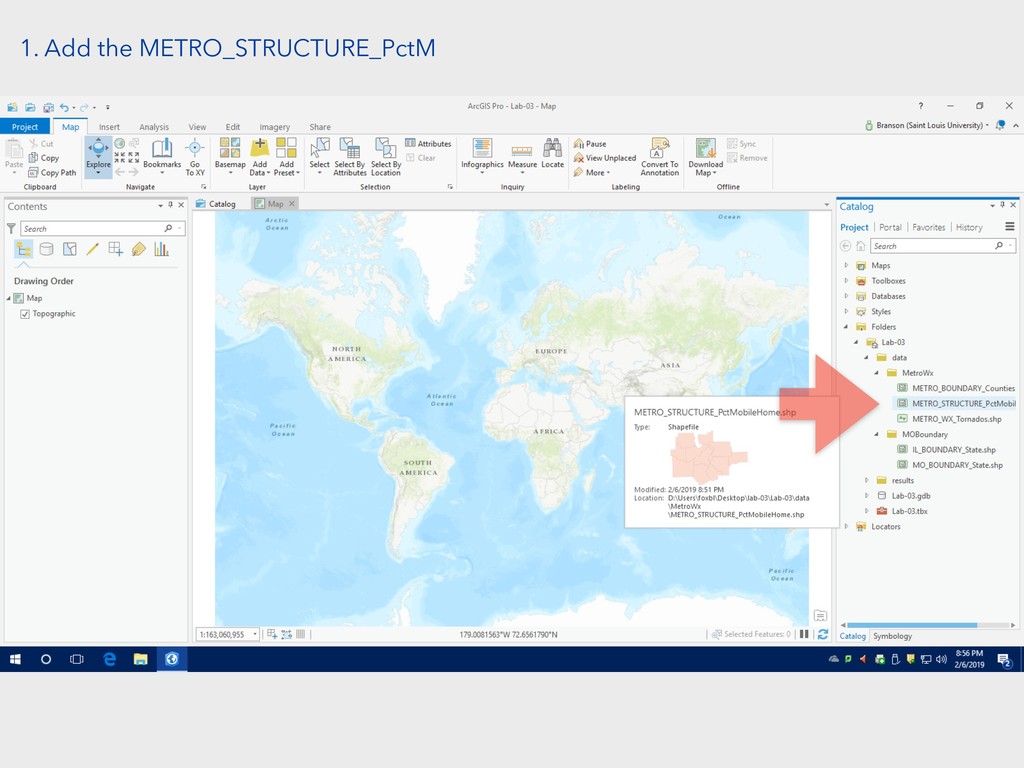
d. Confirm the needed data is available in Lab-03/data.
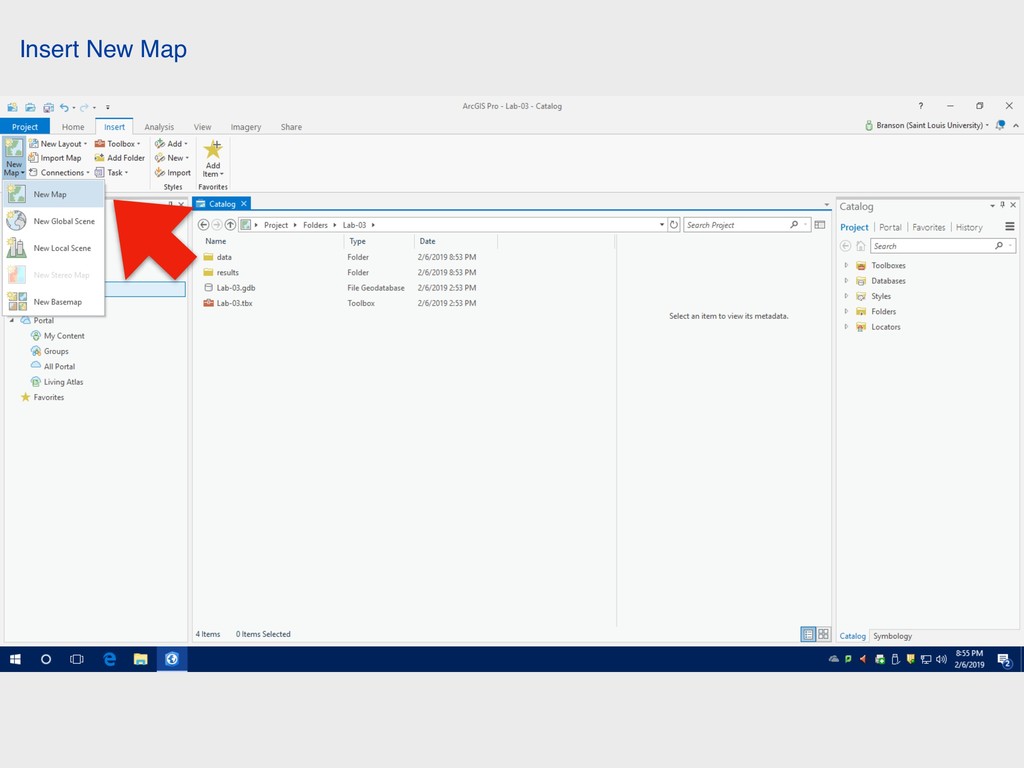
Insert New Map
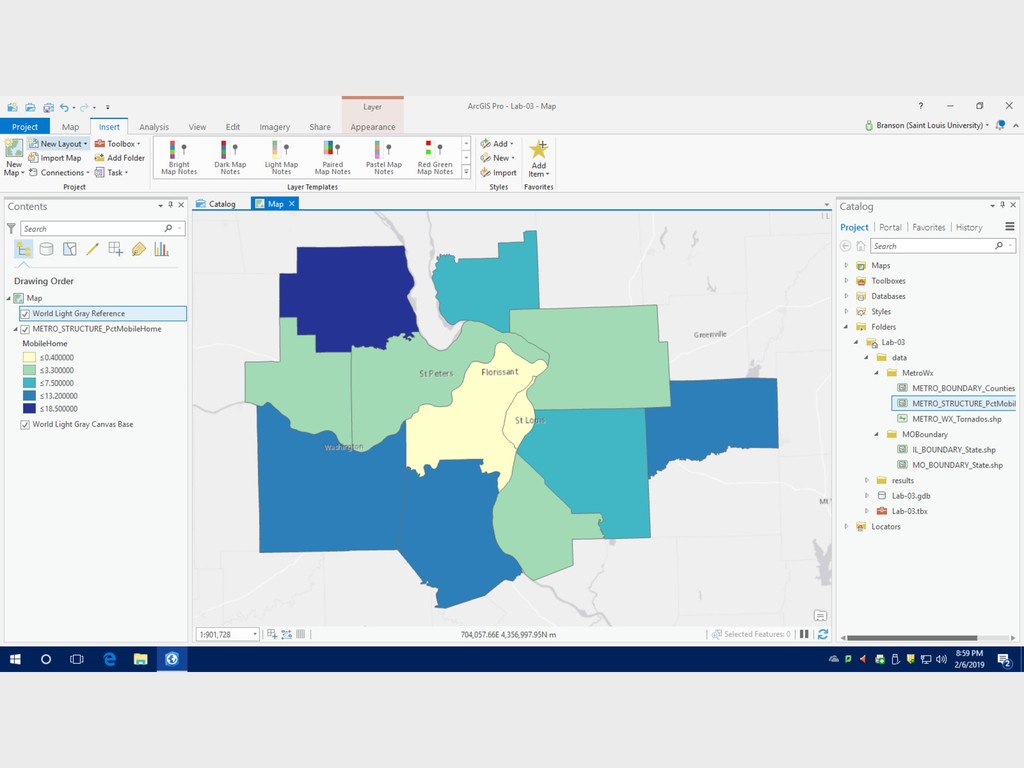
1. Add the METRO_STRUCTURE_PctM
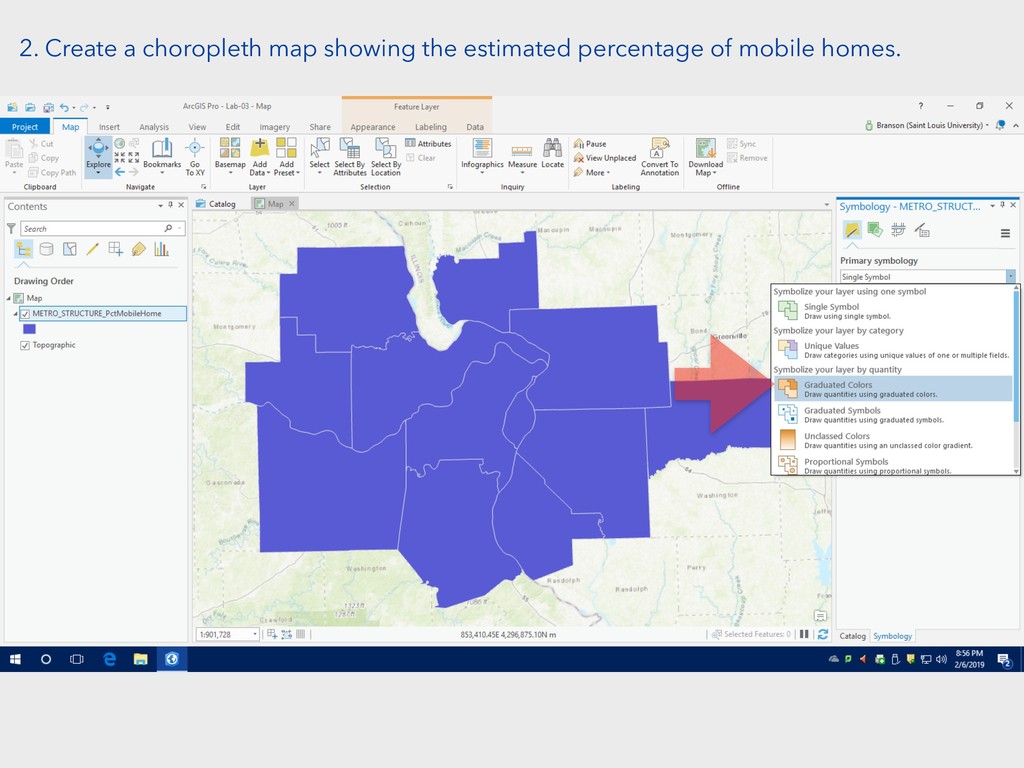
2. Create a choropleth map showing the estimated percentage of
mobile homes.
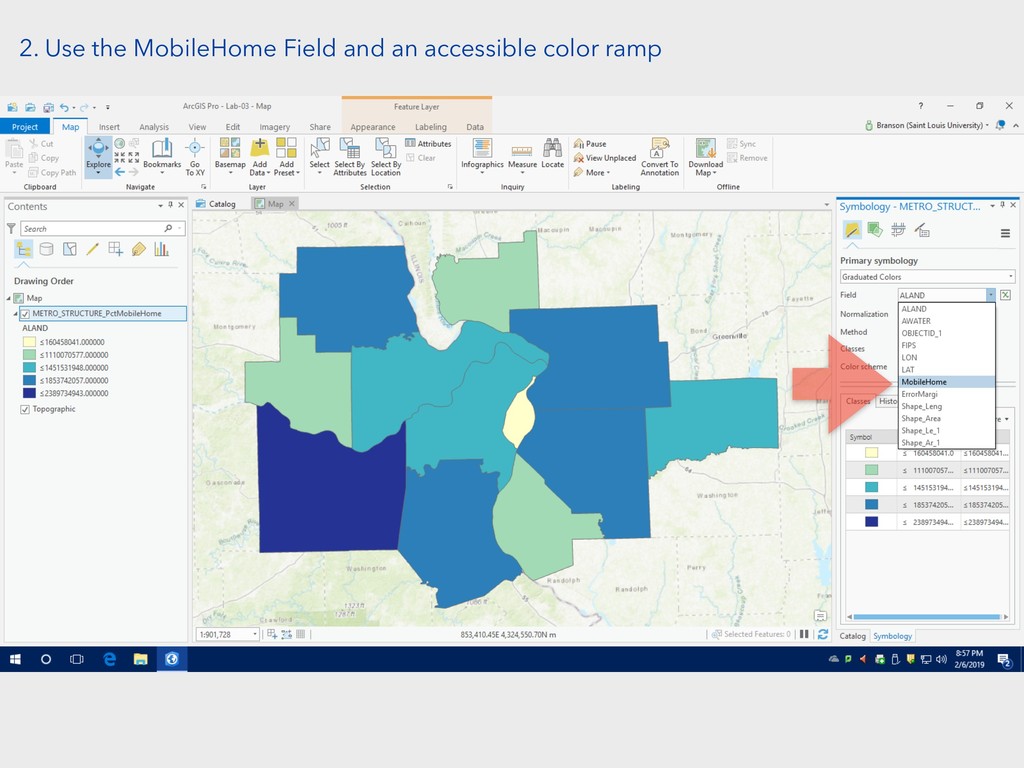
2. Use the MobileHome Field and an accessible color ramp
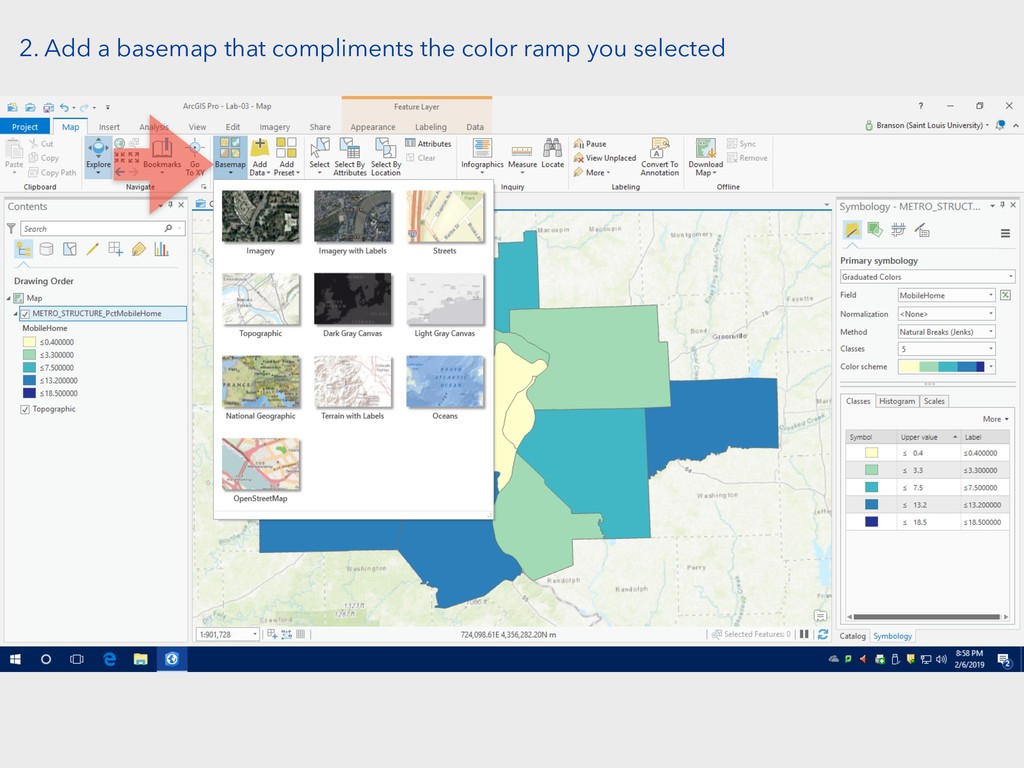
2. Add a basemap that compliments the color ramp you
selected
None
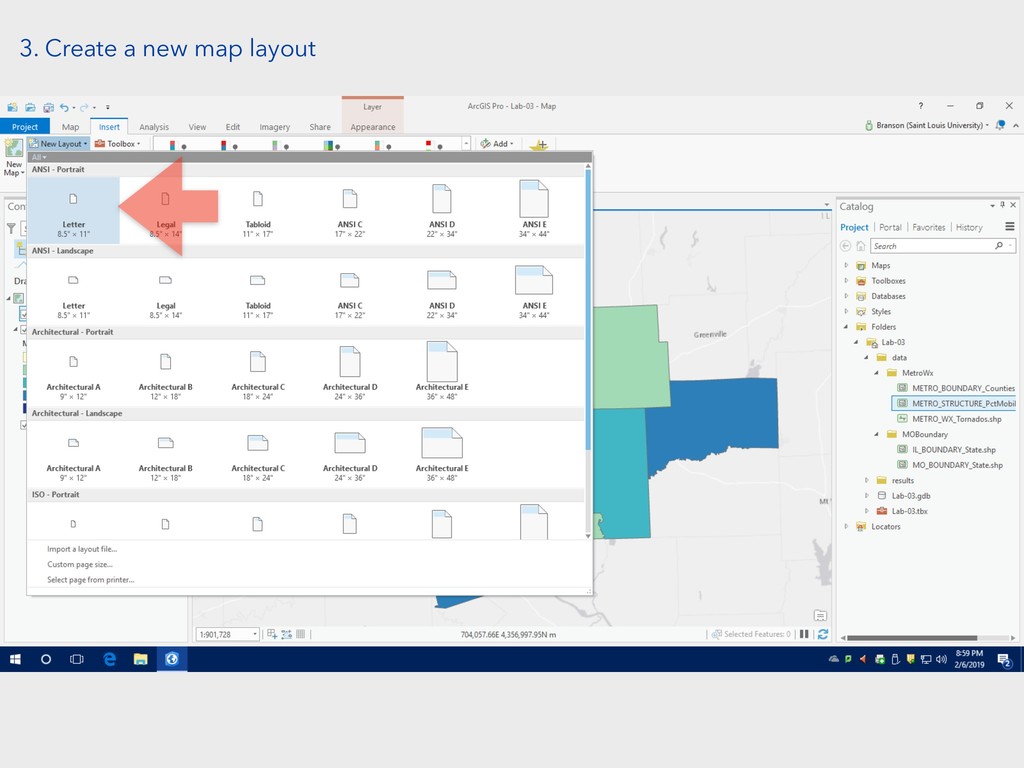
3. Create a new map layout
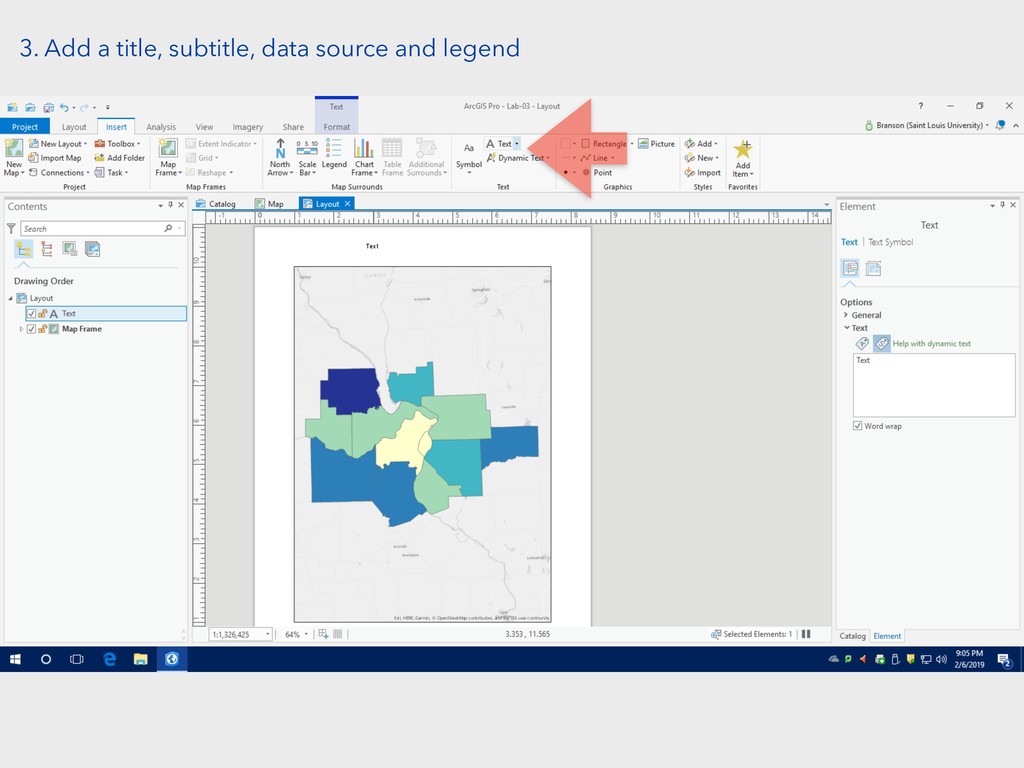
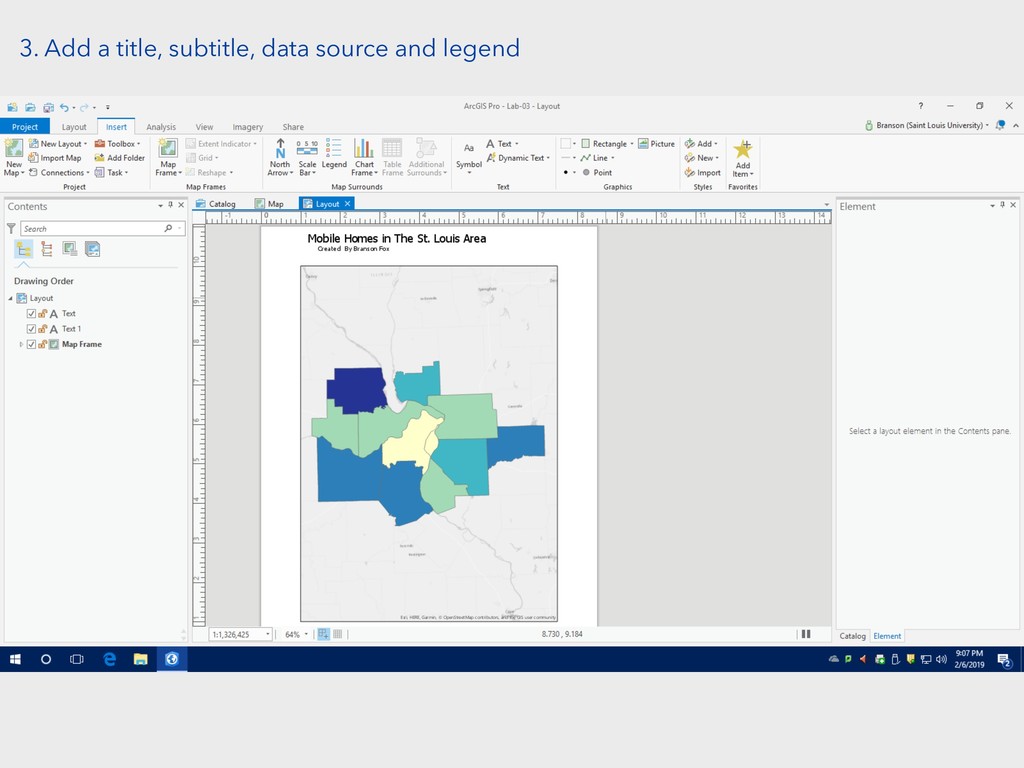
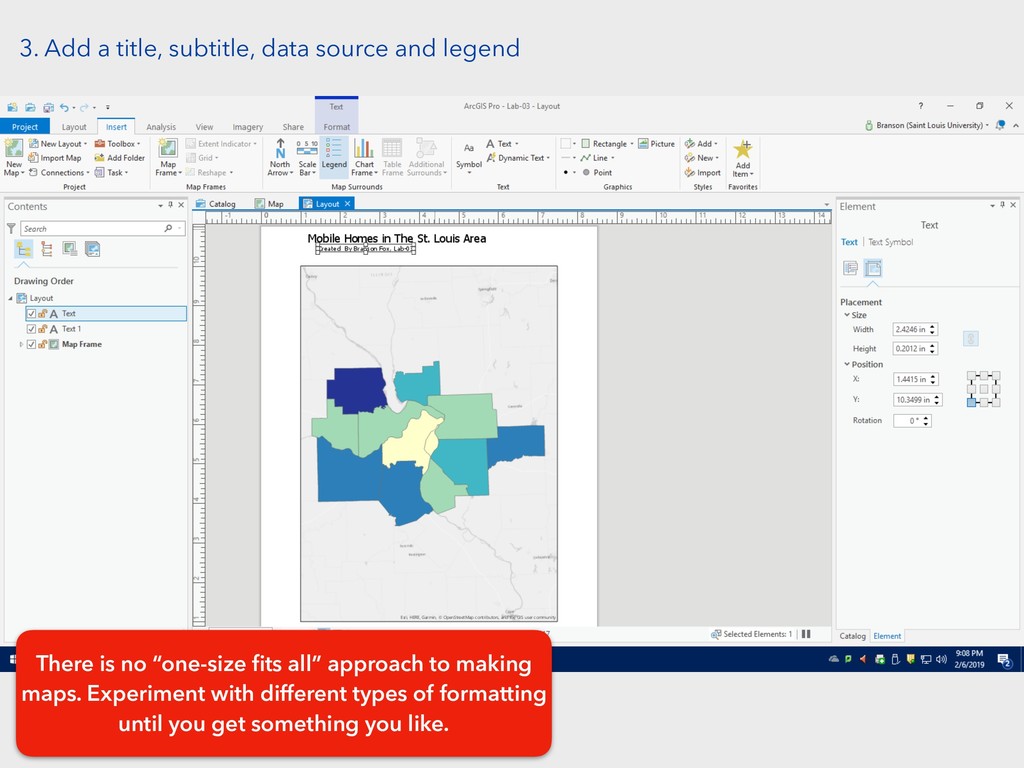
3. Add a title, subtitle, data source and legend
3. Add a title, subtitle, data source and legend
3. Add a title, subtitle, data source and legend There
is no “one-size fits all” approach to making maps. Experiment with different types of formatting until you get something you like.
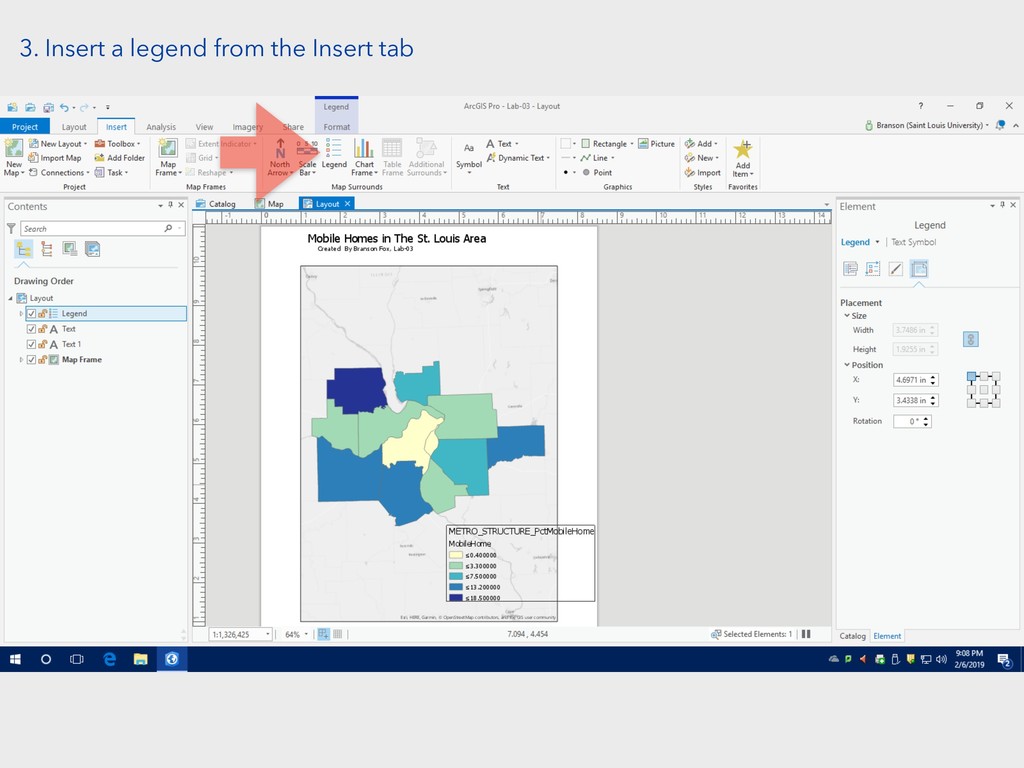
3. Insert a legend from the Insert tab
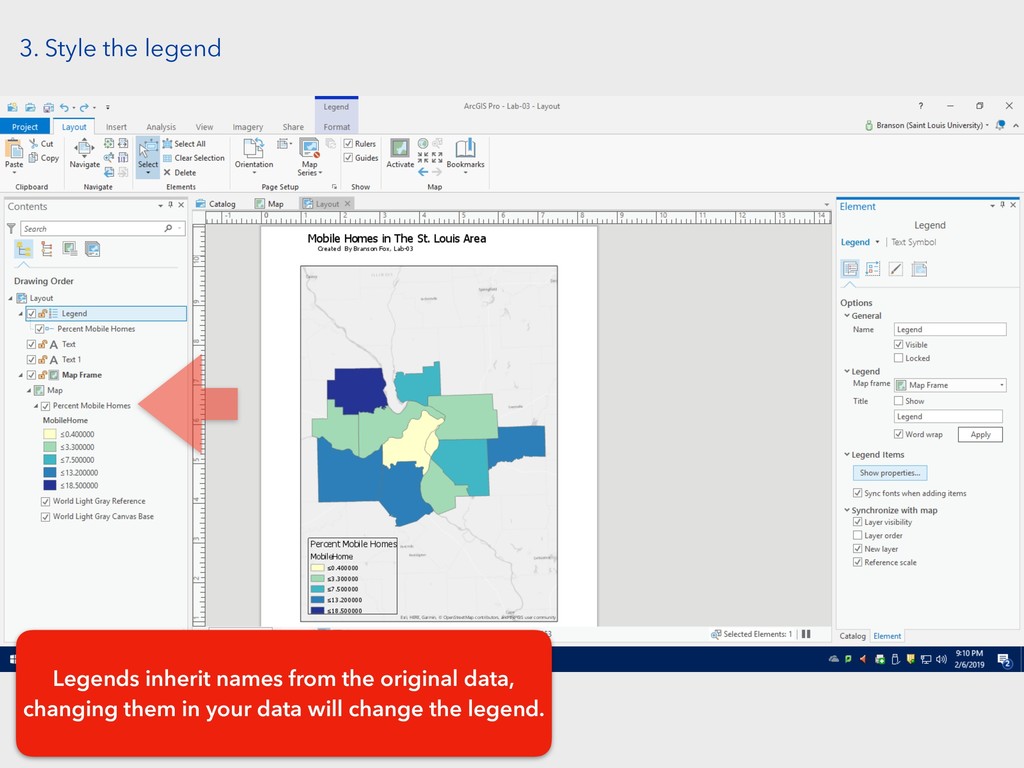
3. Style the legend Legends inherit names from the original
data, changing them in your data will change the legend.
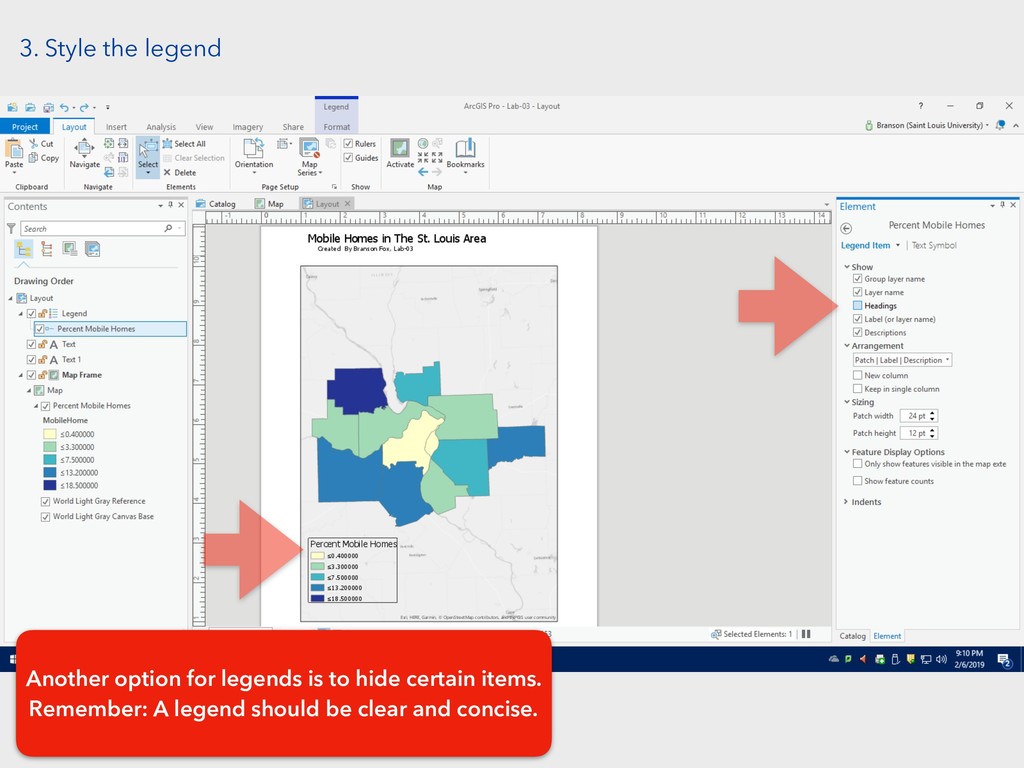
3. Style the legend Another option for legends is to
hide certain items. Remember: A legend should be clear and concise.
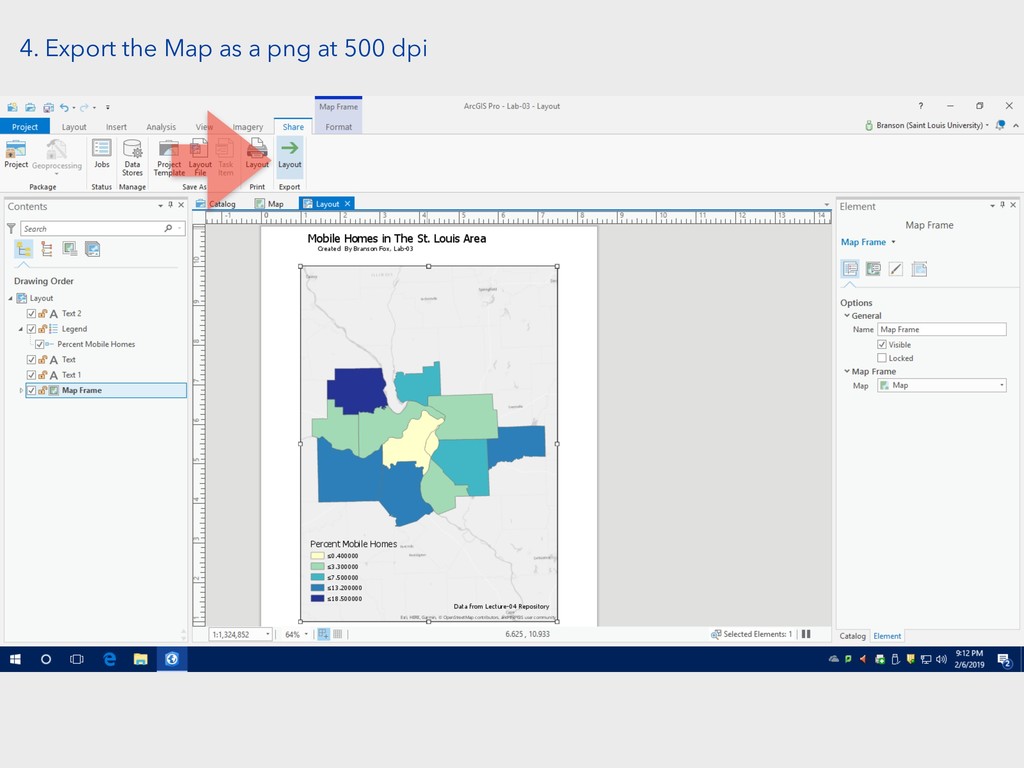
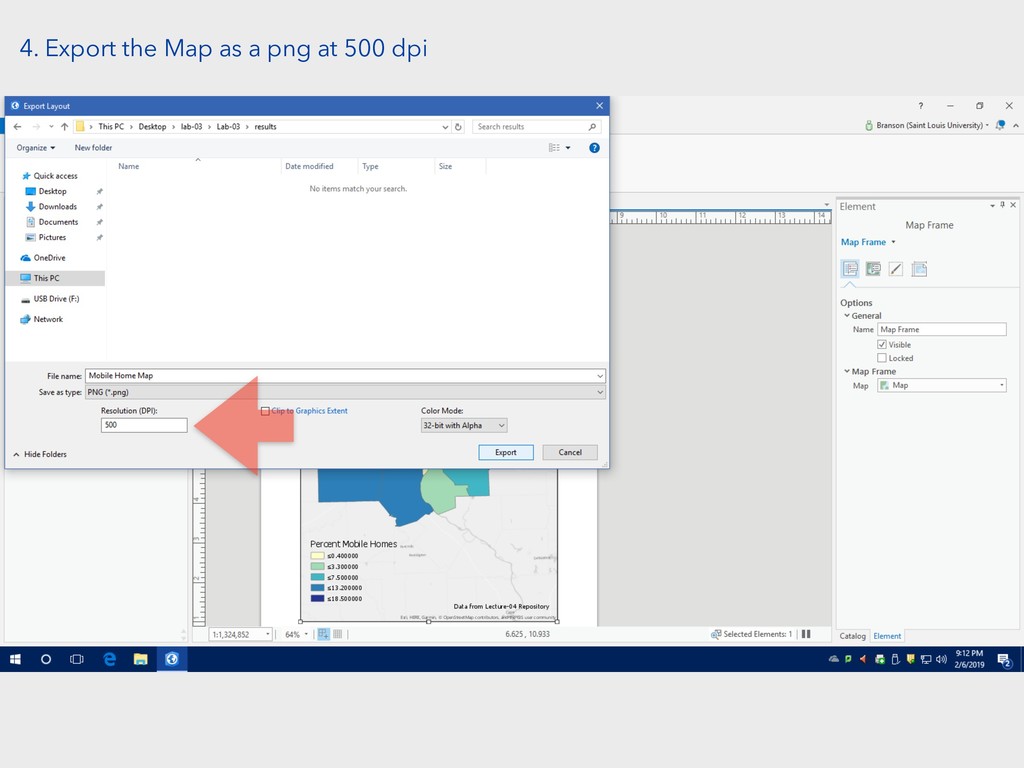
4. Export the Map as a png at 500 dpi
4. Export the Map as a png at 500 dpi
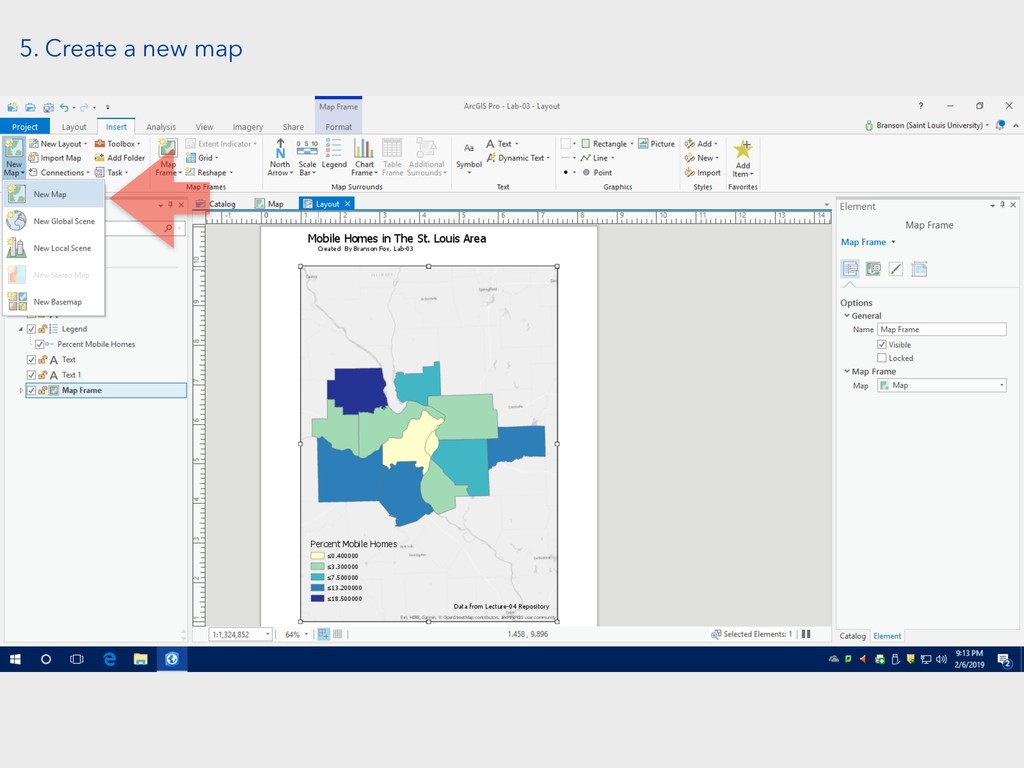
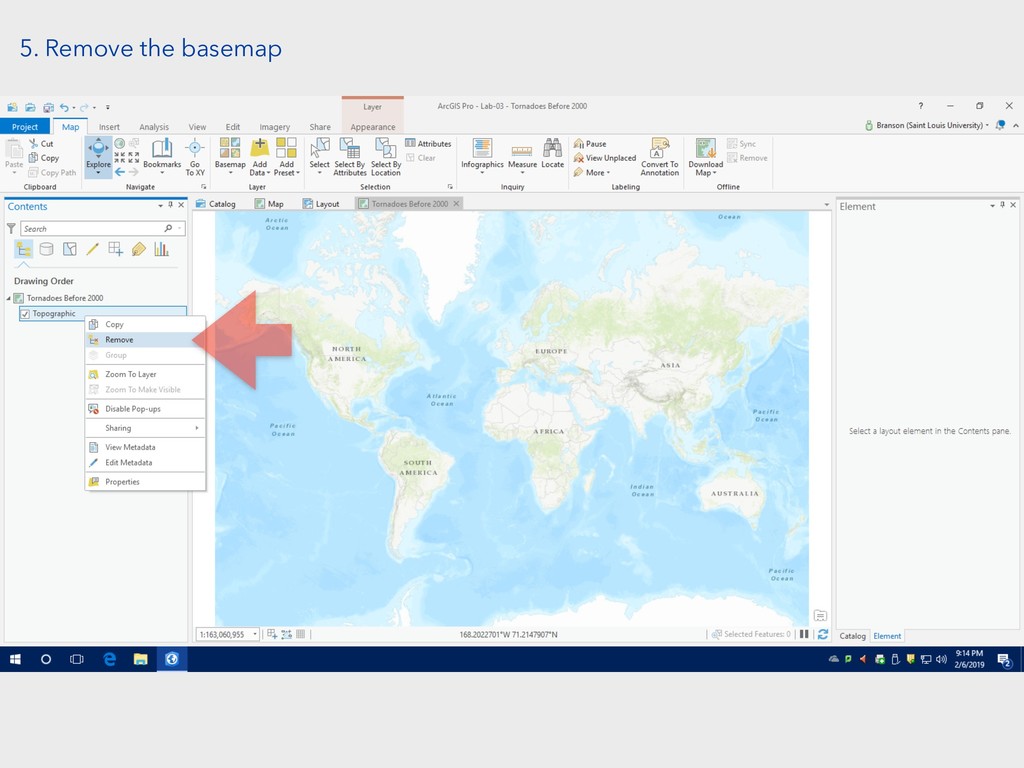
5. Create a new map
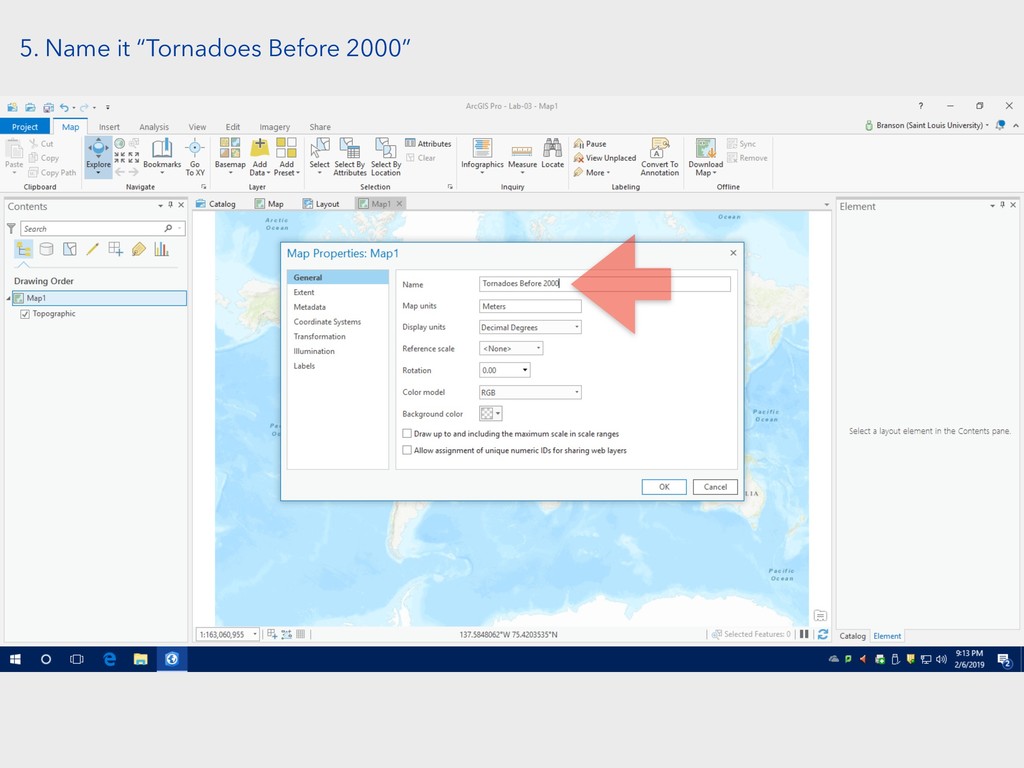
5. Name it “Tornadoes Before 2000”
5. Remove the basemap
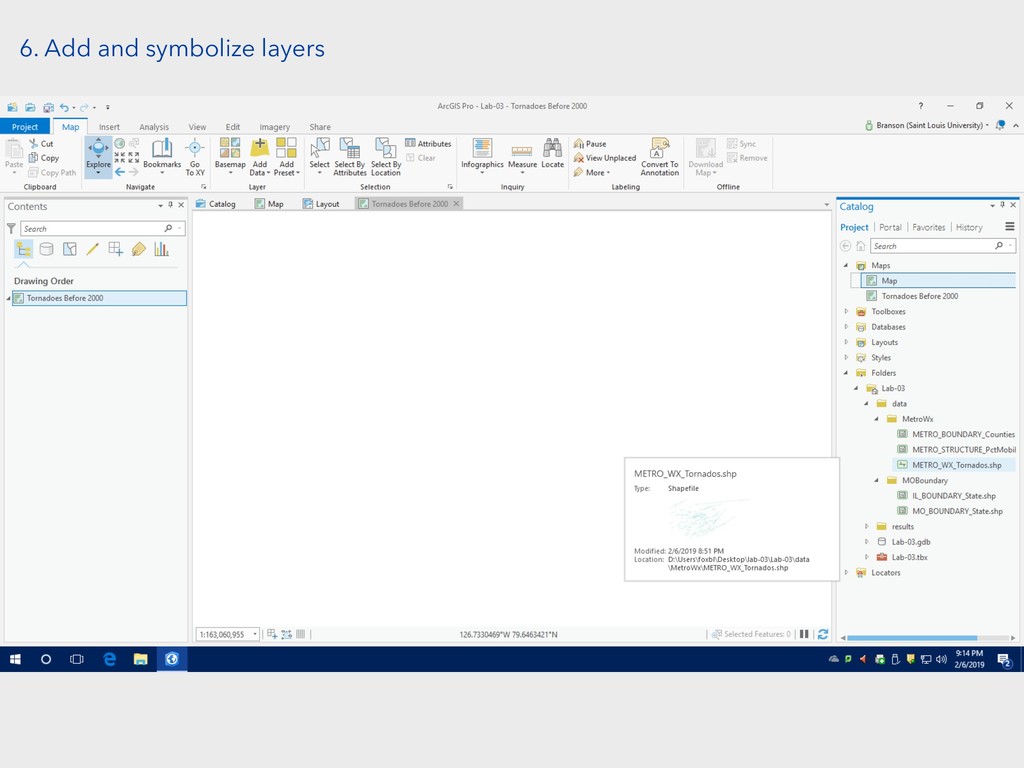
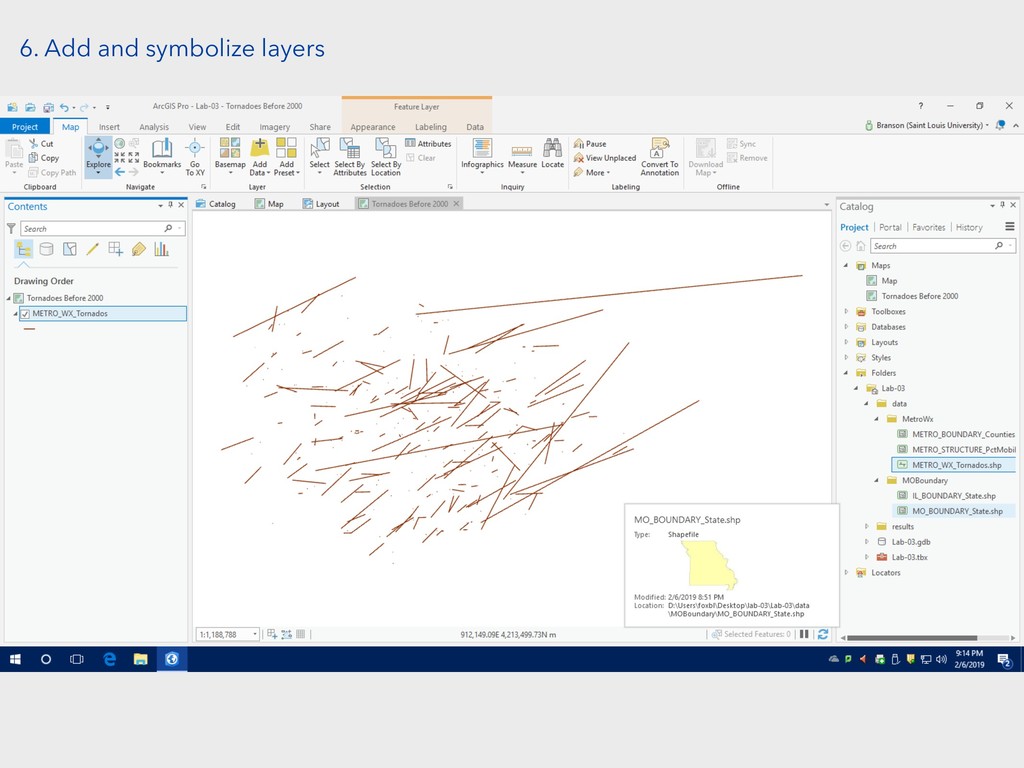
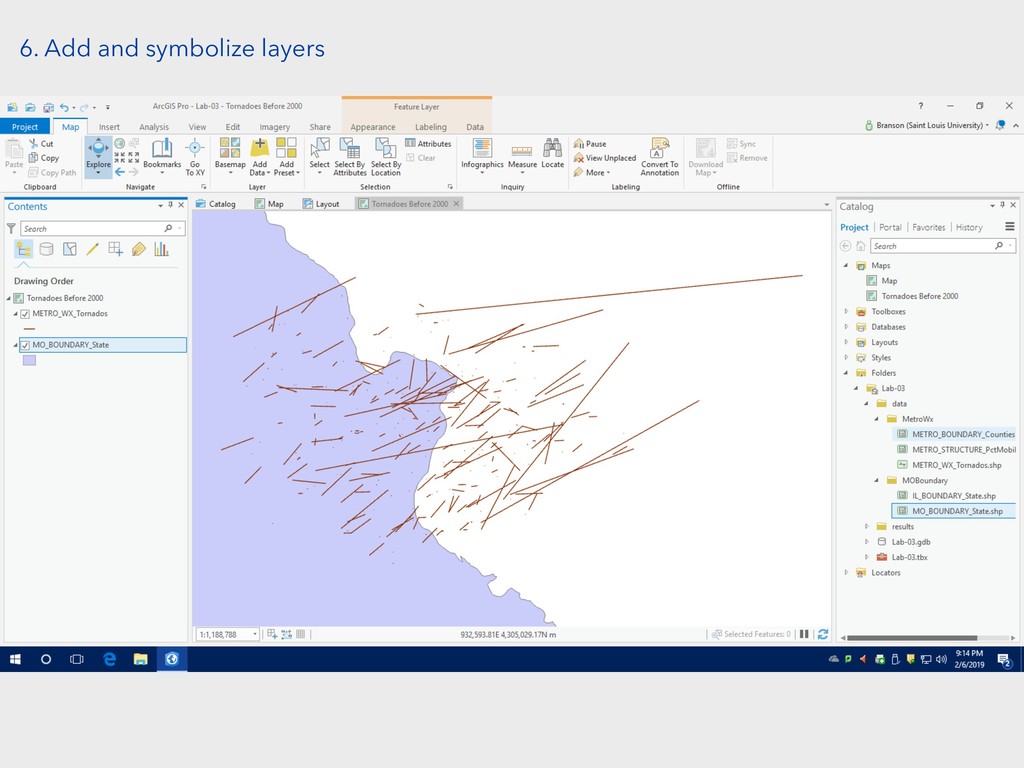
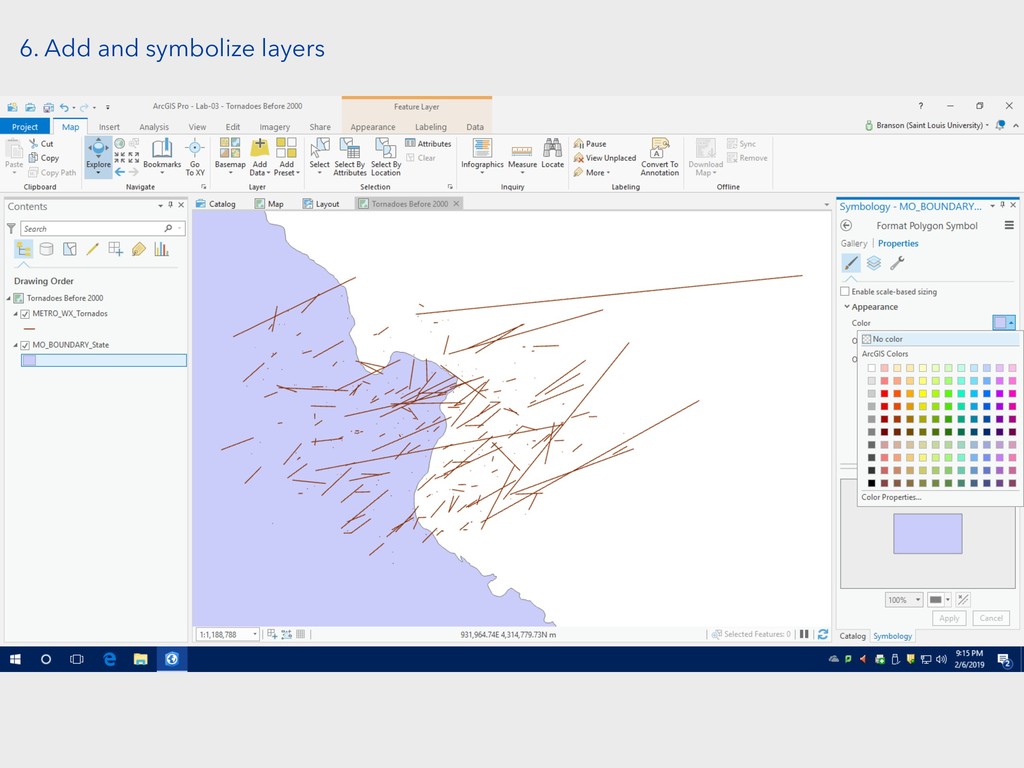
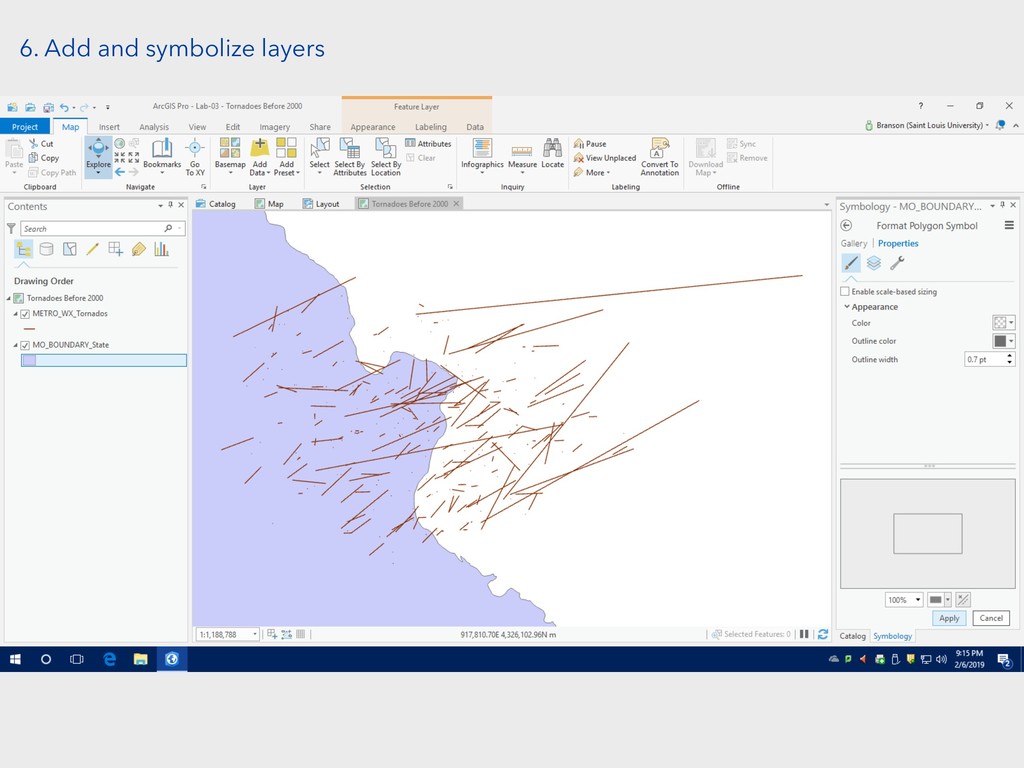
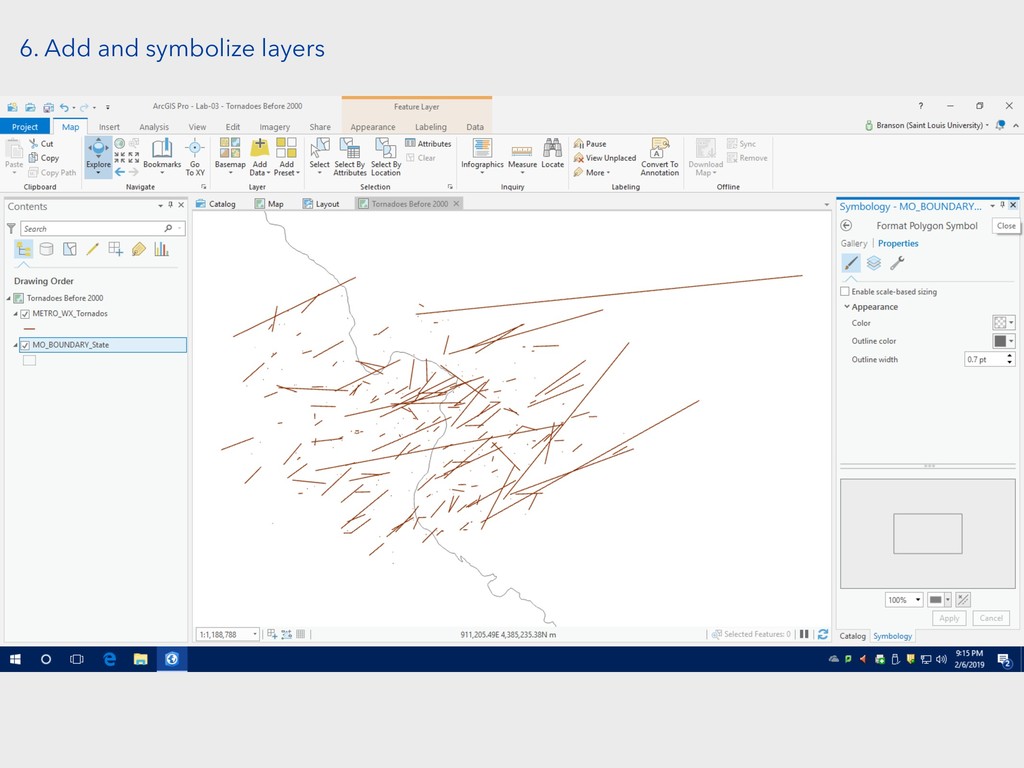
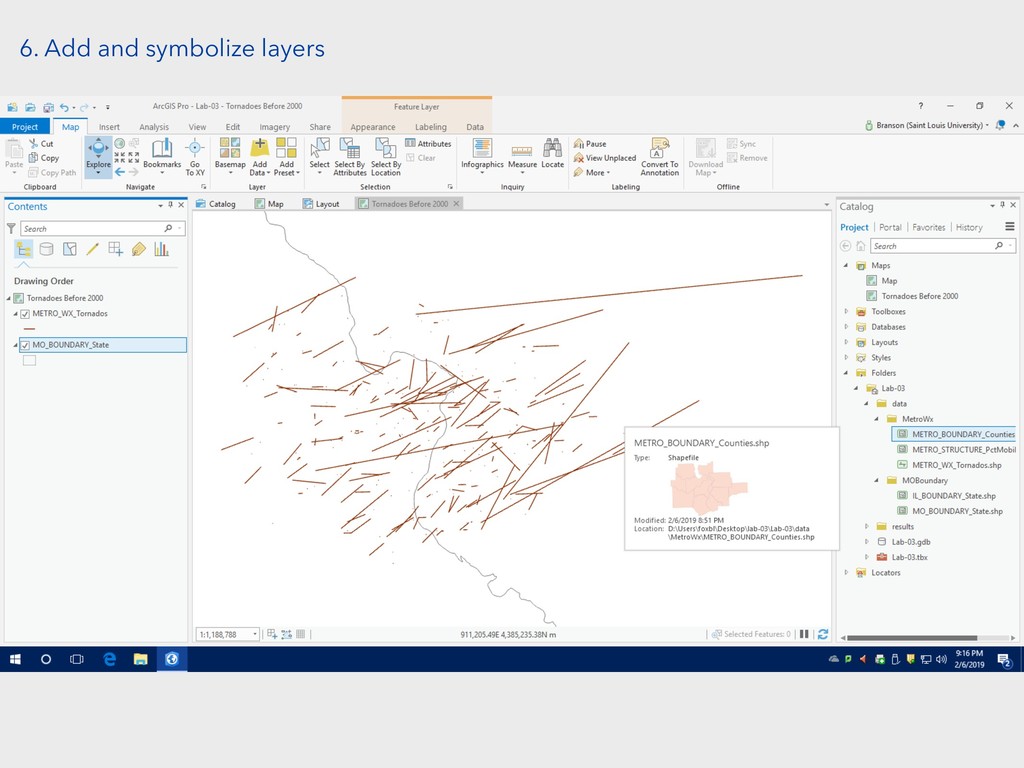
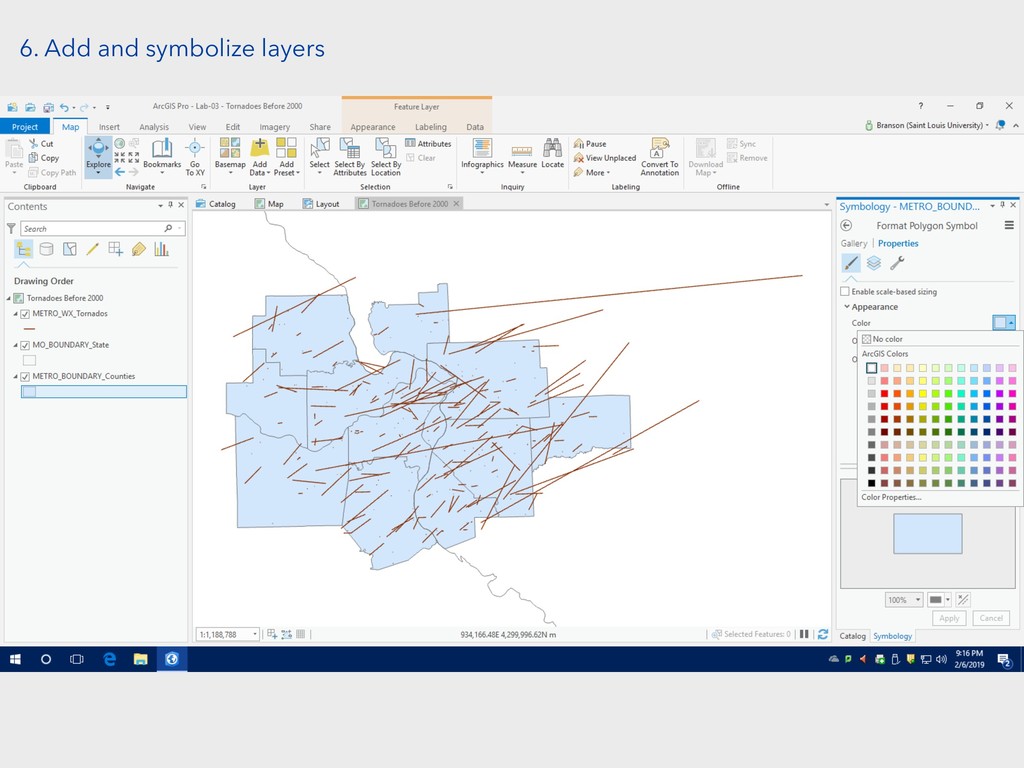
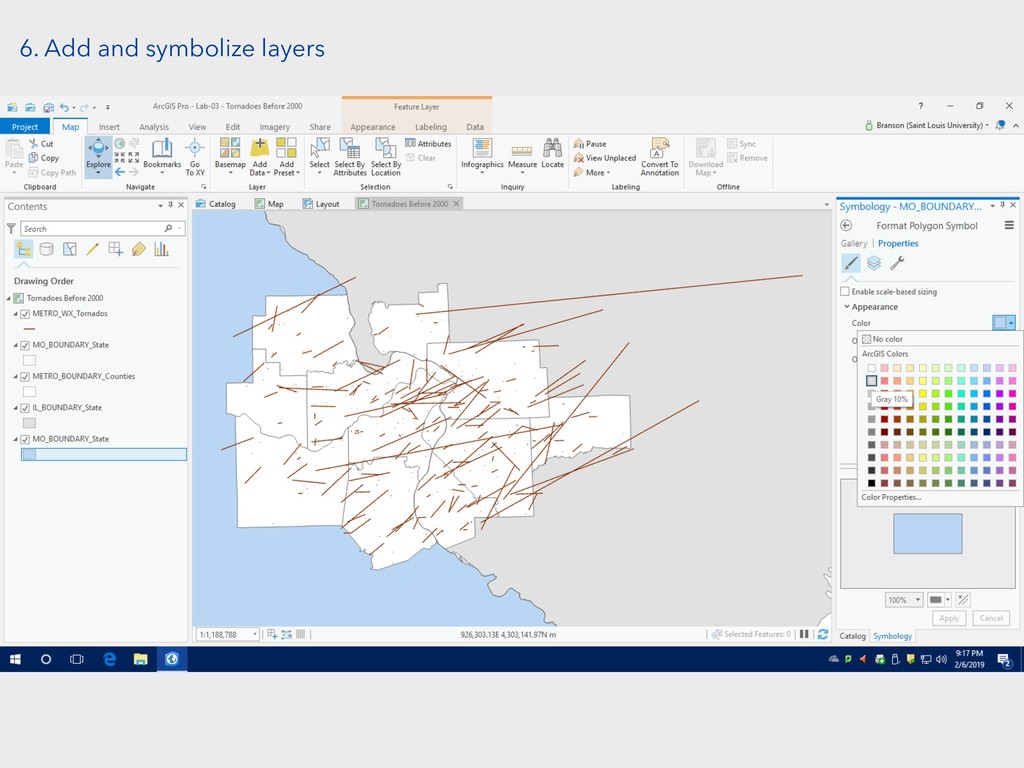
6. Add and symbolize layers
6. Add and symbolize layers
6. Add and symbolize layers
6. Add and symbolize layers
6. Add and symbolize layers
6. Add and symbolize layers
6. Add and symbolize layers
6. Add and symbolize layers
6. Add and symbolize layers
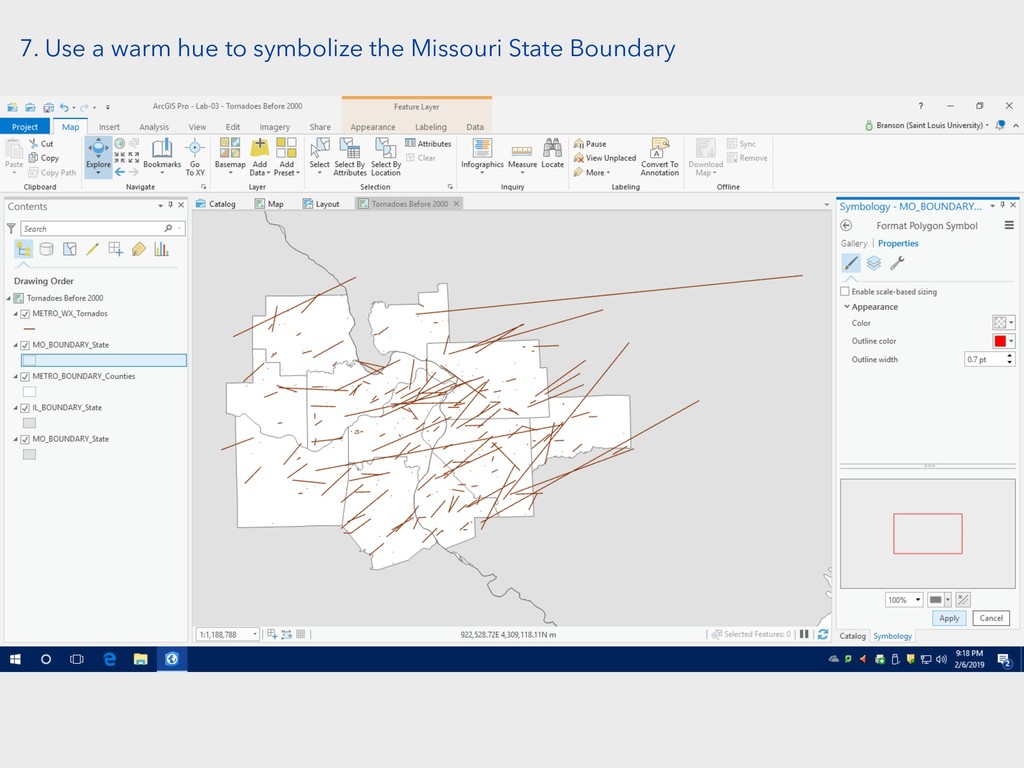
7. Use a warm hue to symbolize the Missouri State
Boundary
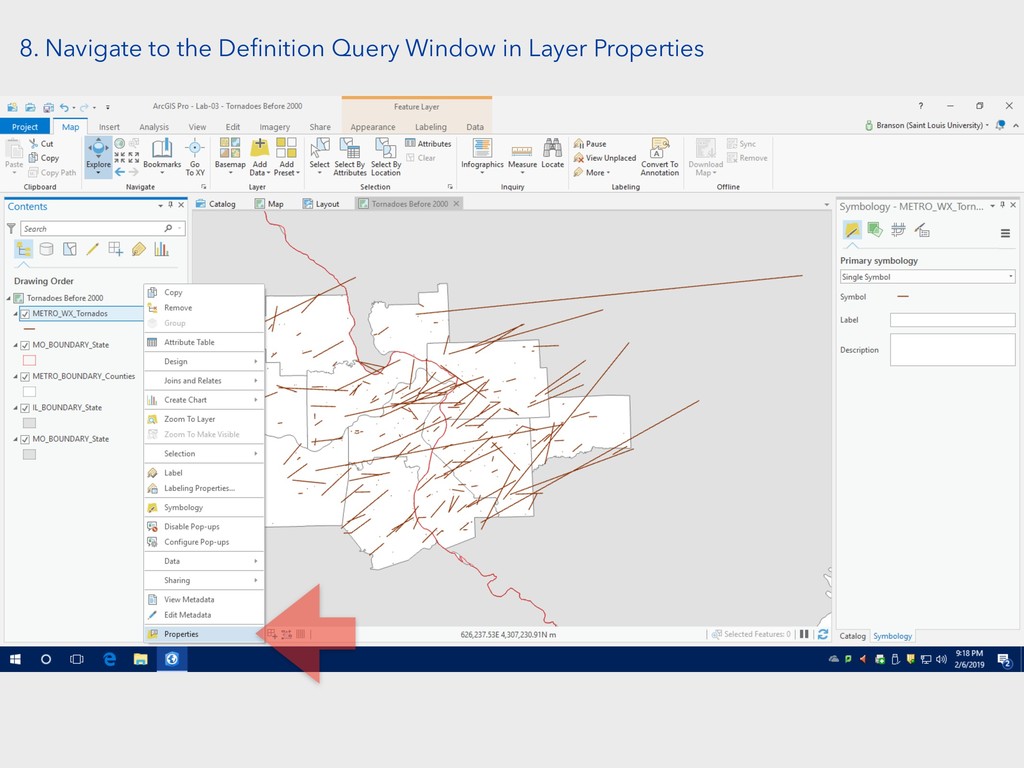
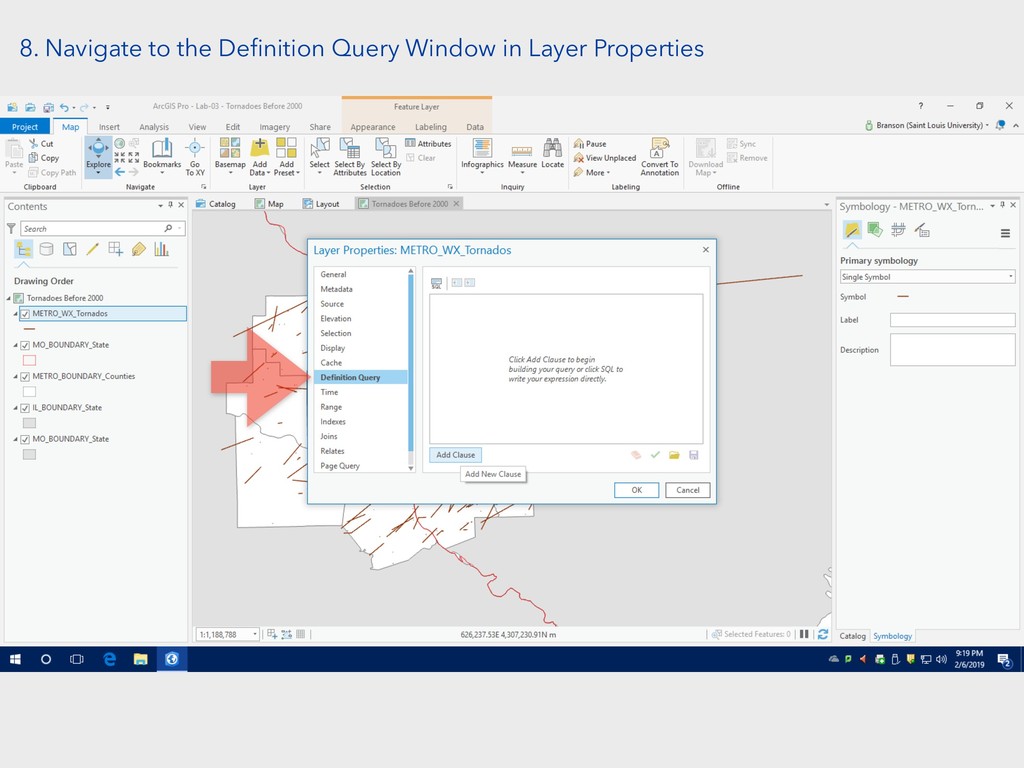
8. Navigate to the Definition Query Window in Layer Properties
8. Navigate to the Definition Query Window in Layer Properties
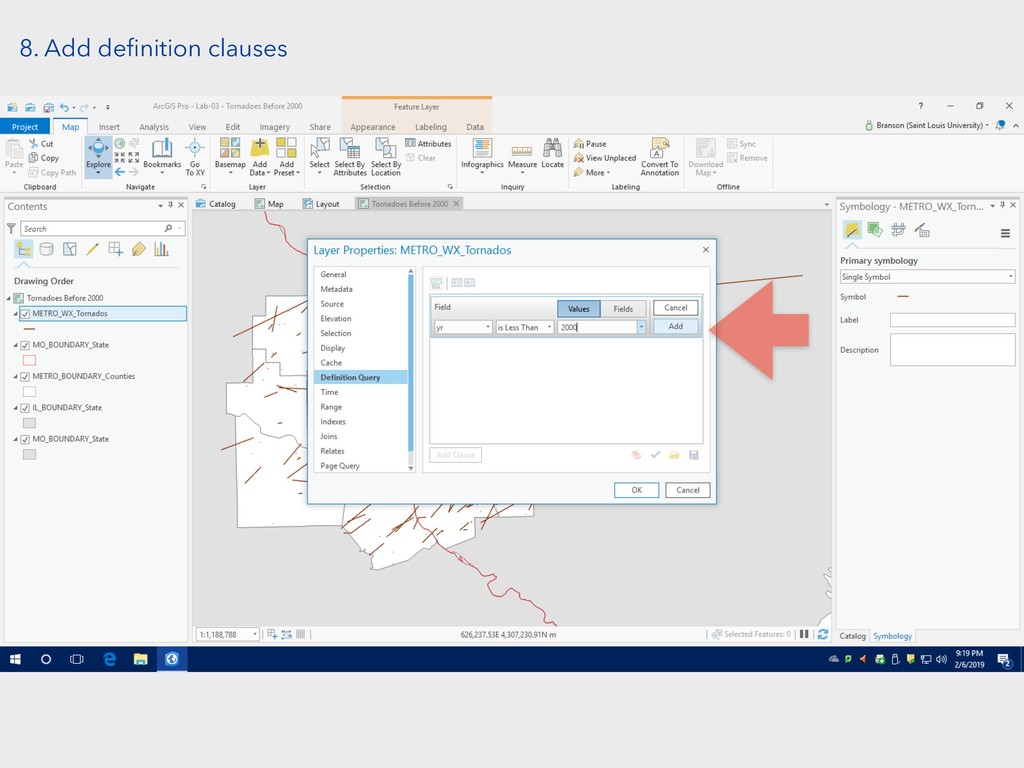
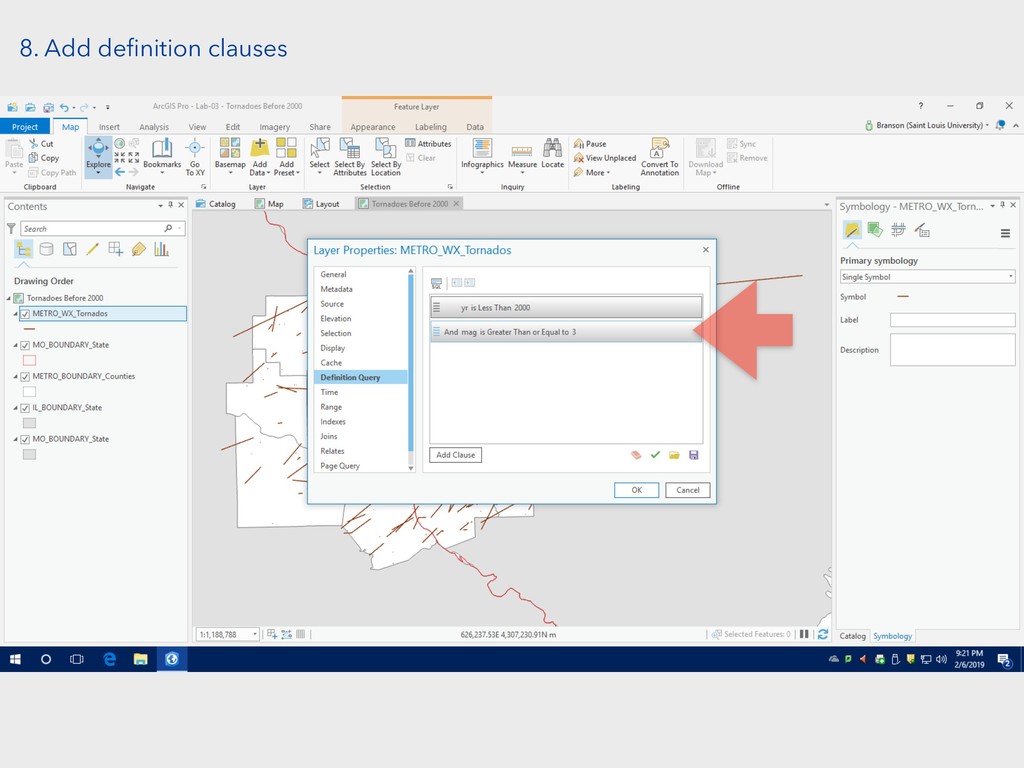
8. Add definition clauses
8. Add definition clauses
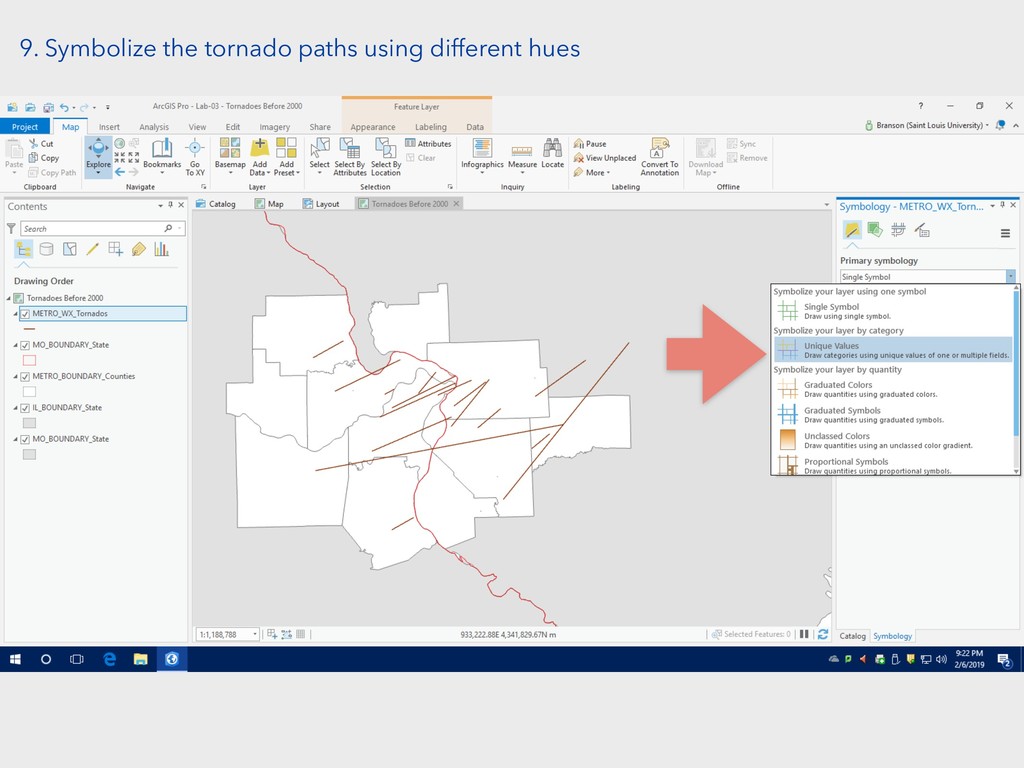
9. Symbolize the tornado paths using different hues
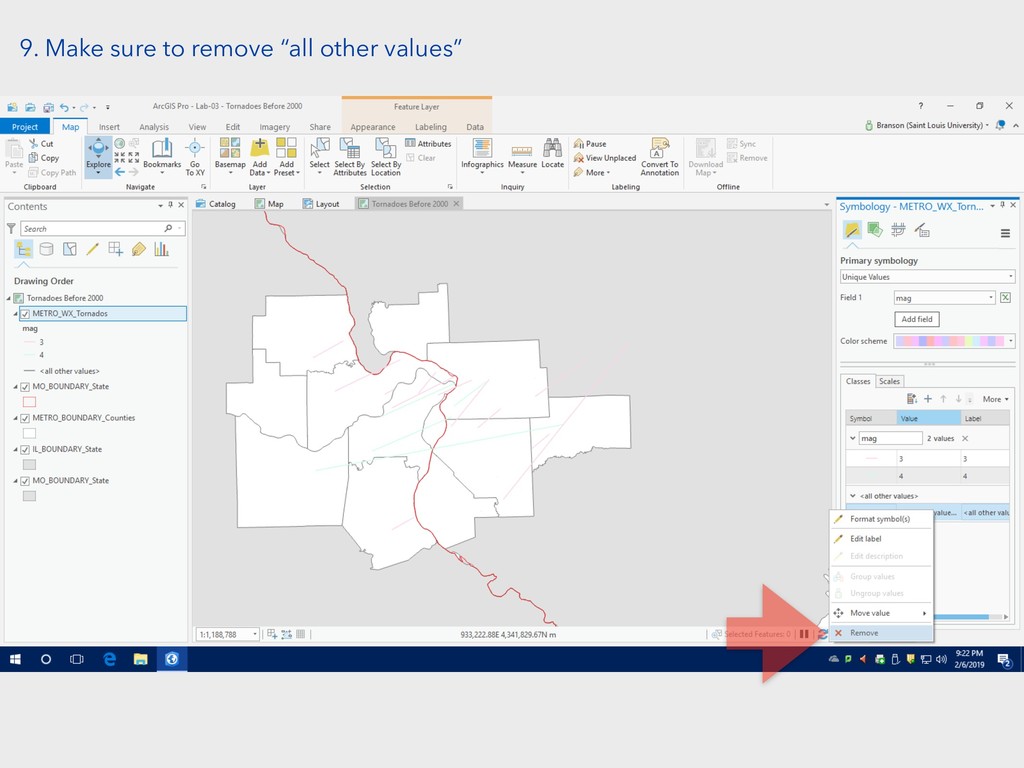
9. Make sure to remove “all other values”
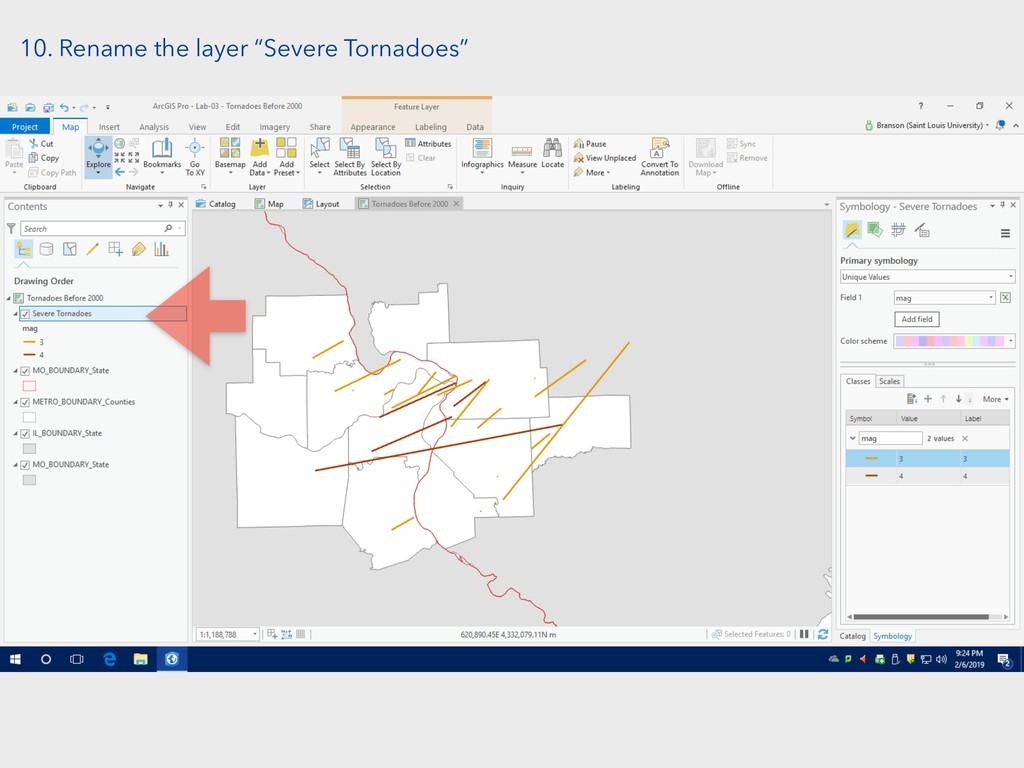
10. Rename the layer “Severe Tornadoes”
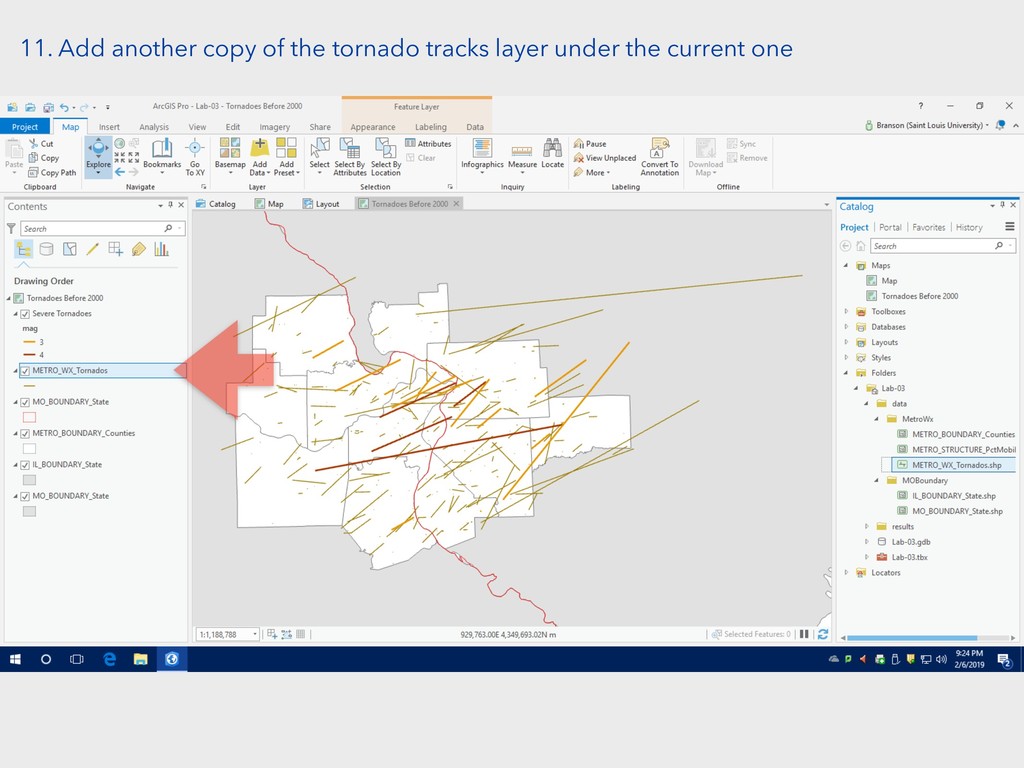
11. Add another copy of the tornado tracks layer under
the current one
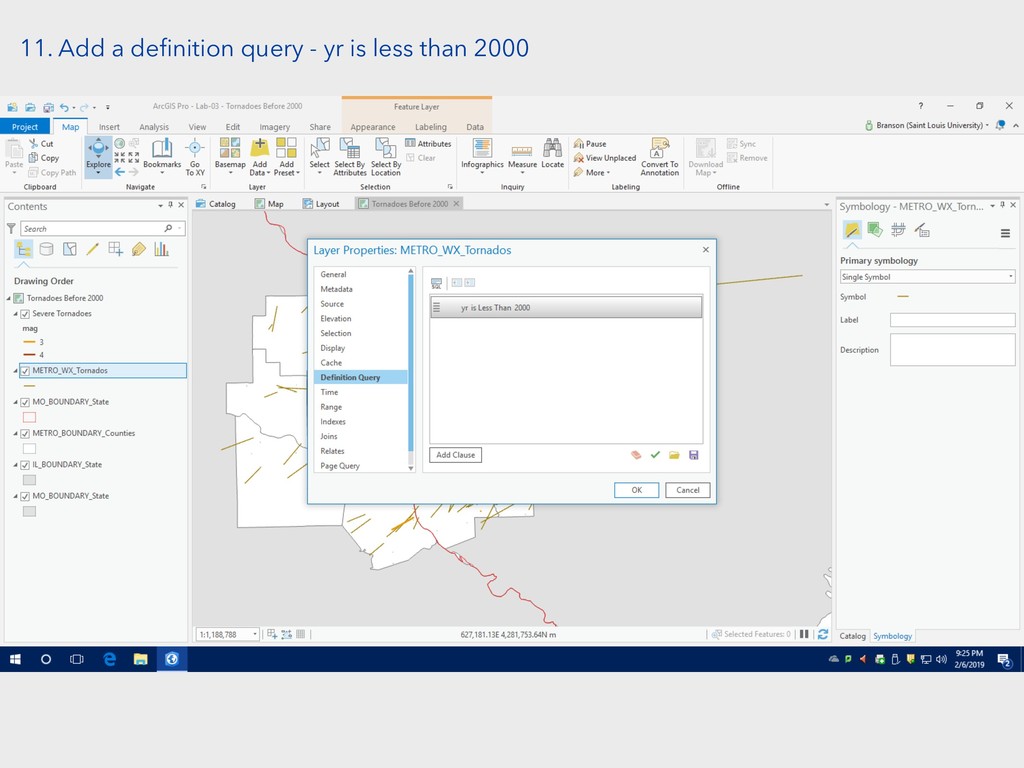
11. Add a definition query - yr is less than
2000
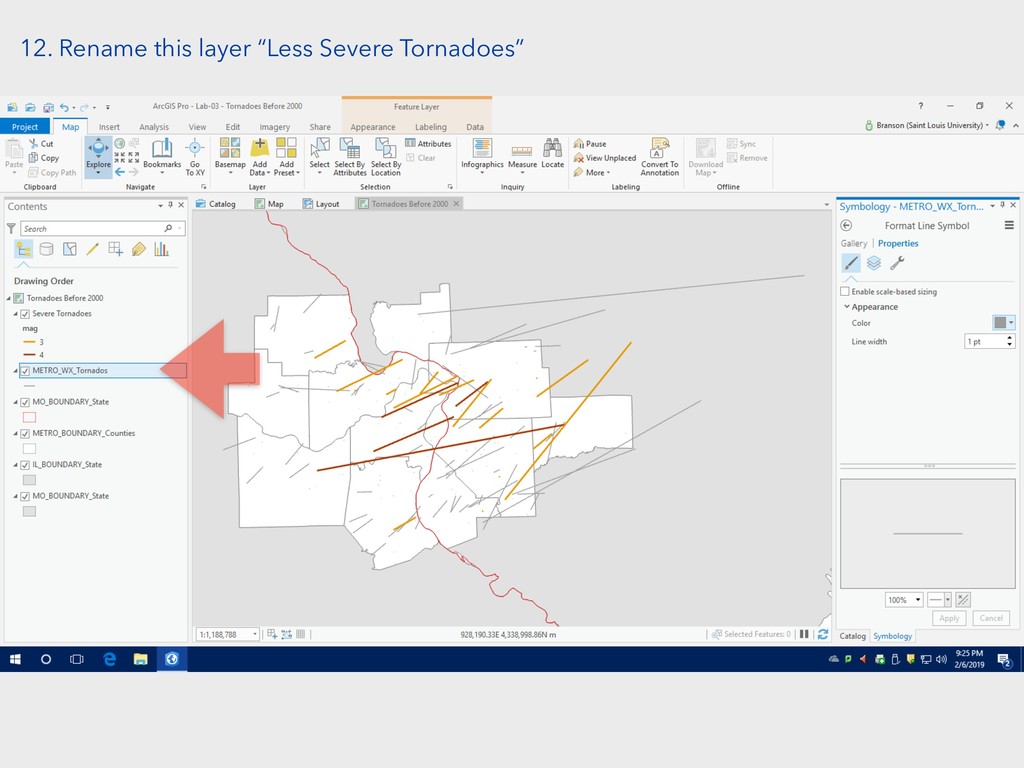
12. Rename this layer “Less Severe Tornadoes”
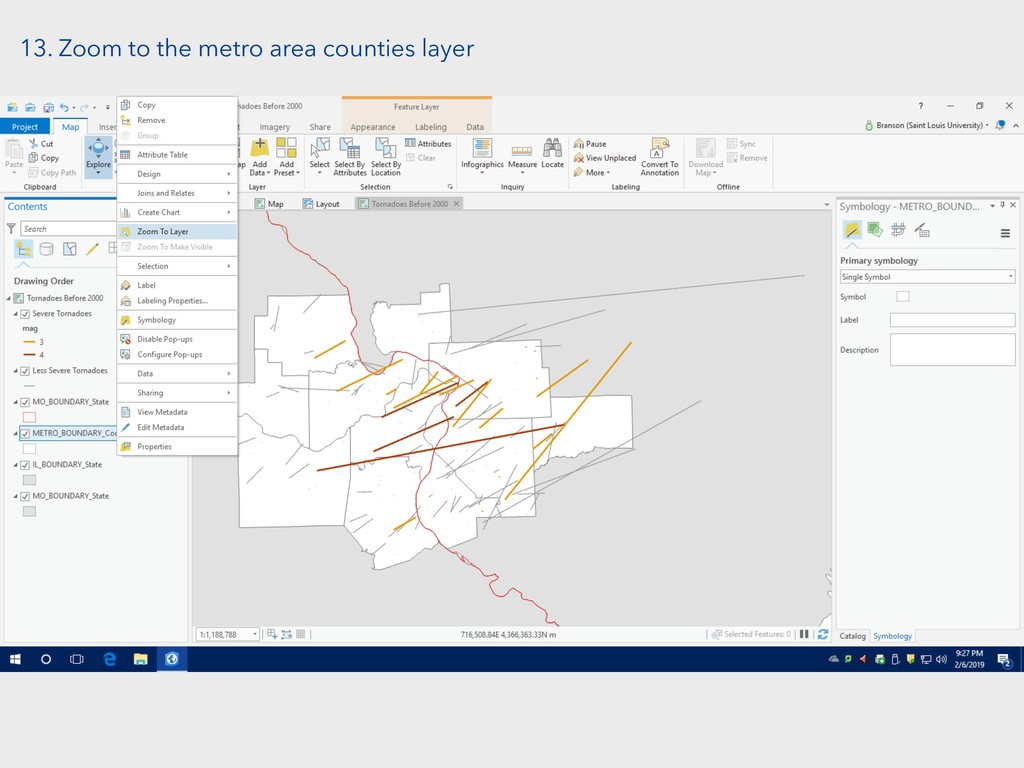
13. Zoom to the metro area counties layer
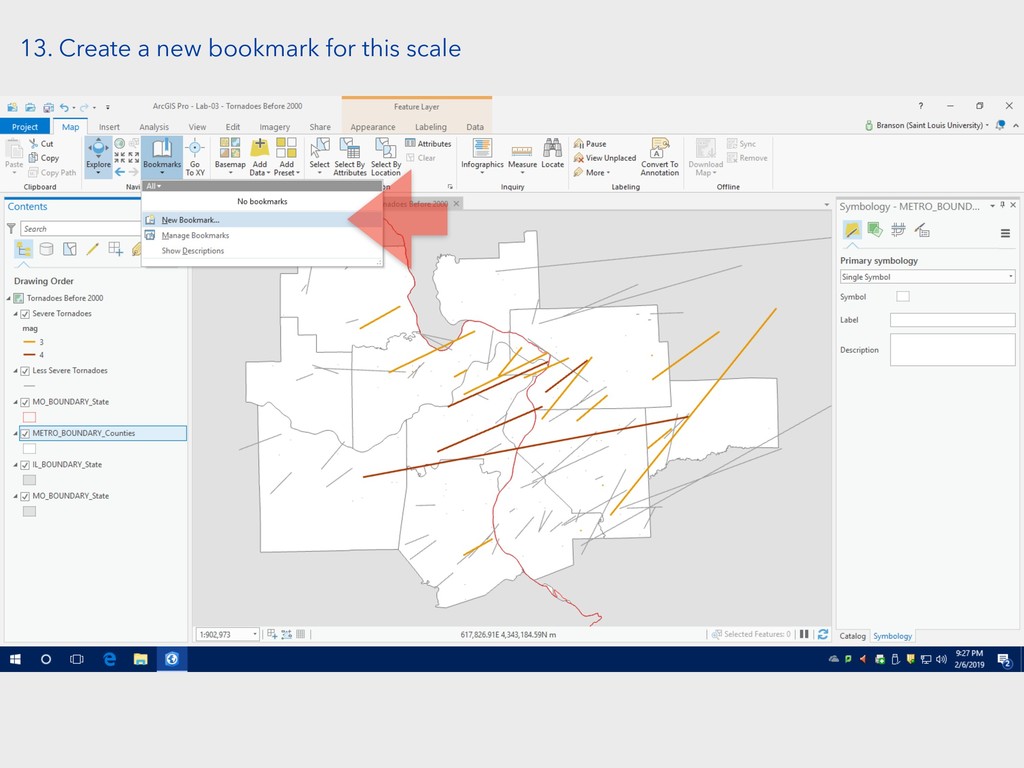
13. Create a new bookmark for this scale
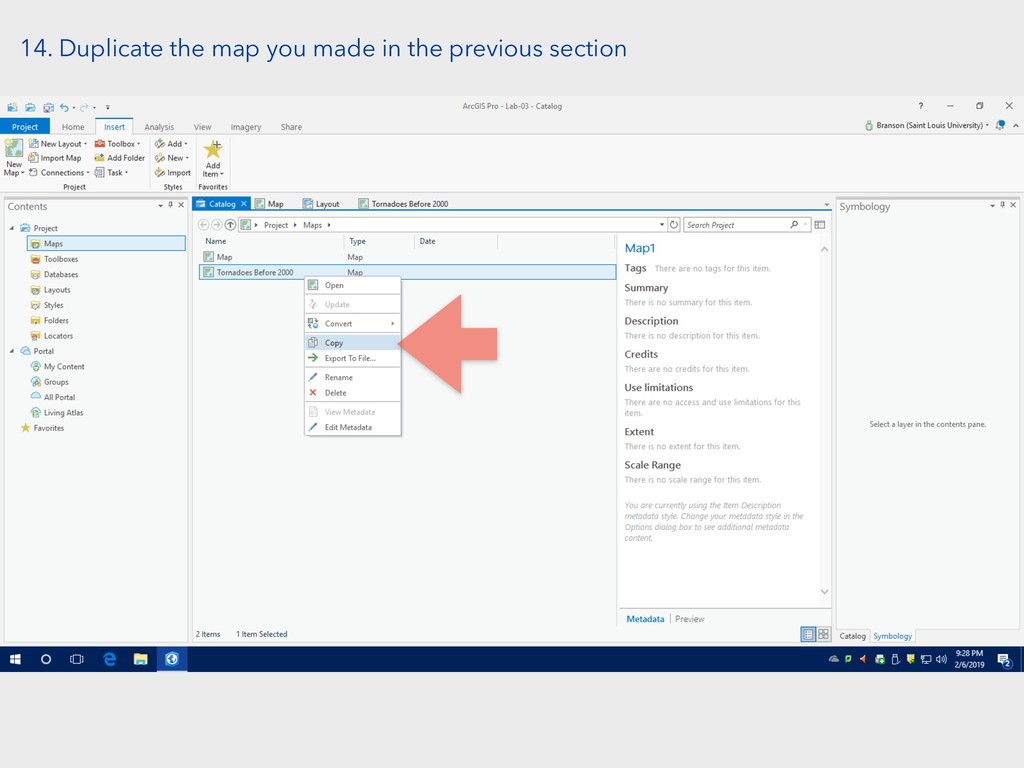
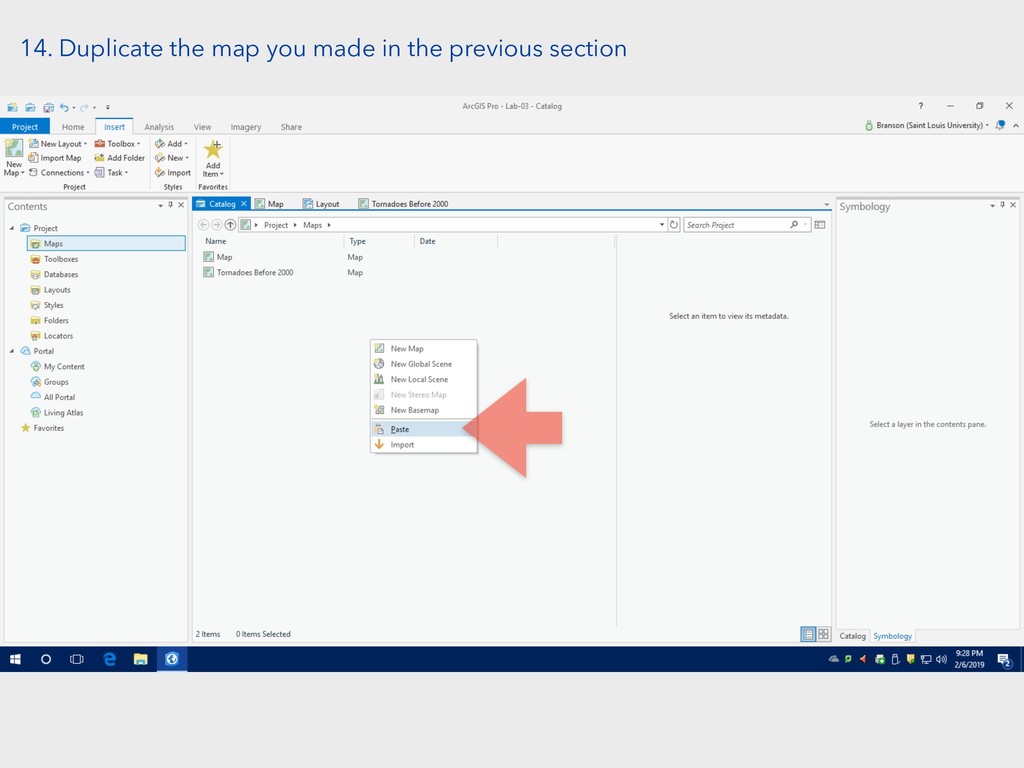
14. Duplicate the map you made in the previous section
14. Duplicate the map you made in the previous section
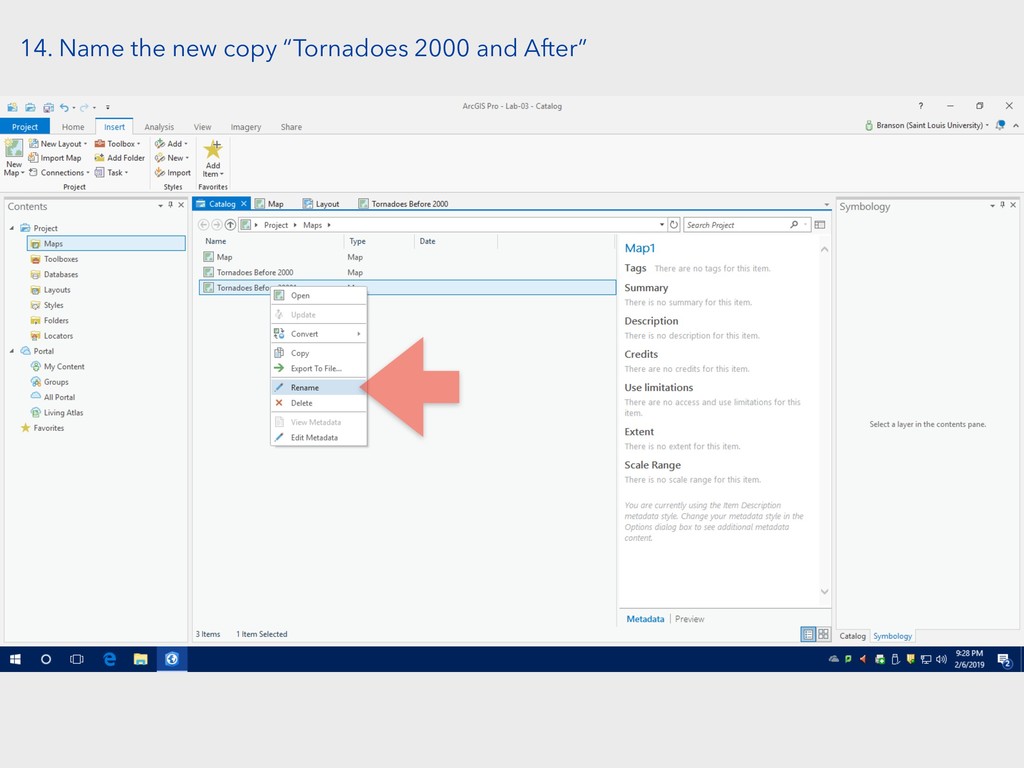
14. Name the new copy “Tornadoes 2000 and After”
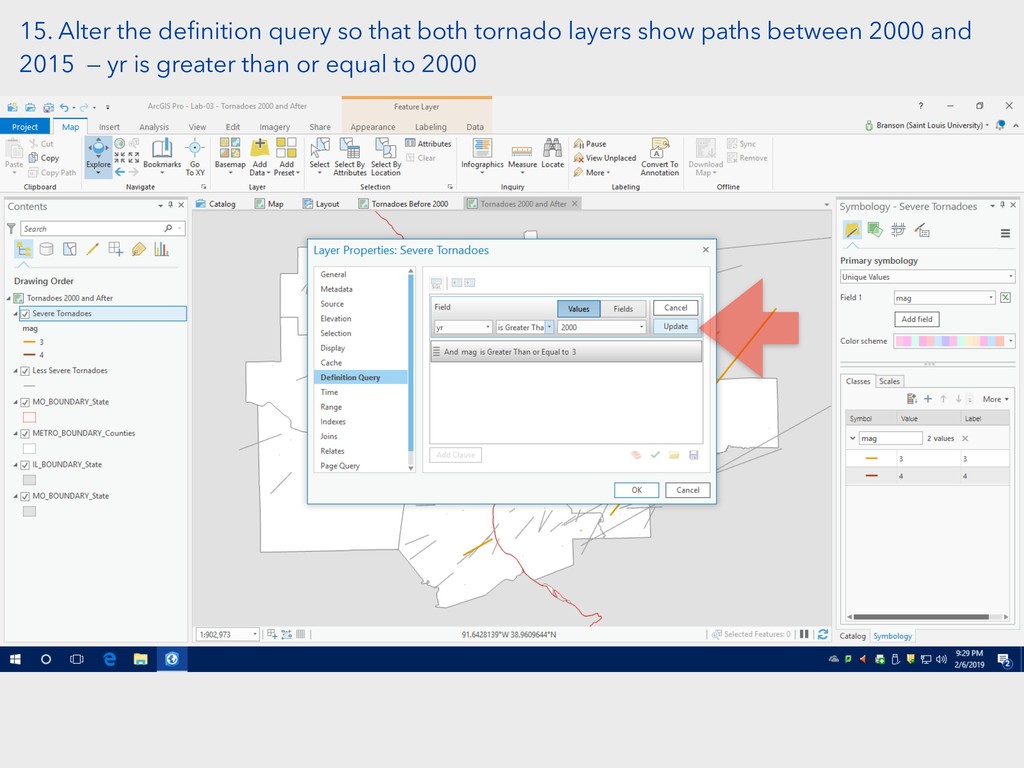
15. Alter the definition query so that both tornado layers
show paths between 2000 and 2015 — yr is greater than or equal to 2000
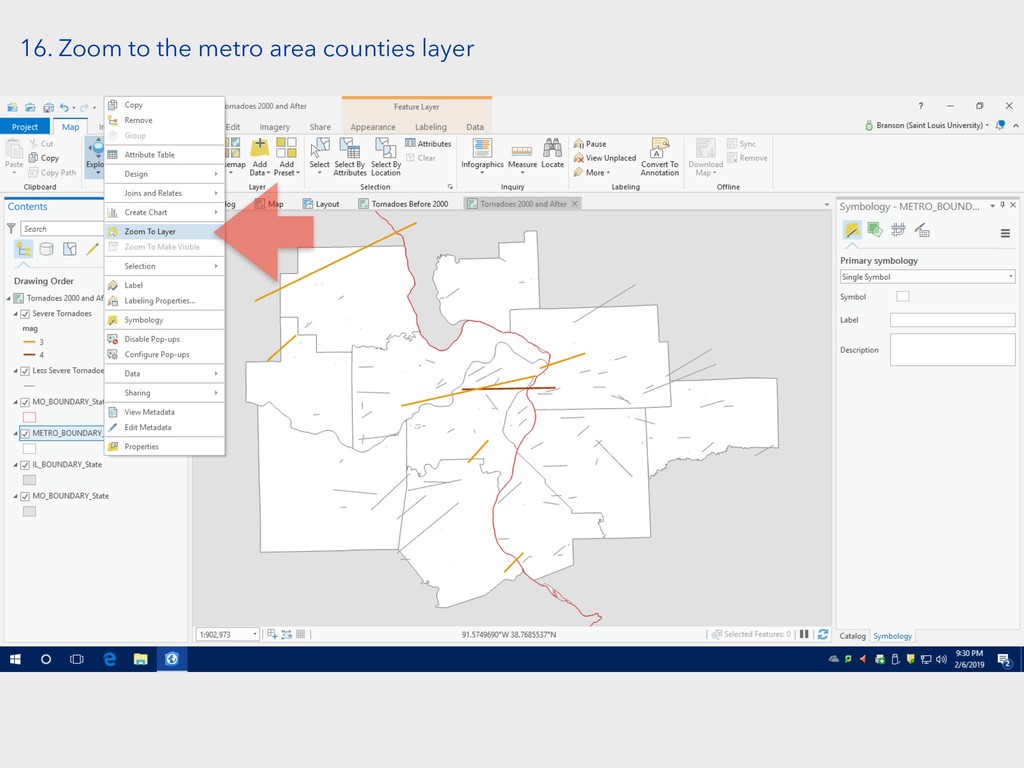
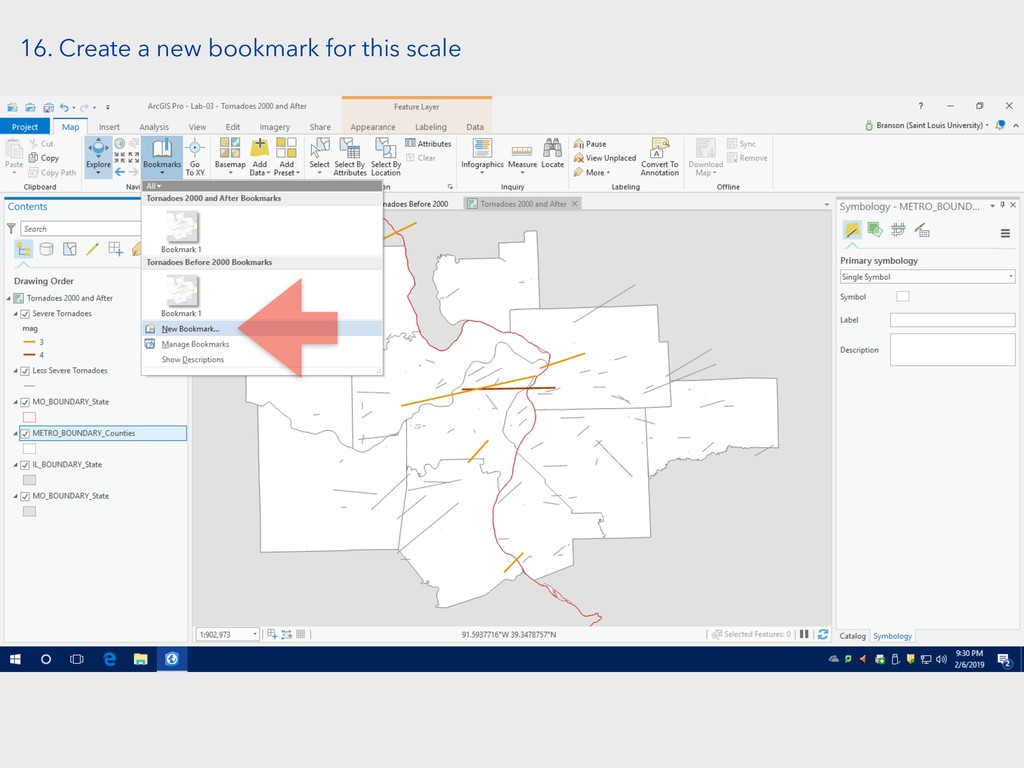
16. Zoom to the metro area counties layer
16. Create a new bookmark for this scale
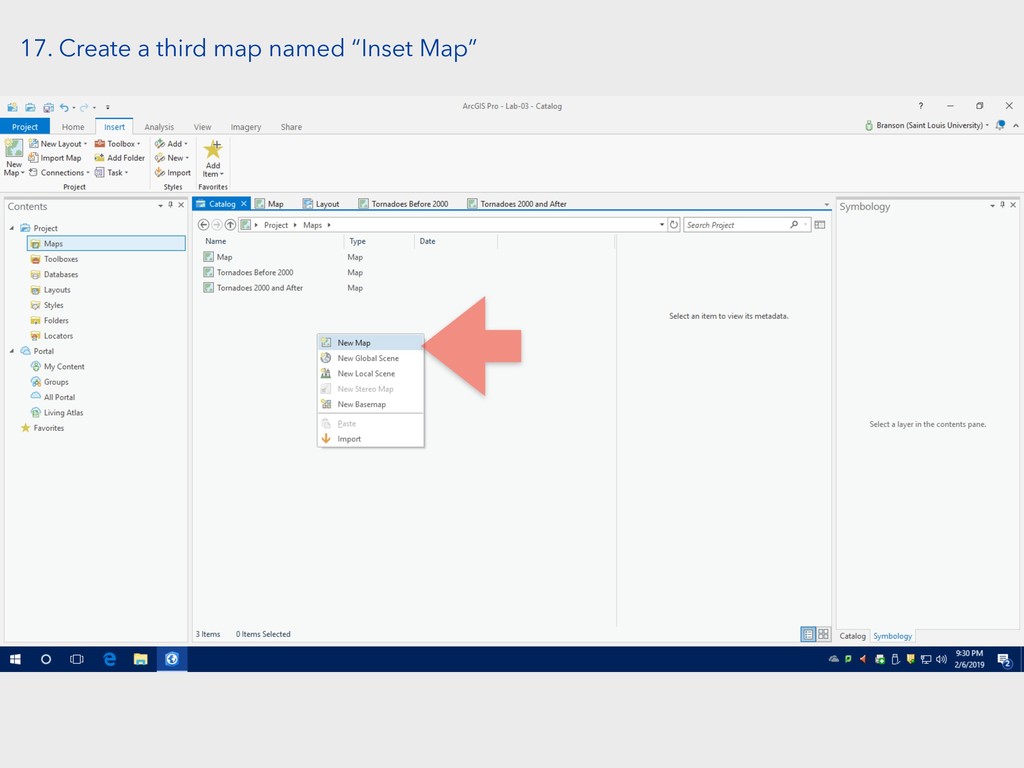
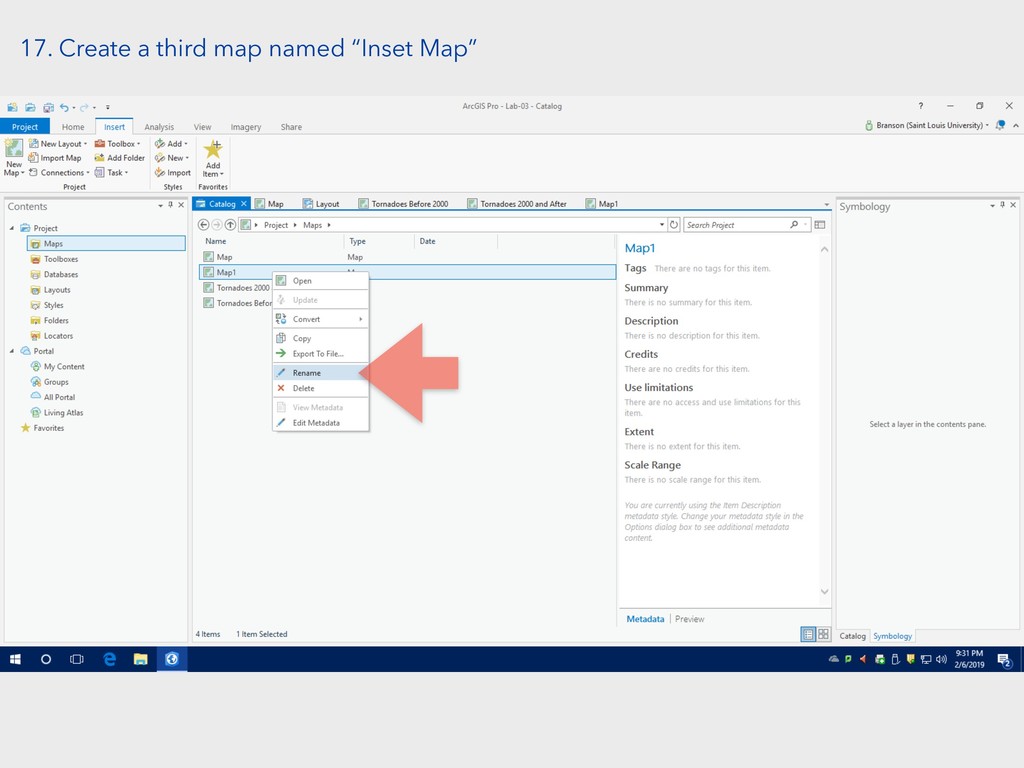
17. Create a third map named “Inset Map”
17. Create a third map named “Inset Map”
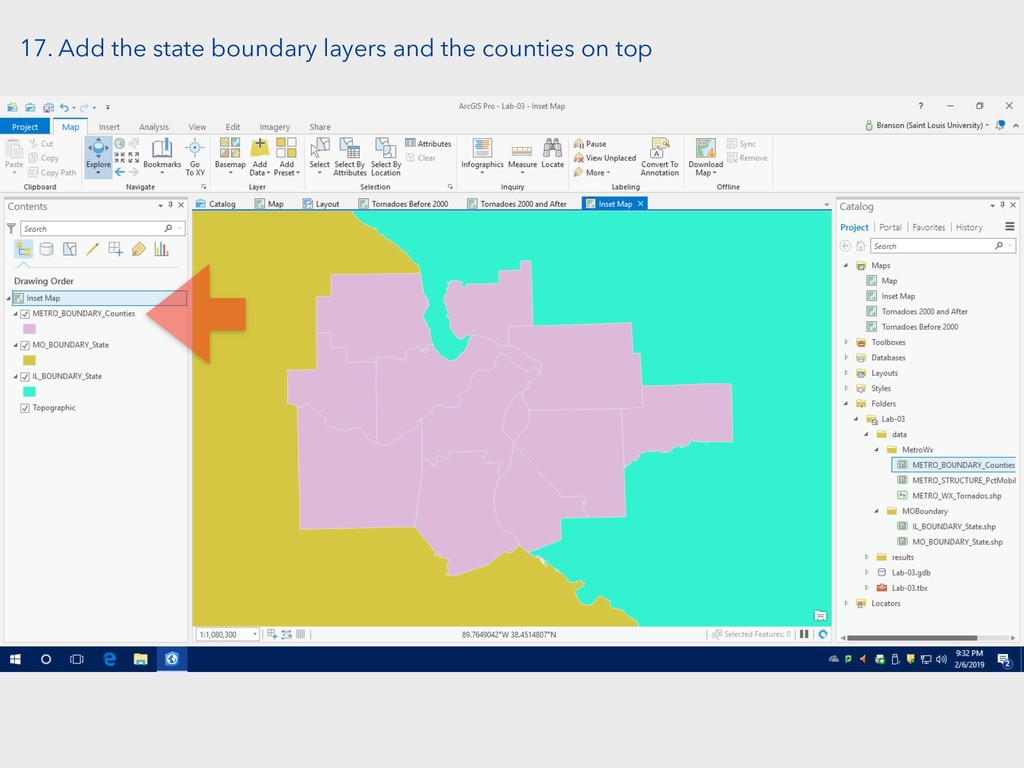
17. Add the state boundary layers and the counties on
top
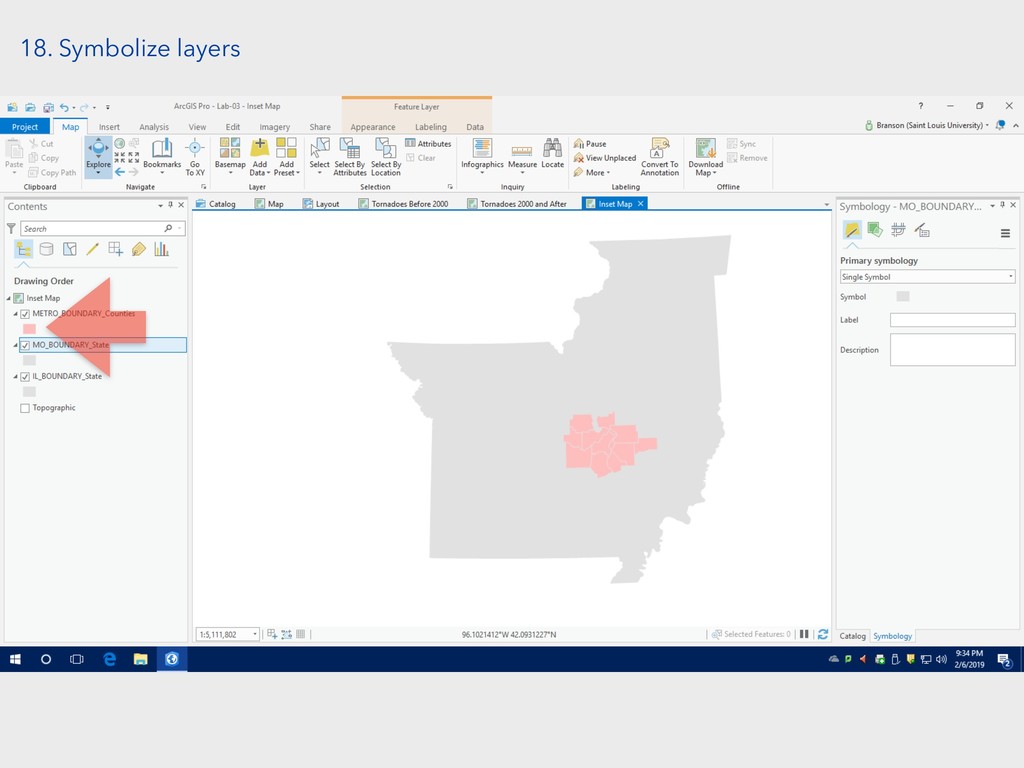
18. Symbolize layers
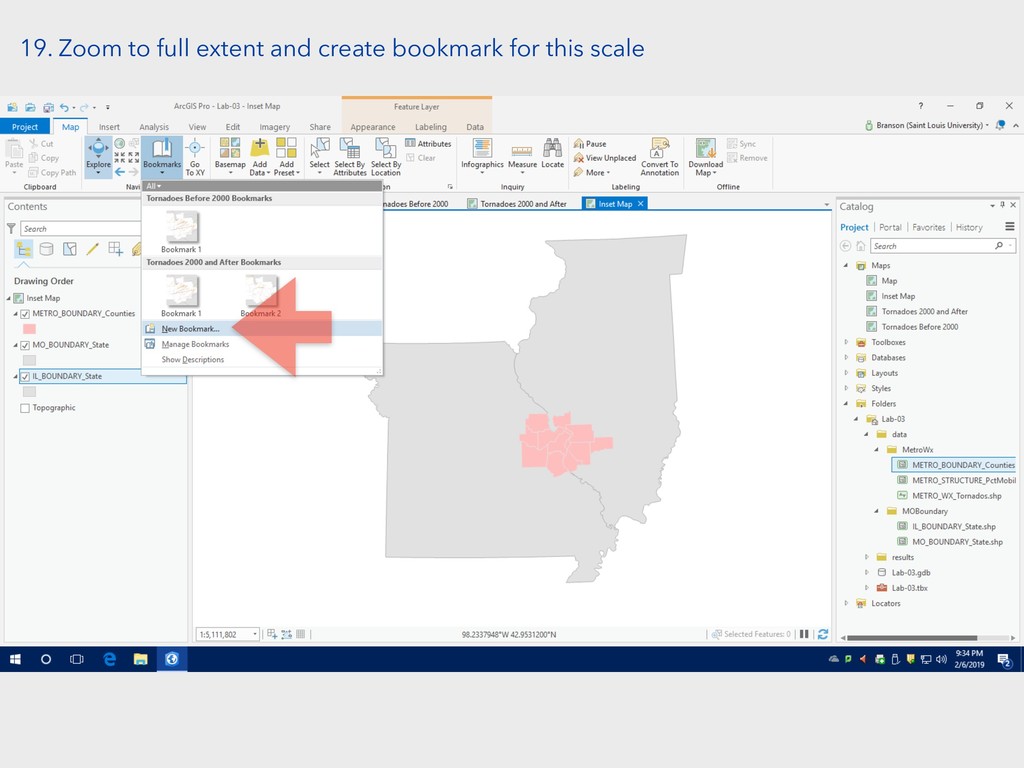
19. Zoom to full extent and create bookmark for this
scale
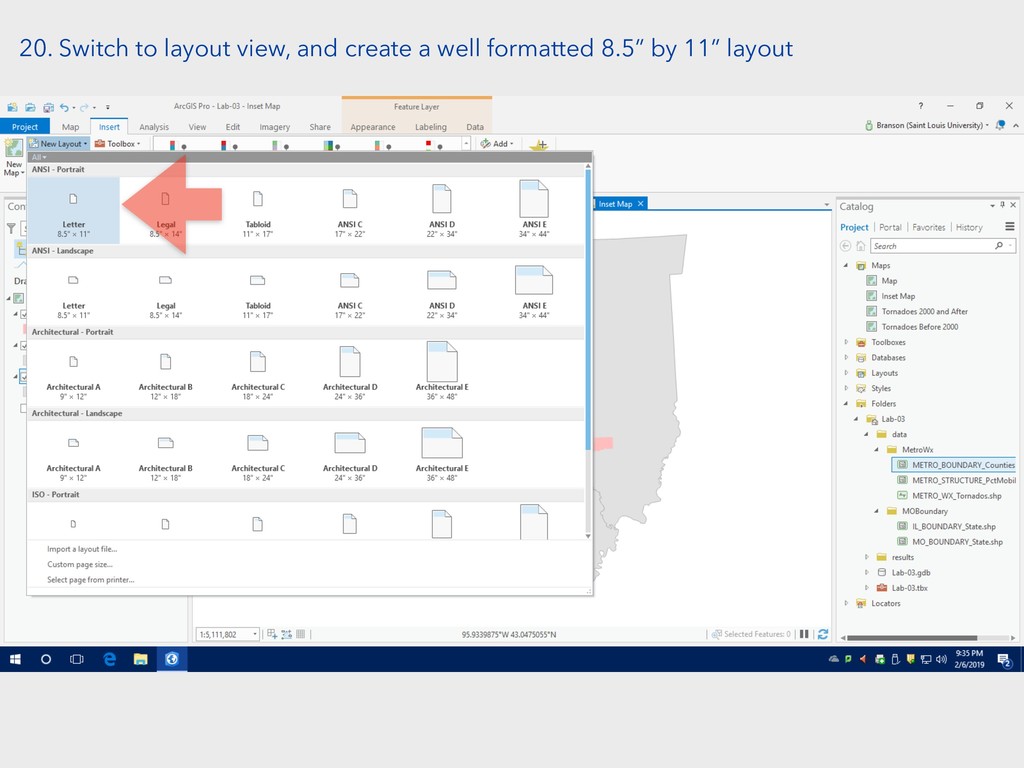
20. Switch to layout view, and create a well formatted
8.5” by 11” layout
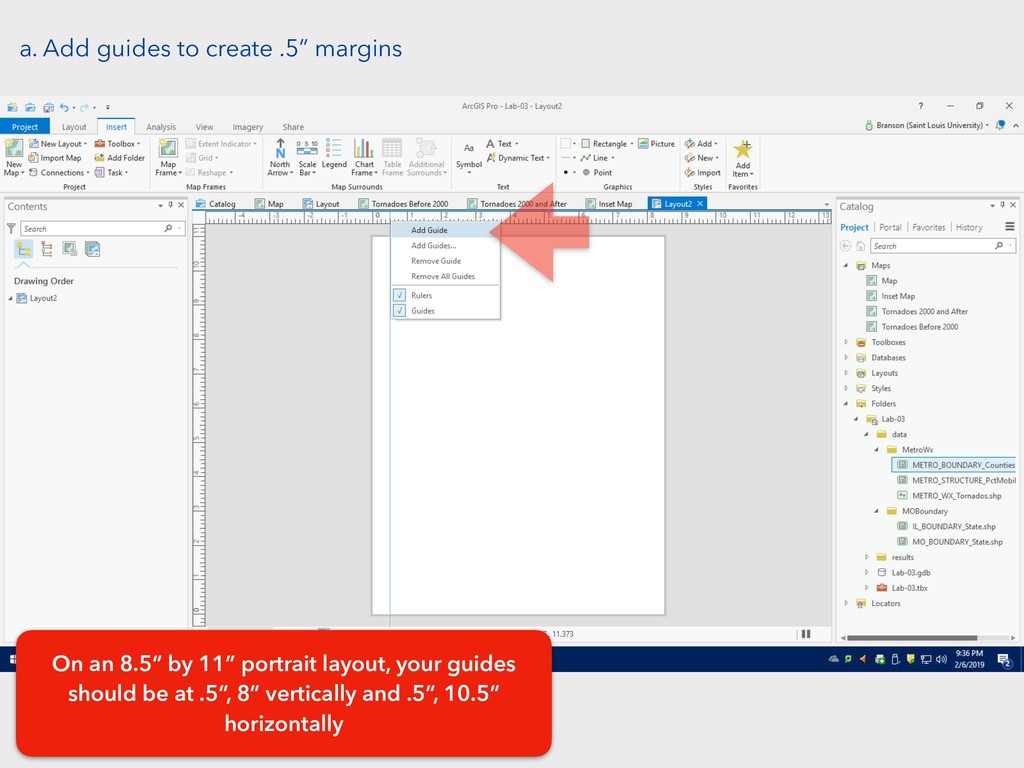
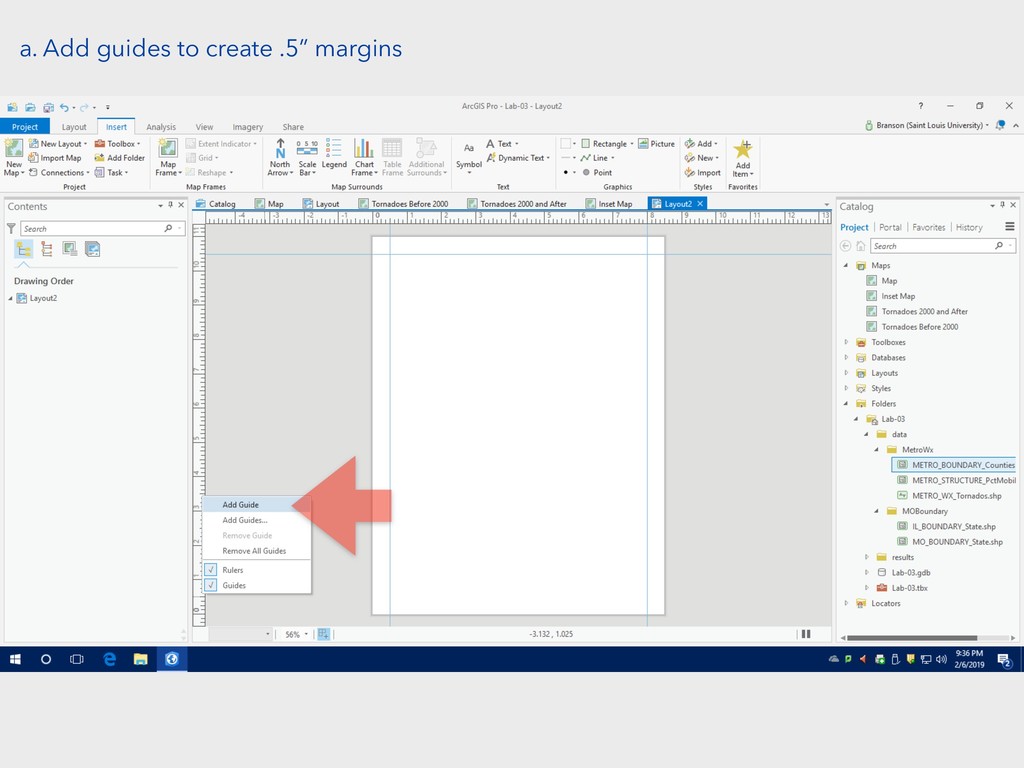
a. Add guides to create .5” margins On an 8.5”
by 11” portrait layout, your guides should be at .5”, 8” vertically and .5”, 10.5” horizontally
a. Add guides to create .5” margins
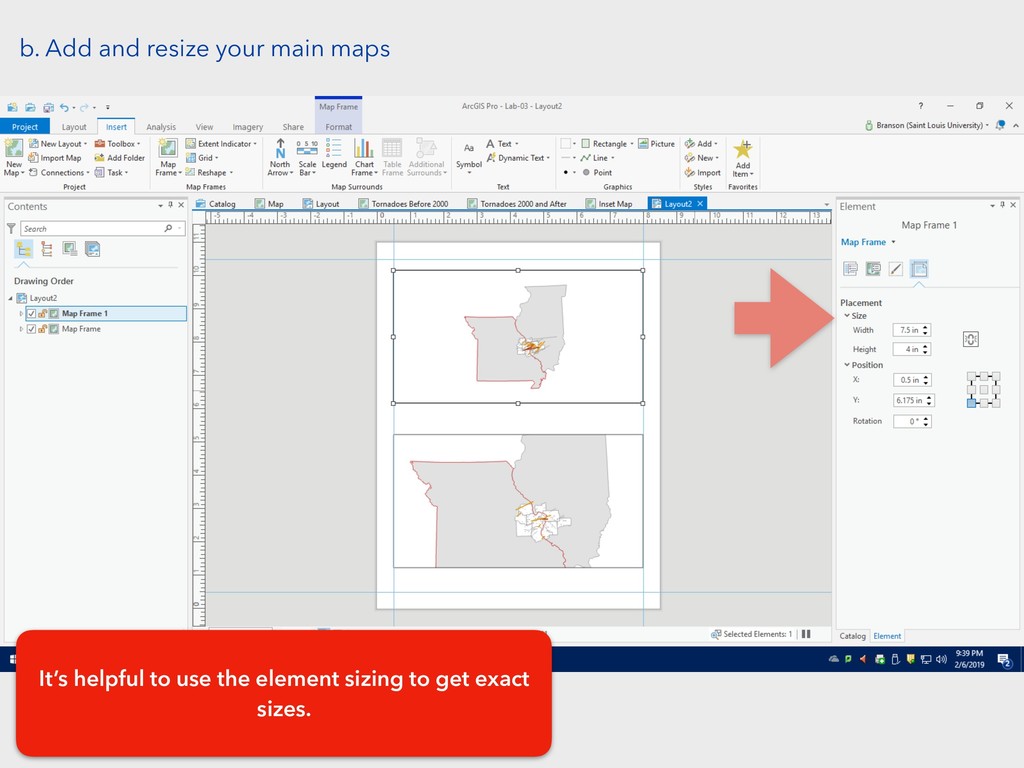
b. Add and resize your main maps It’s helpful to
use the element sizing to get exact sizes.
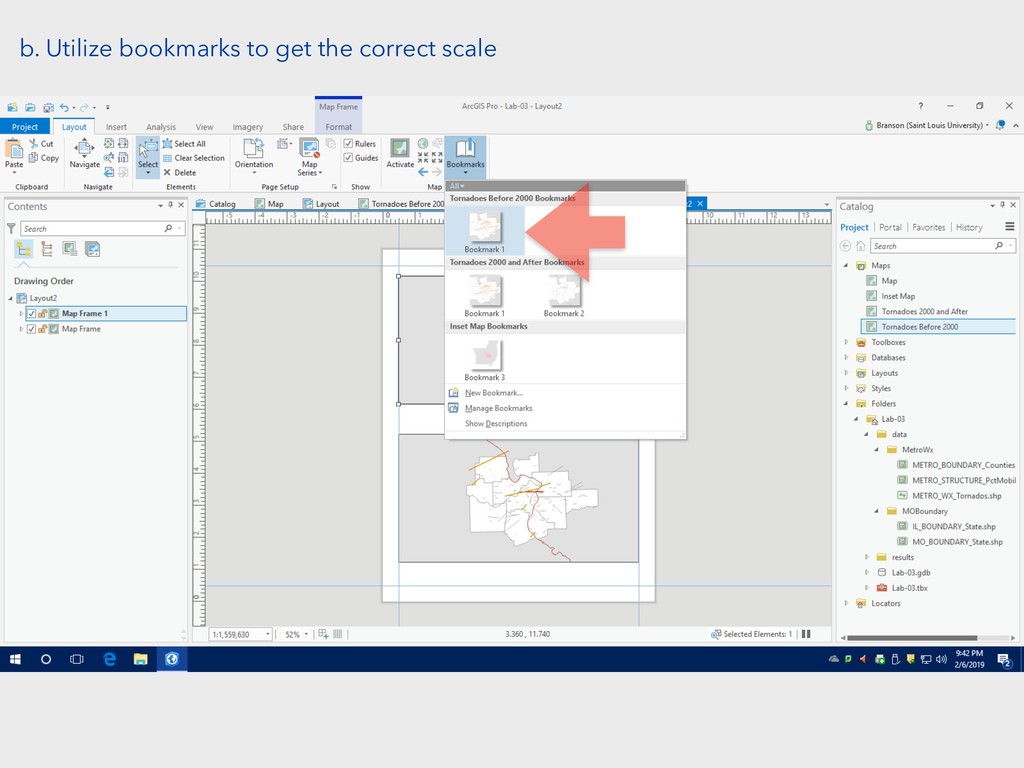
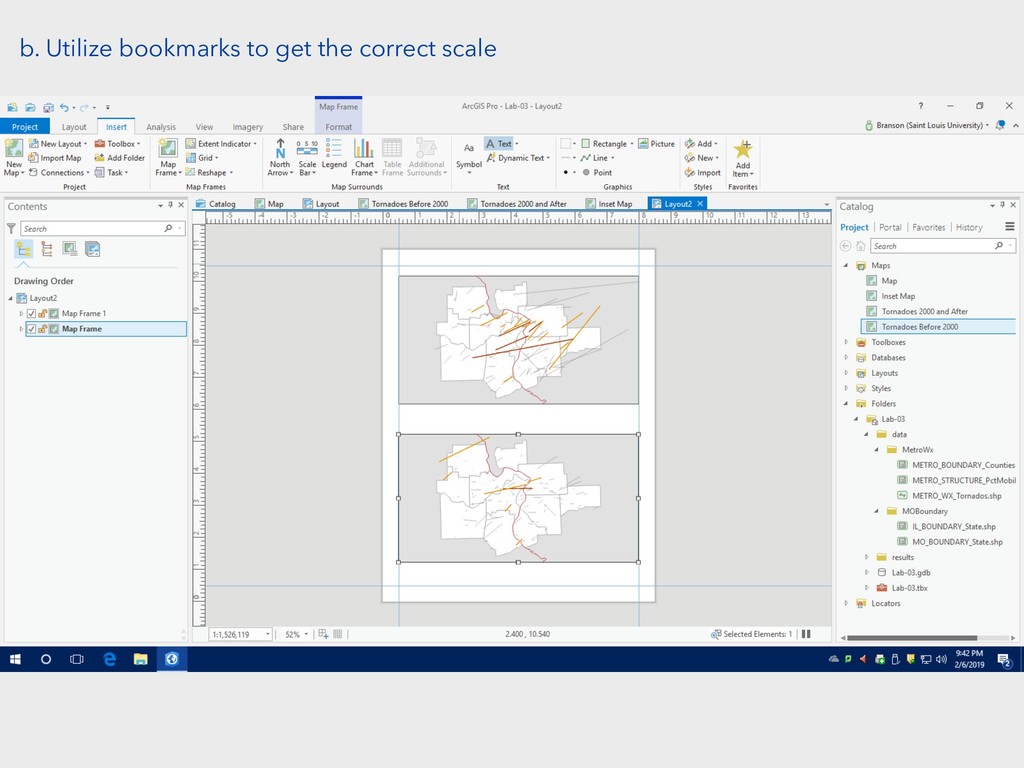
b. Utilize bookmarks to get the correct scale
b. Utilize bookmarks to get the correct scale
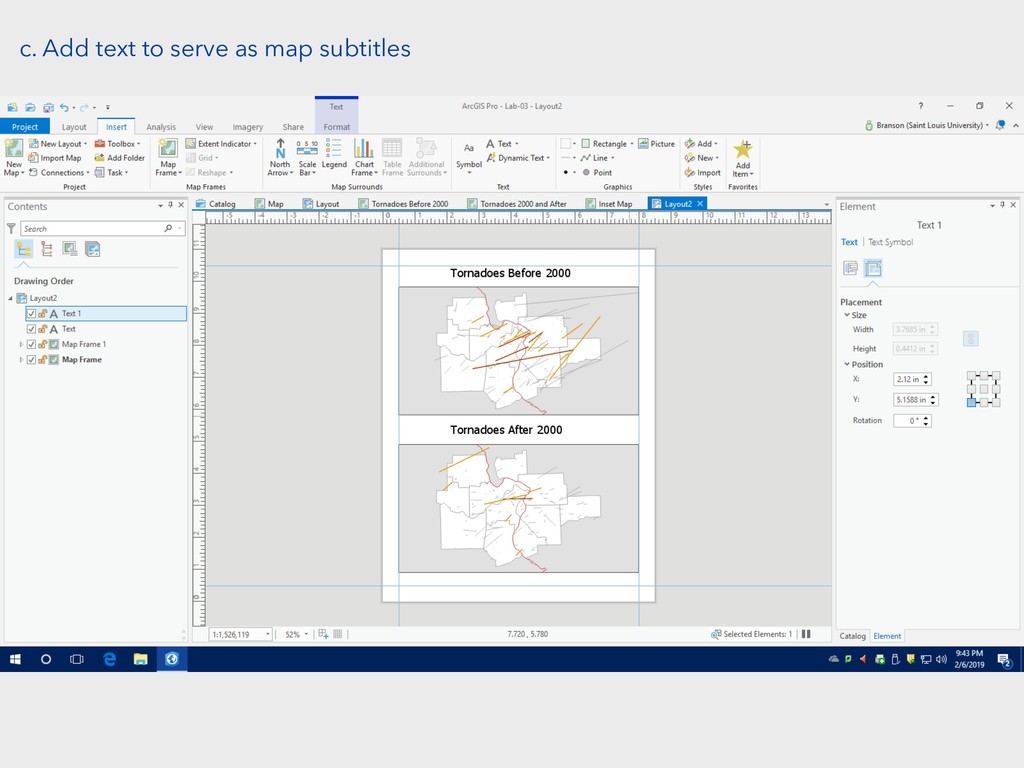
c. Add text to serve as map subtitles
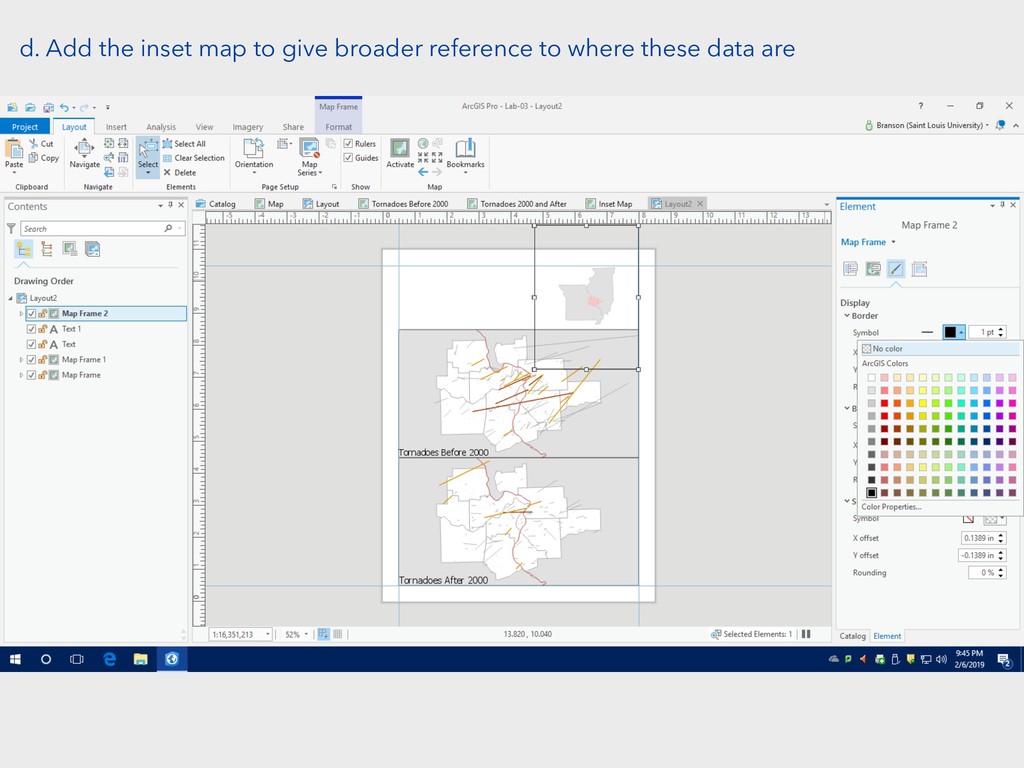
d. Add the inset map to give broader reference to
where these data are
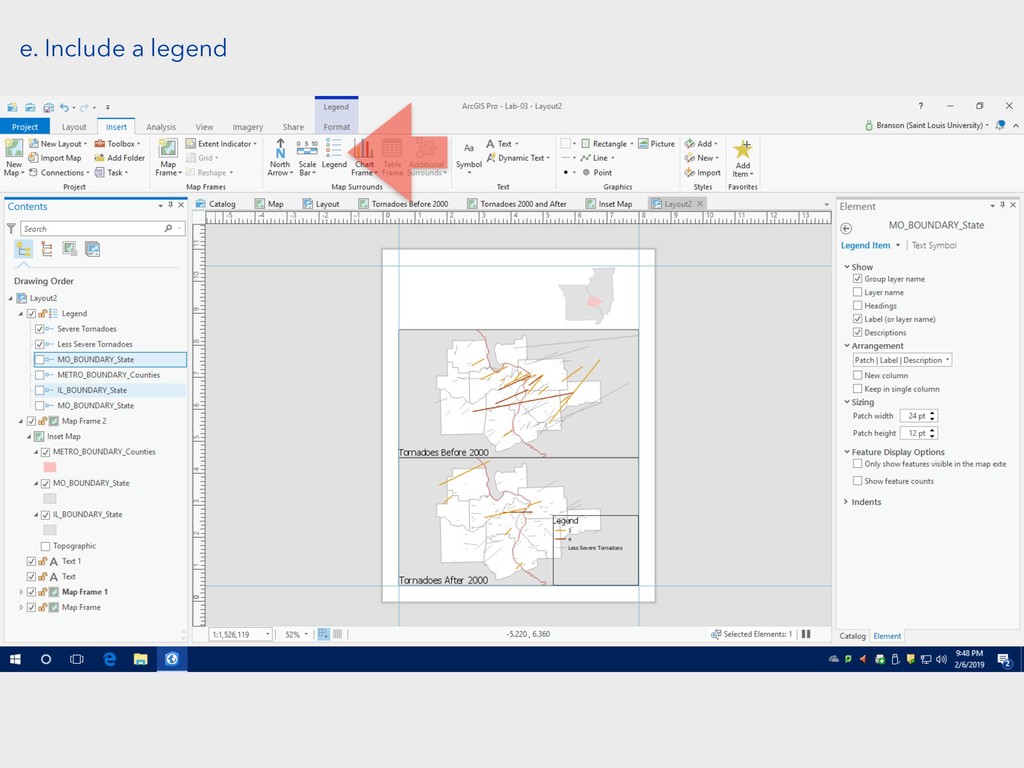
e. Include a legend
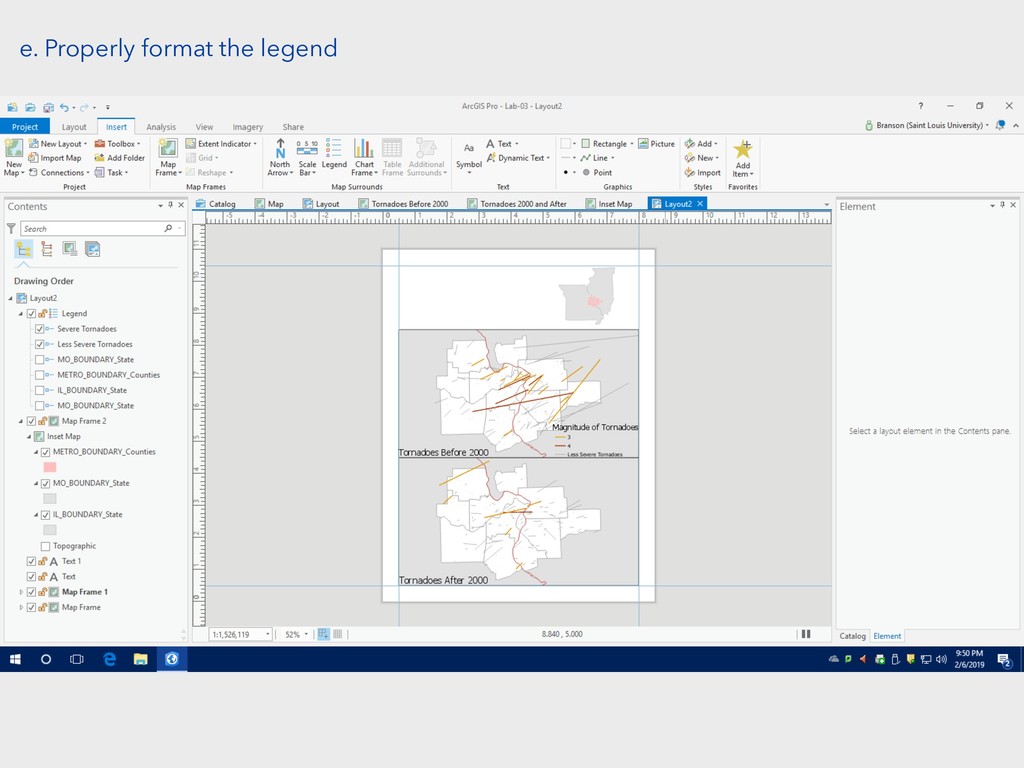
e. Properly format the legend
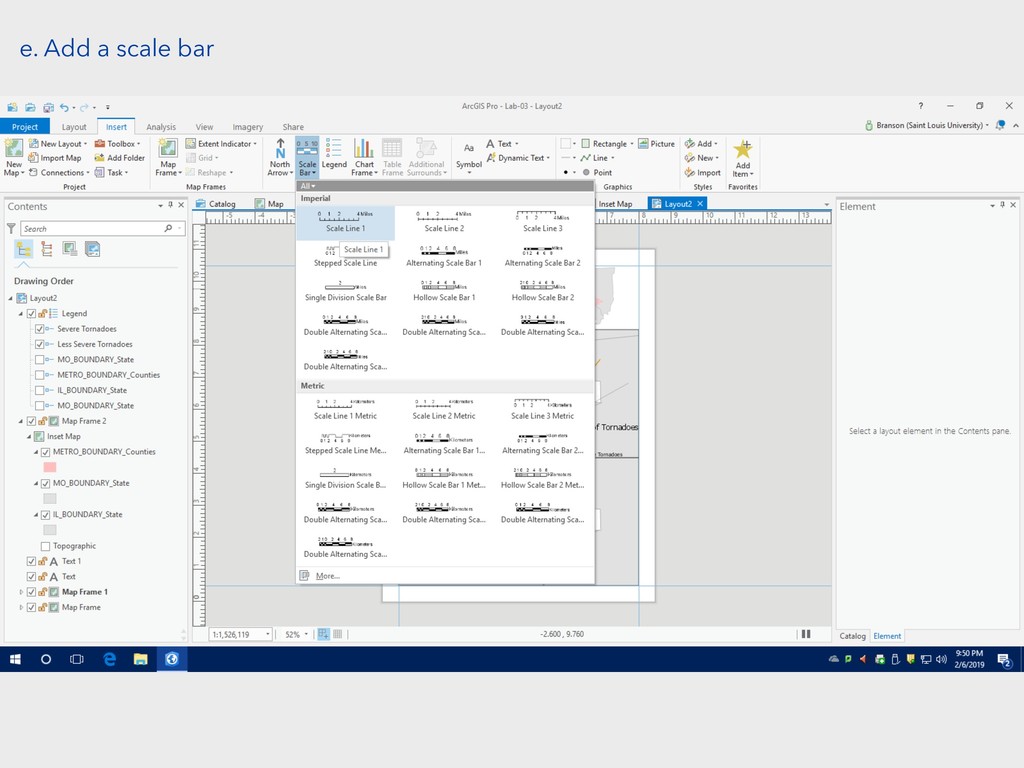
e. Add a scale bar
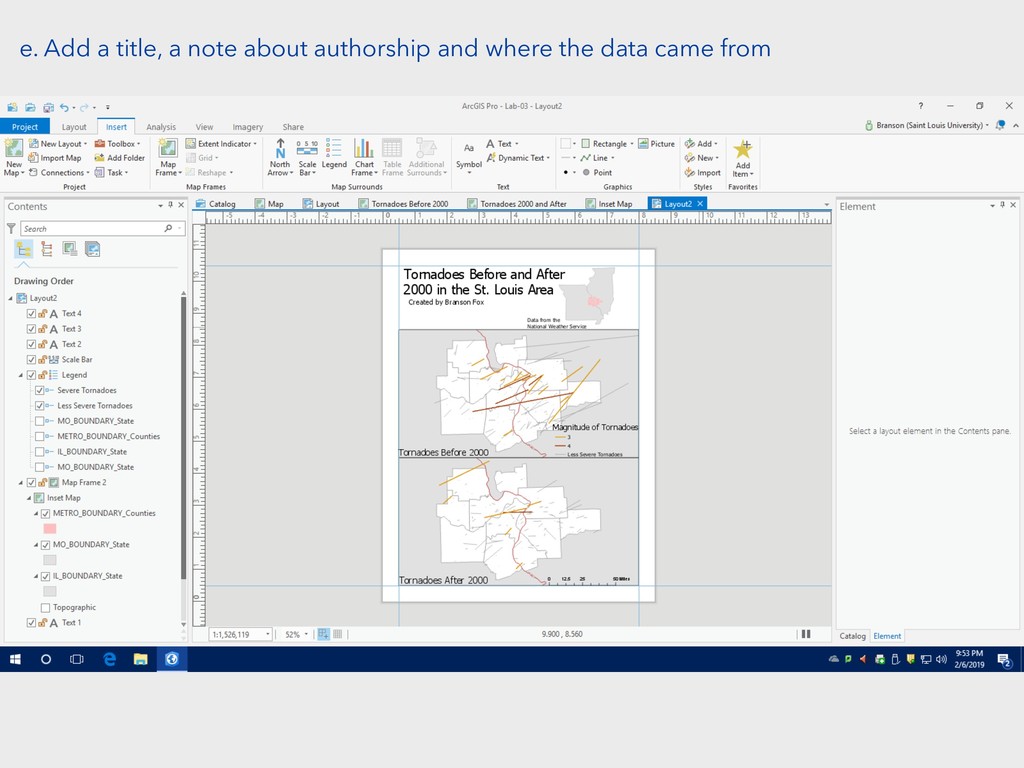
e. Add a title, a note about authorship and where
the data came from
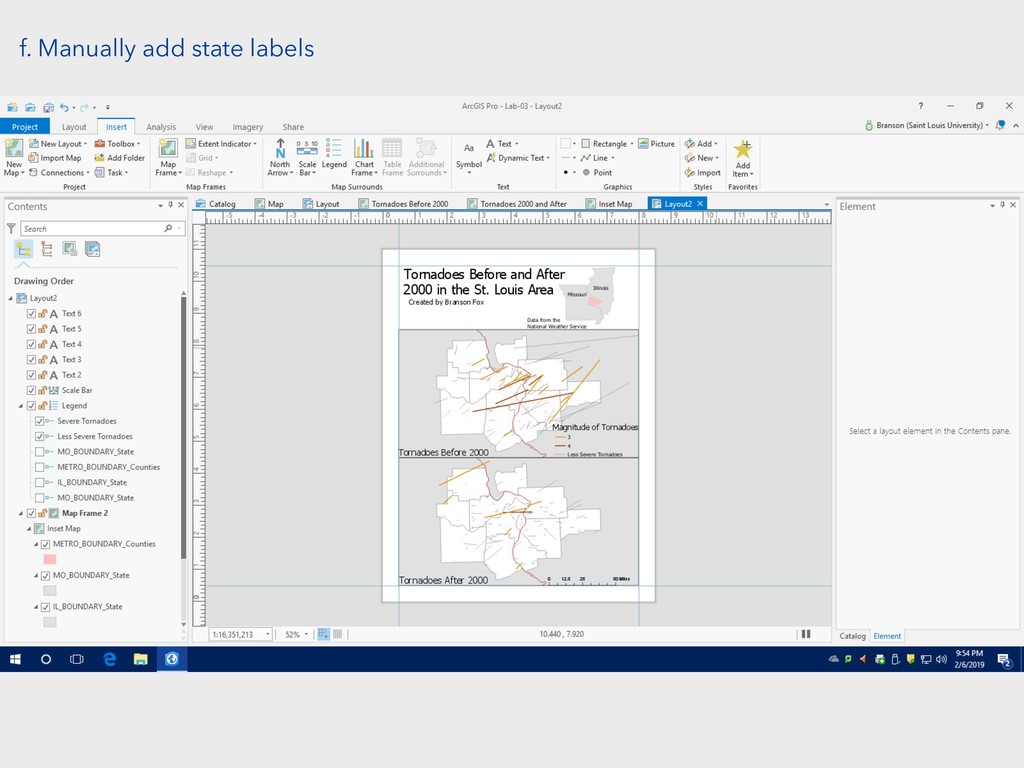
f. Manually add state labels
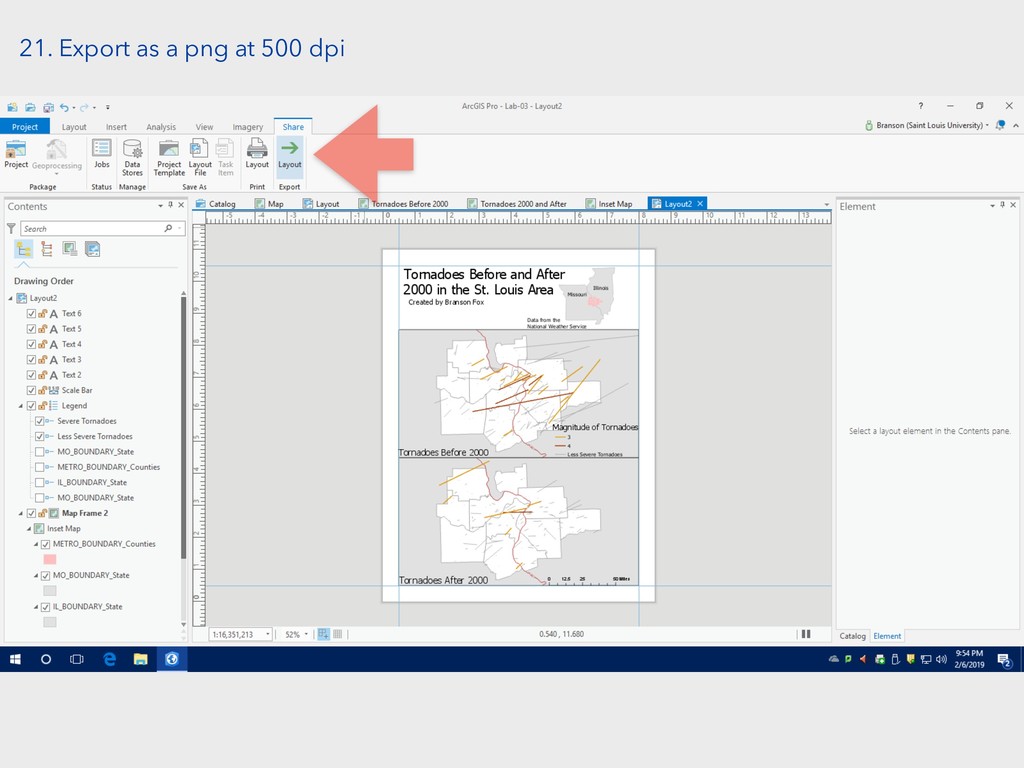
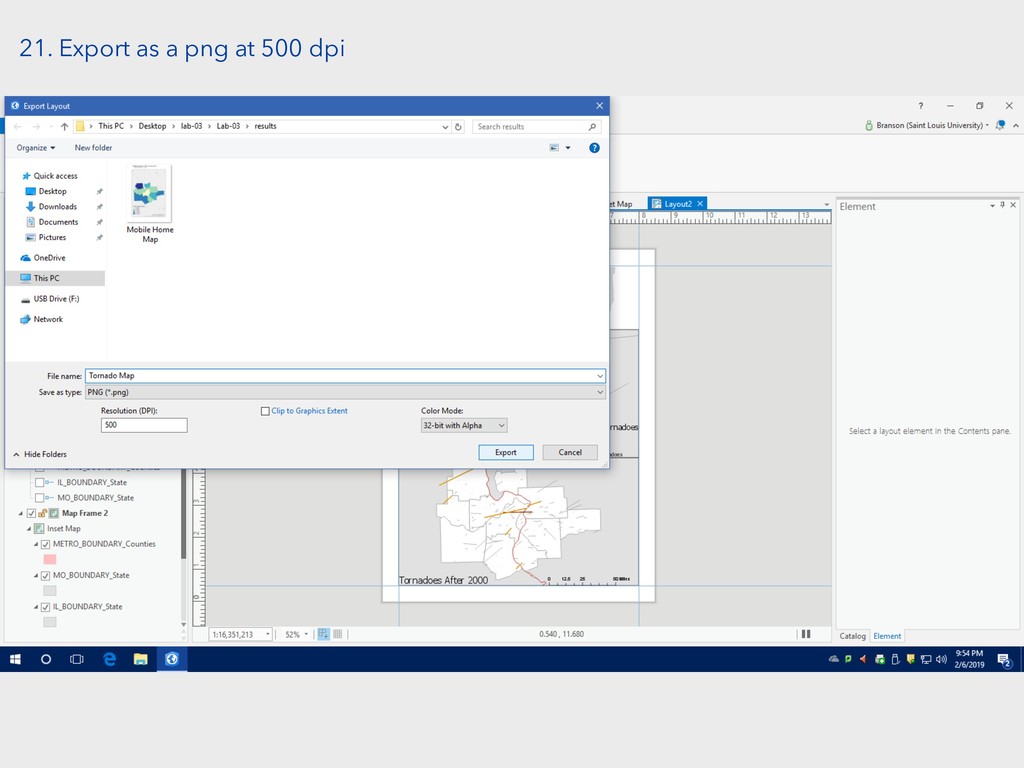
21. Export as a png at 500 dpi
21. Export as a png at 500 dpi