Slides for Lecture 02 of the Saint Louis University Course Introduction to GIS. These slides go deeper in the concept of analysis development, introduce different types of data in GIS work, and introduce the ggplot2 package in R.
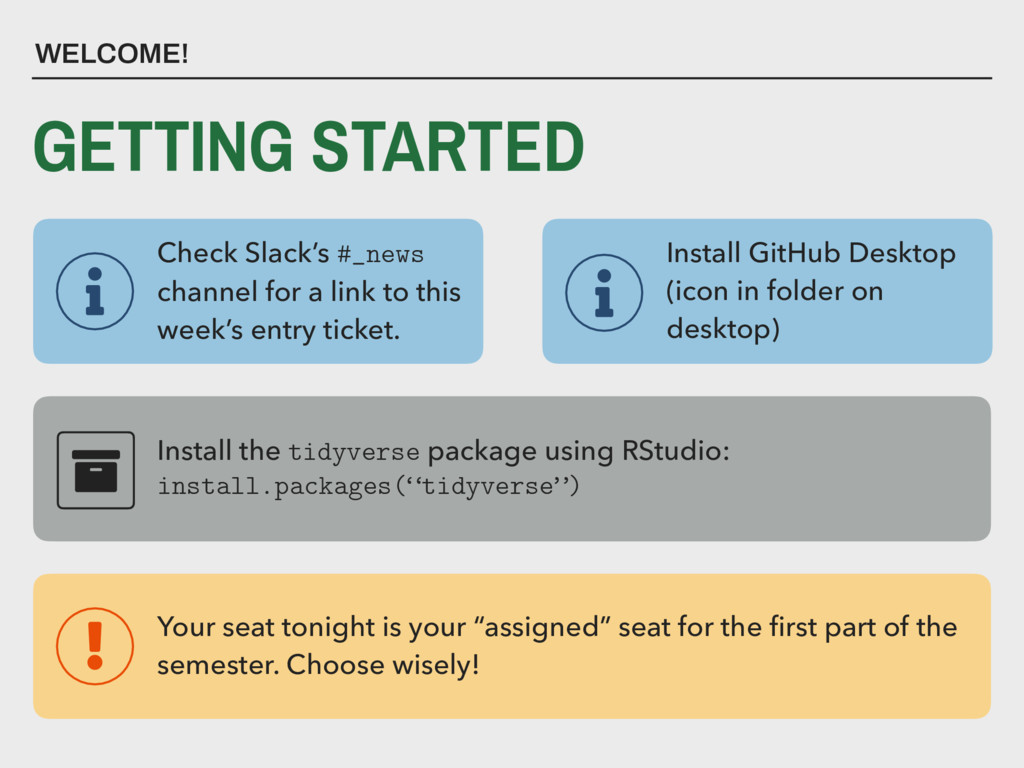
to this week’s entry ticket. Install GitHub Desktop (icon in folder on desktop) Your seat tonight is your “assigned” seat for the first part of the semester. Choose wisely! Install the tidyverse package using RStudio: install.packages(“tidyverse”)
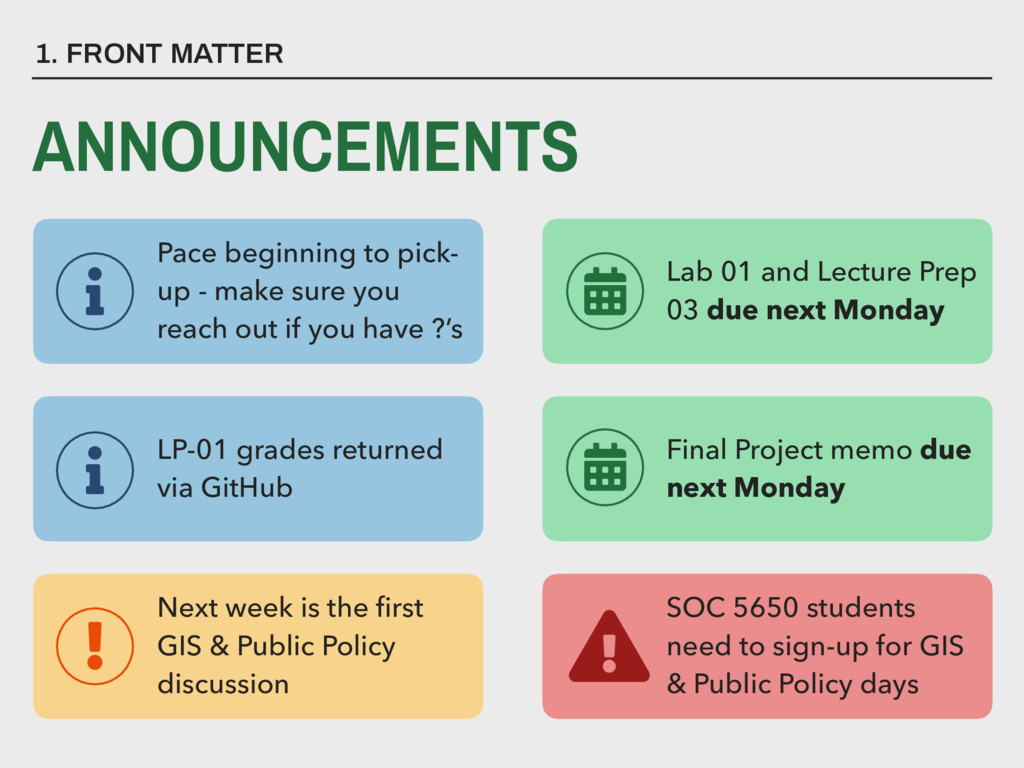
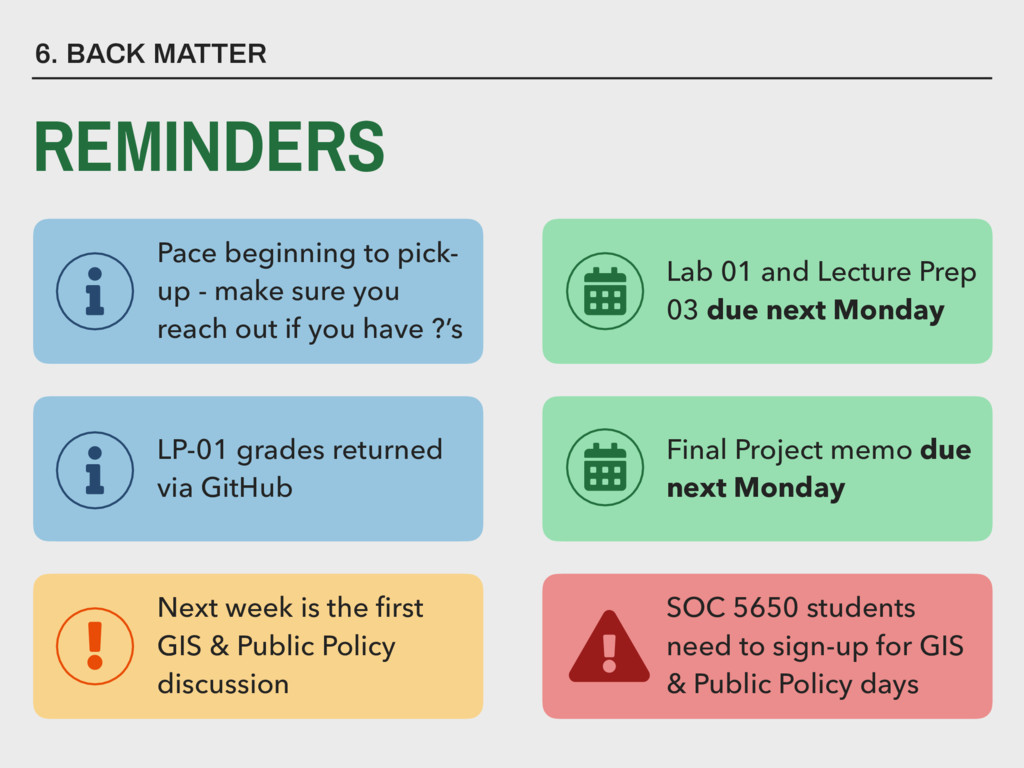
1. FRONT MATTER ANNOUNCEMENTS Pace beginning to pick- up - make sure you reach out if you have ?’s LP-01 grades returned via GitHub Final Project memo due next Monday Lab 01 and Lecture Prep 03 due next Monday SOC 5650 students need to sign-up for GIS & Public Policy days
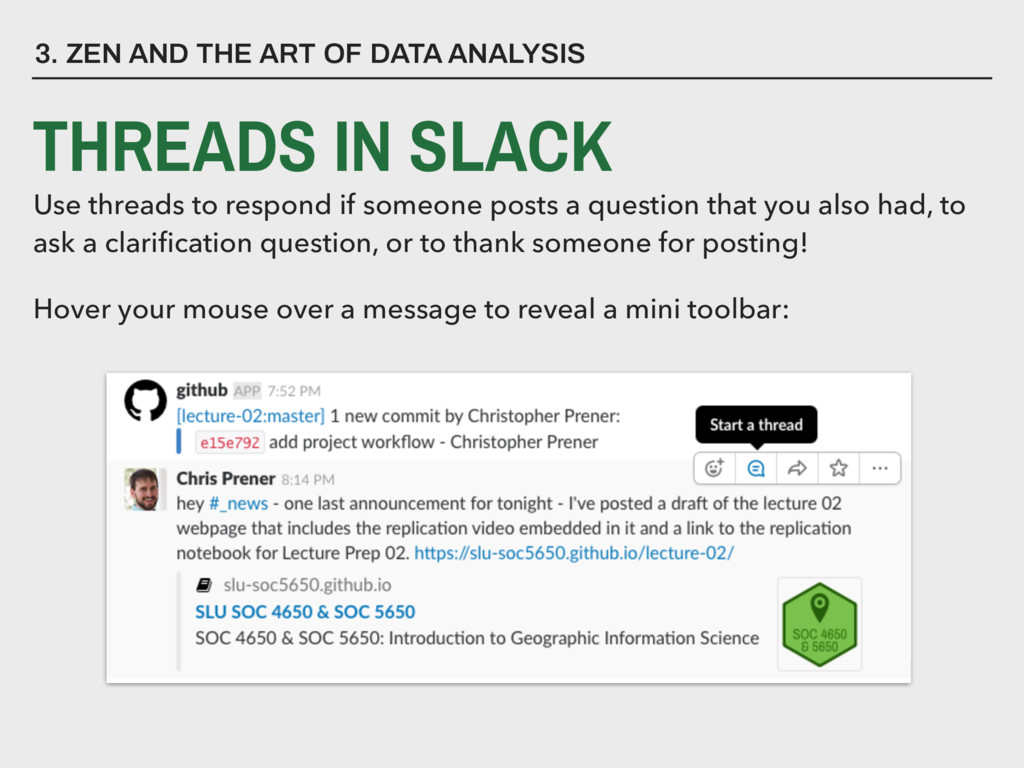
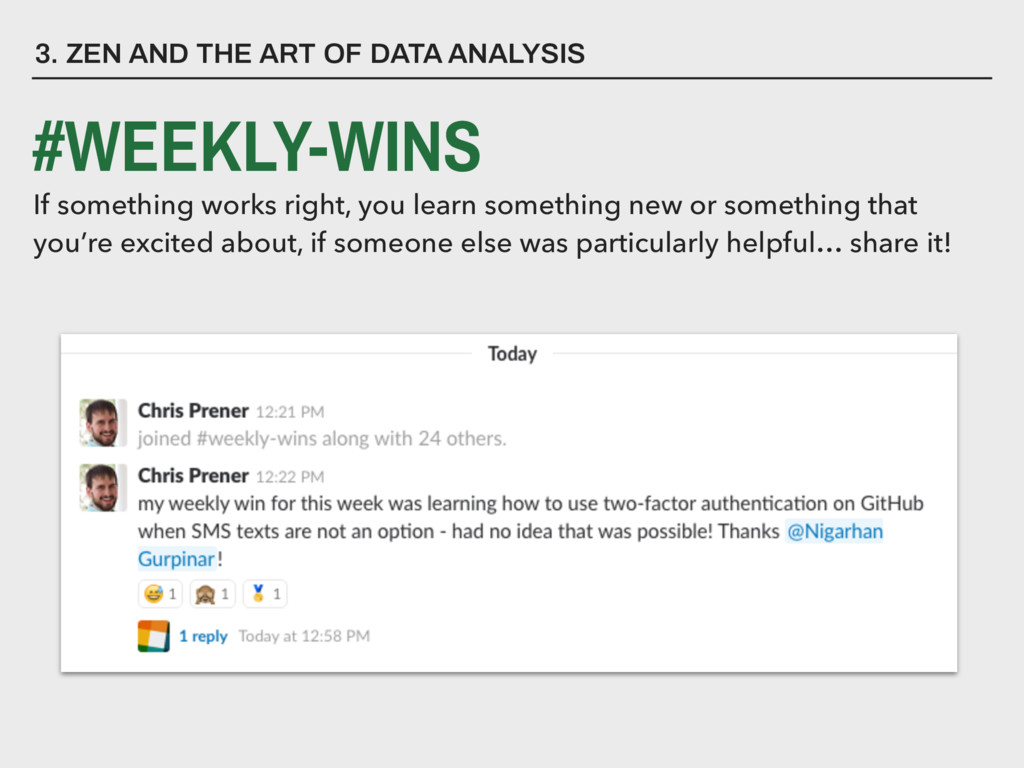
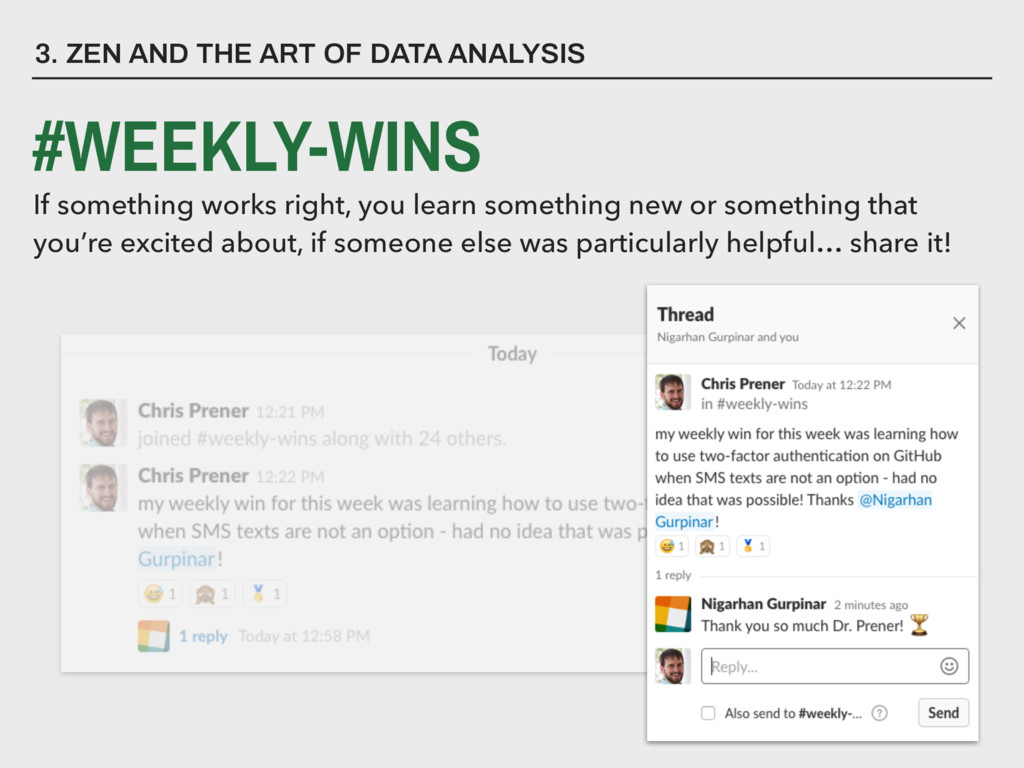
SLACK Use threads to respond if someone posts a question that you also had, to ask a clarification question, or to thank someone for posting! Hover your mouse over a message to reveal a mini toolbar:
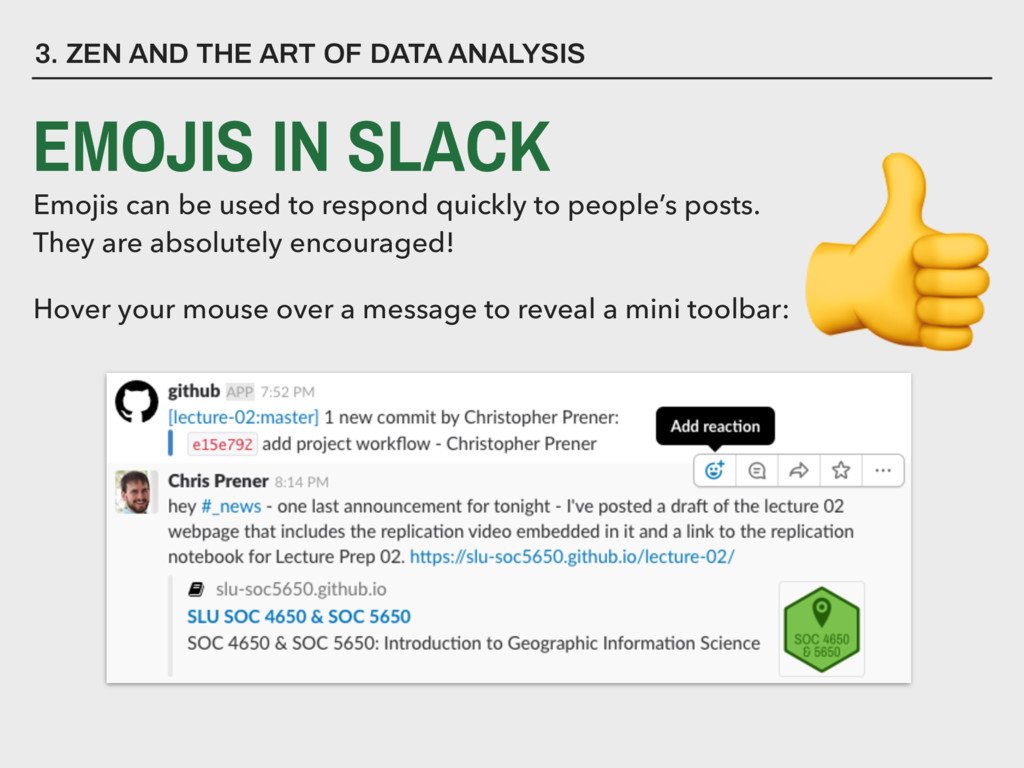
SLACK Emojis can be used to respond quickly to people’s posts. They are absolutely encouraged! Hover your mouse over a message to reveal a mini toolbar:
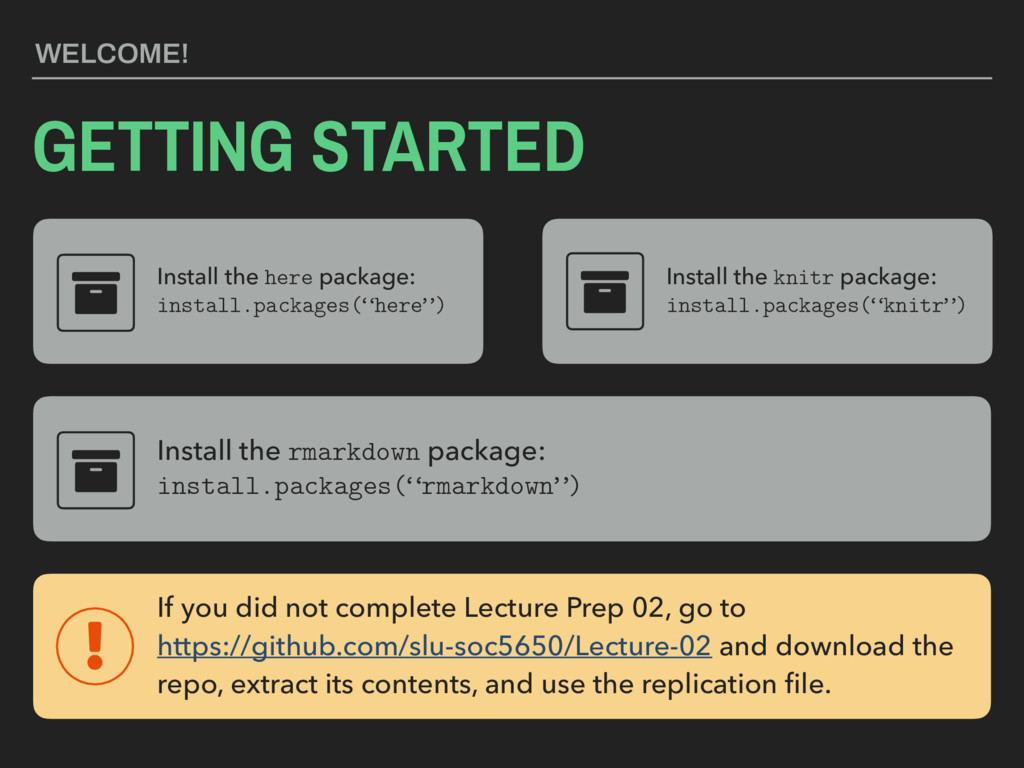
If you did not complete Lecture Prep 02, go to https://github.com/slu-soc5650/Lecture-02 and download the repo, extract its contents, and use the replication file. WELCOME! GETTING STARTED Install the rmarkdown package: install.packages(“rmarkdown”)
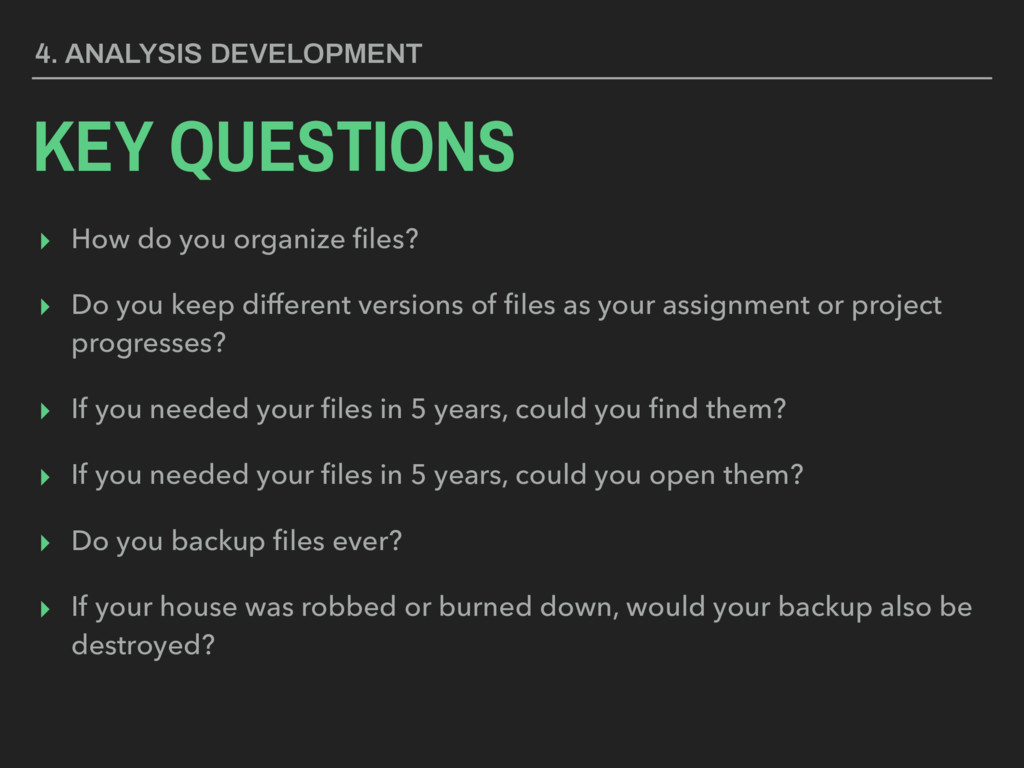
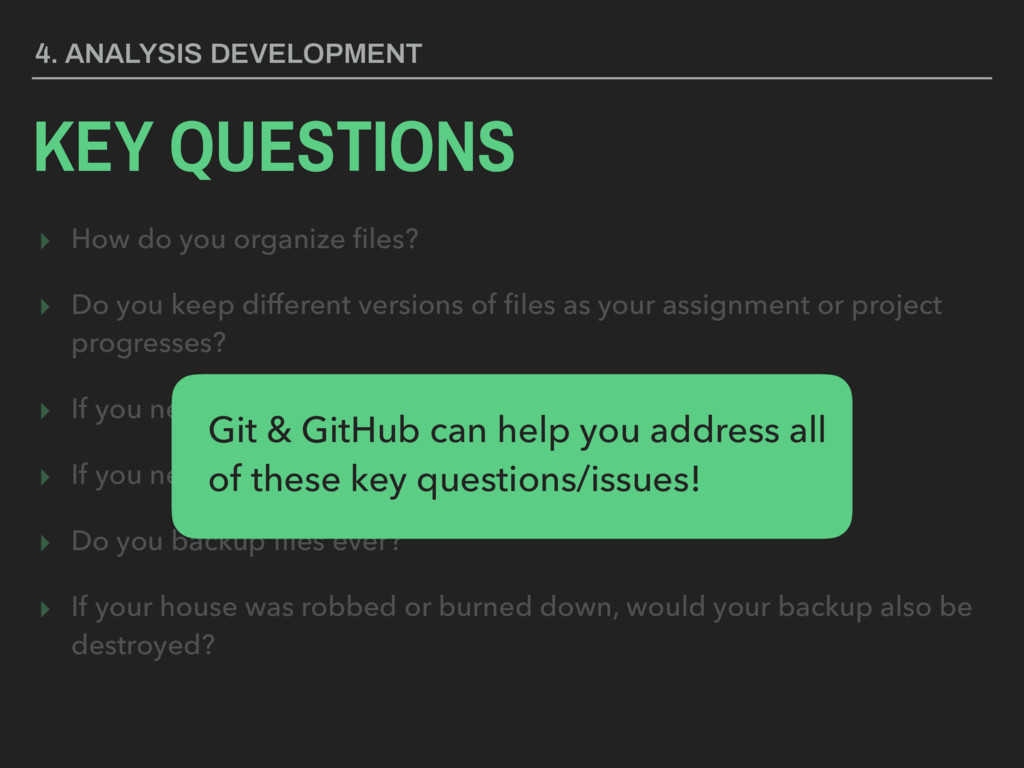
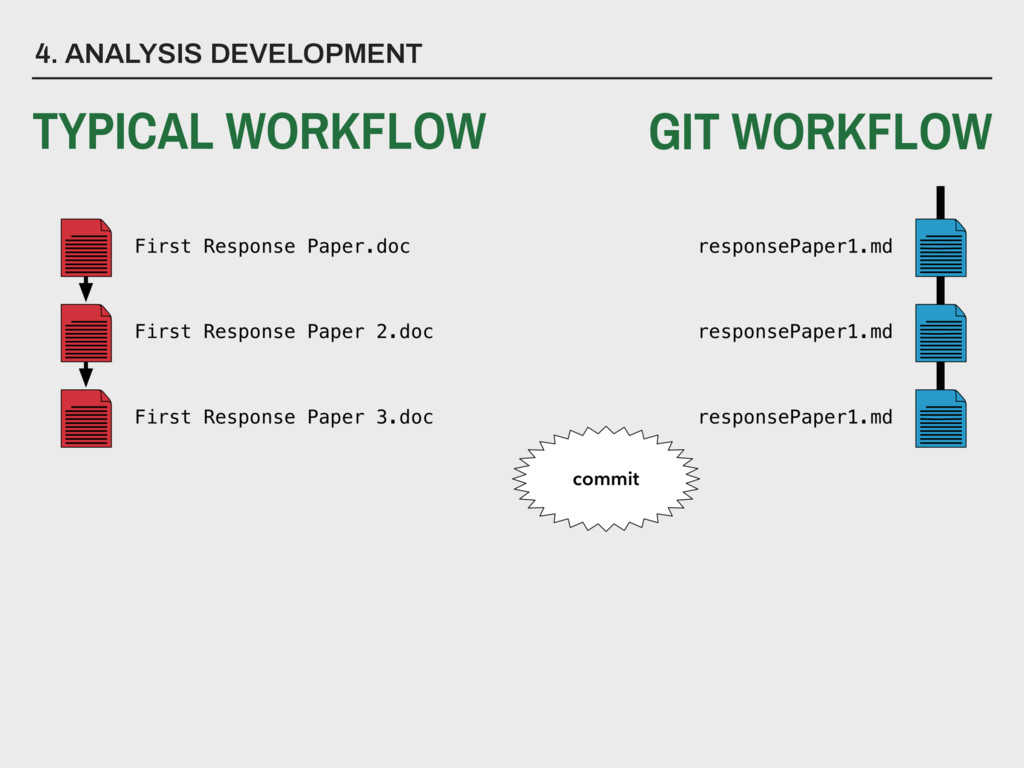
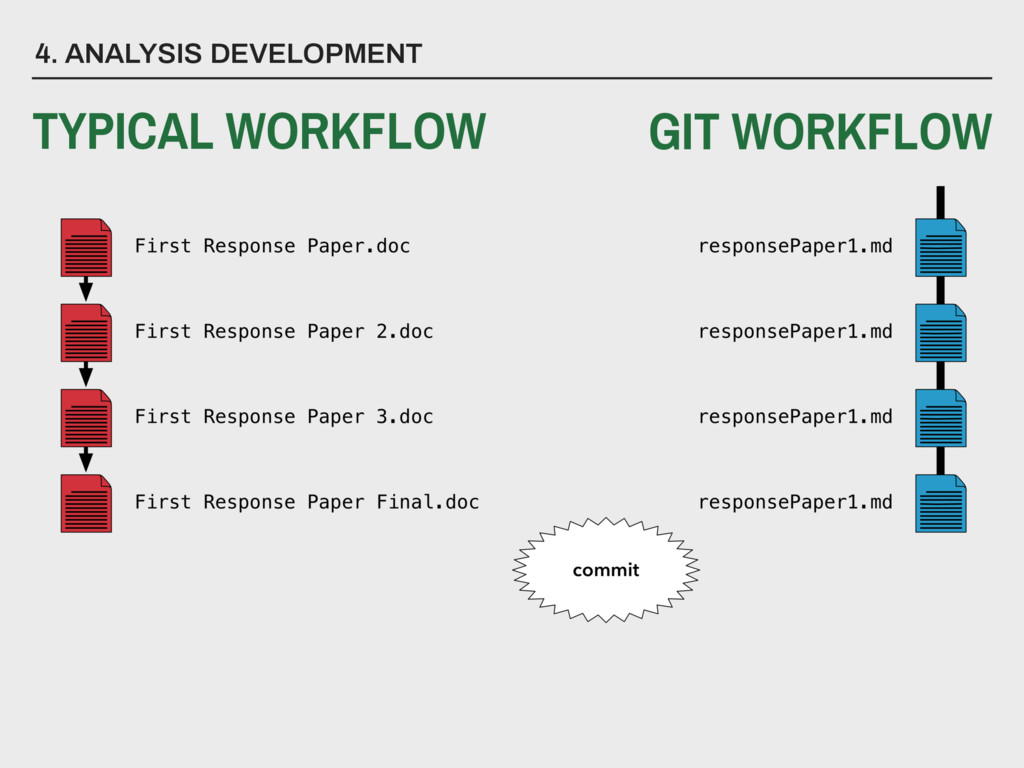
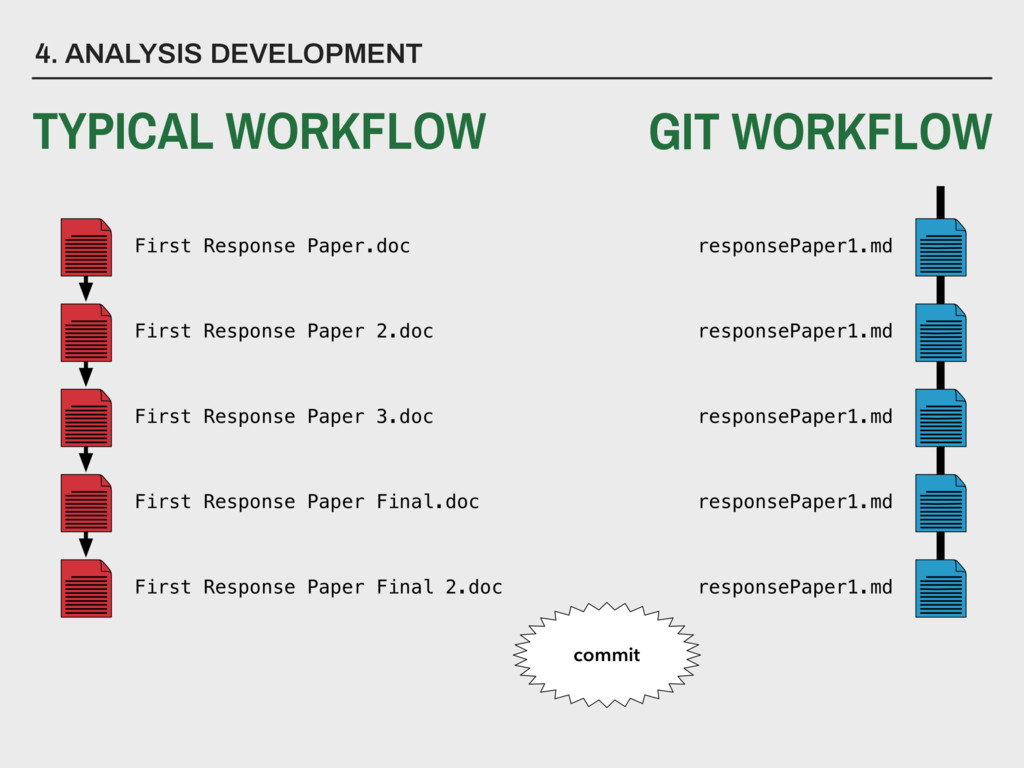
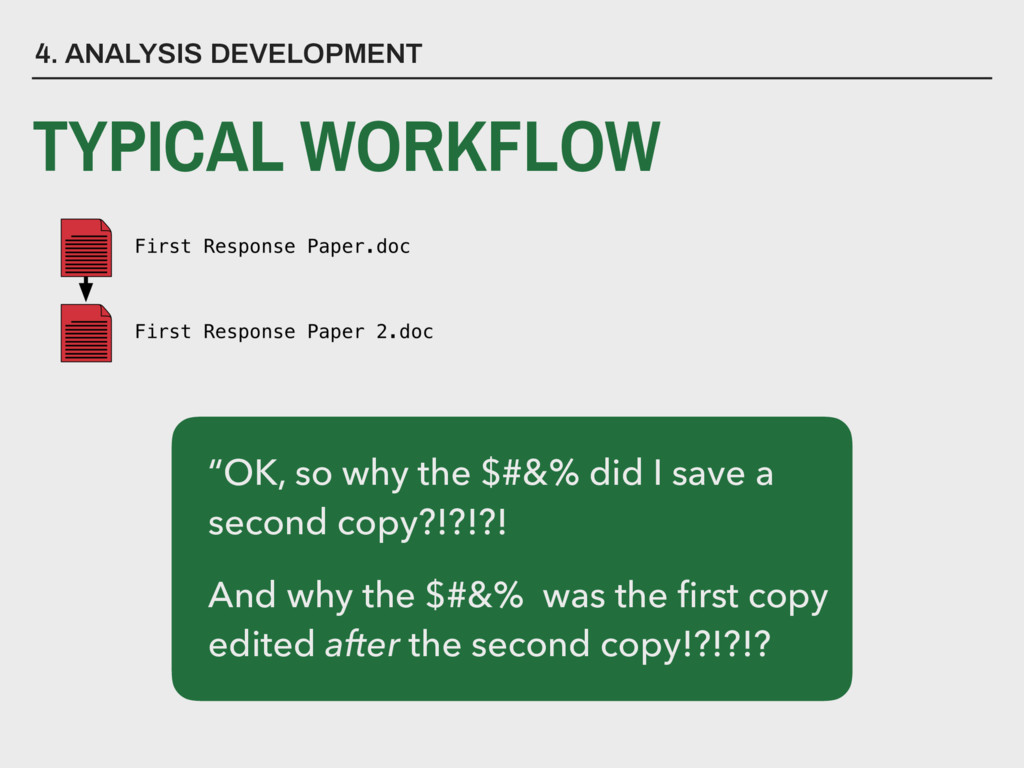
you keep different versions of files as your assignment or project progresses? ▸ If you needed your files in 5 years, could you find them? ▸ If you needed your files in 5 years, could you open them? ▸ Do you backup files ever? ▸ If your house was robbed or burned down, would your backup also be destroyed? 4. ANALYSIS DEVELOPMENT
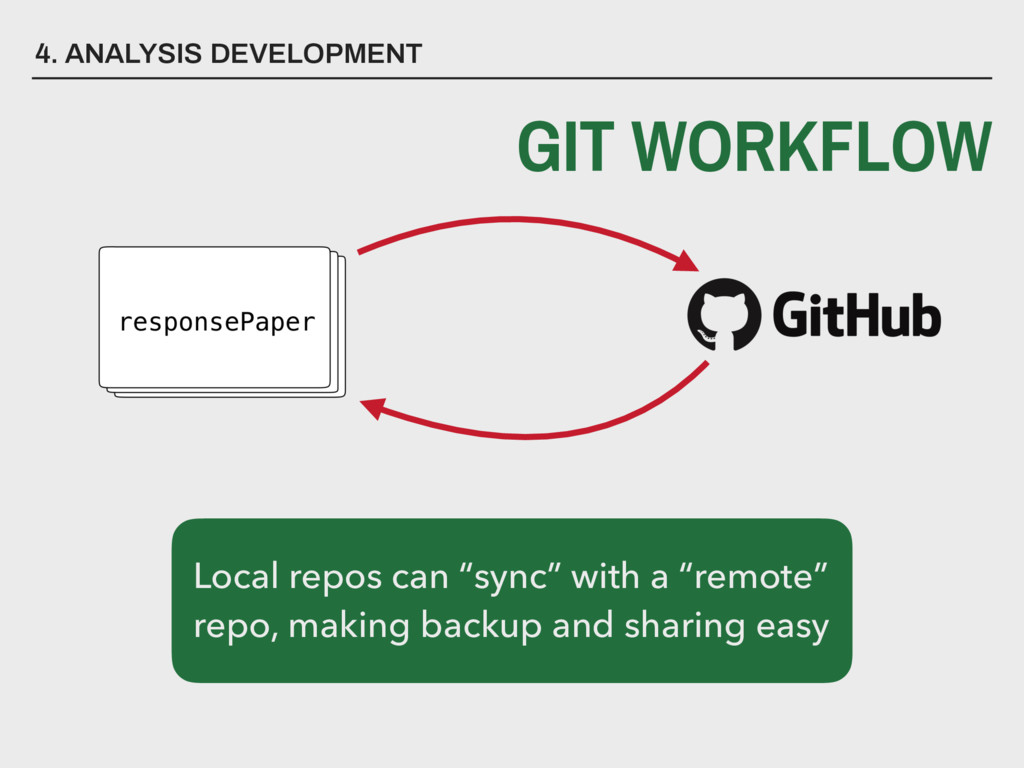
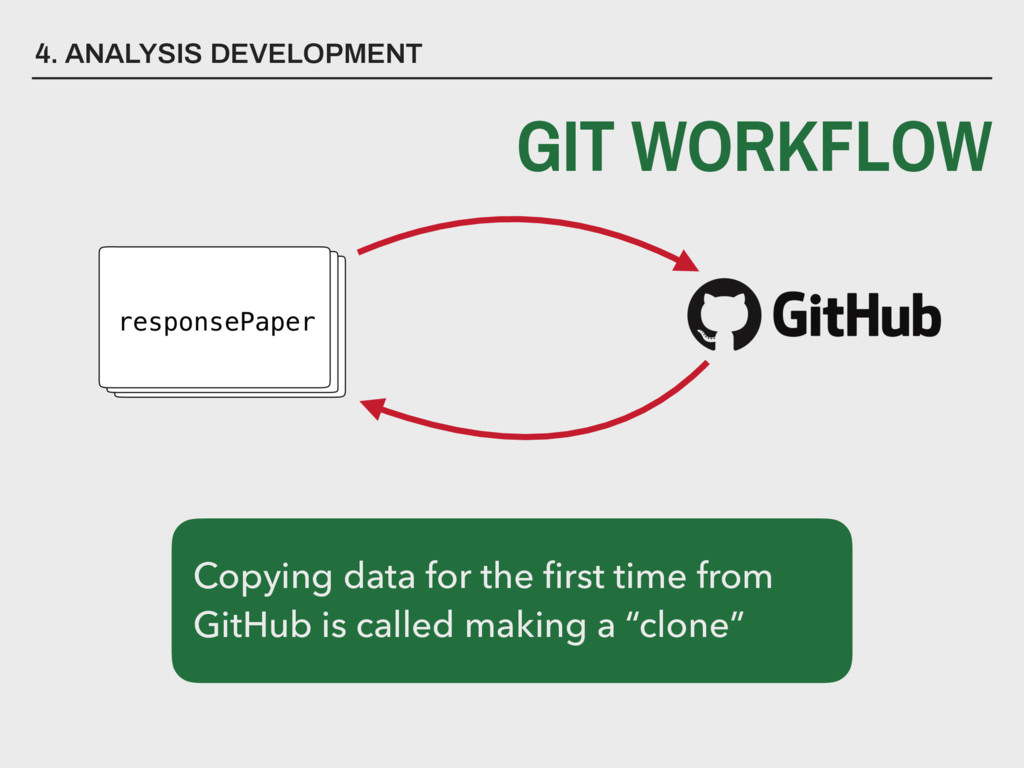
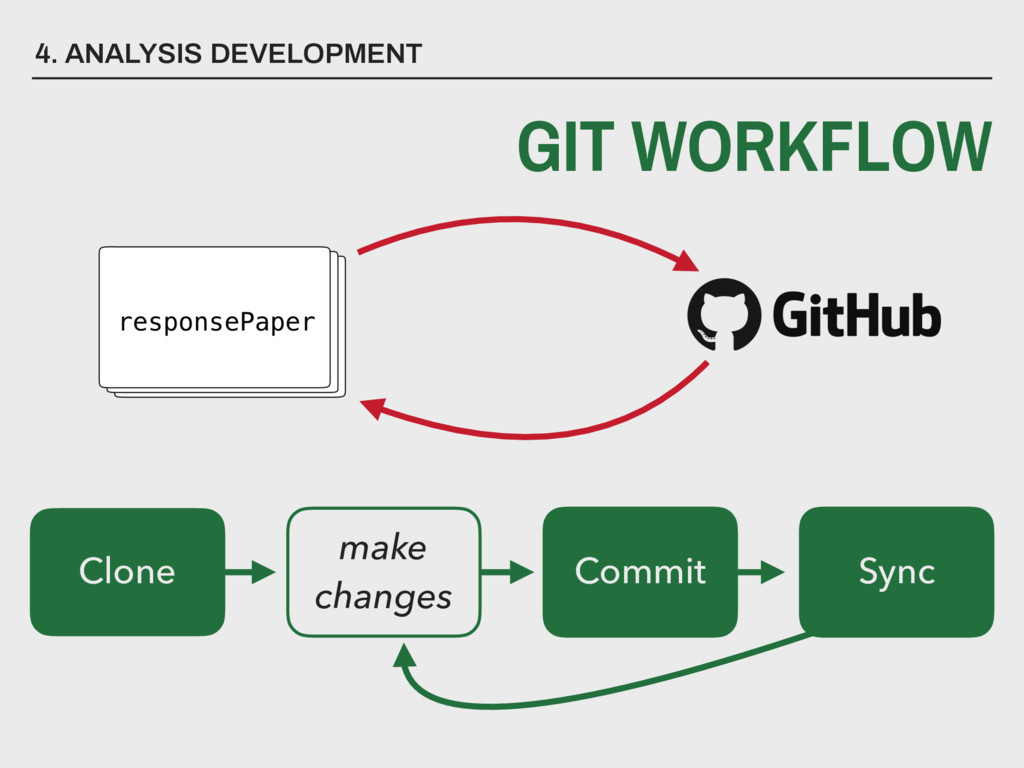
you keep different versions of files as your assignment or project progresses? ▸ If you needed your files in 5 years, could you find them? ▸ If you needed your files in 5 years, could you open them? ▸ Do you backup files ever? ▸ If your house was robbed or burned down, would your backup also be destroyed? 4. ANALYSIS DEVELOPMENT Git & GitHub can help you address all of these key questions/issues!
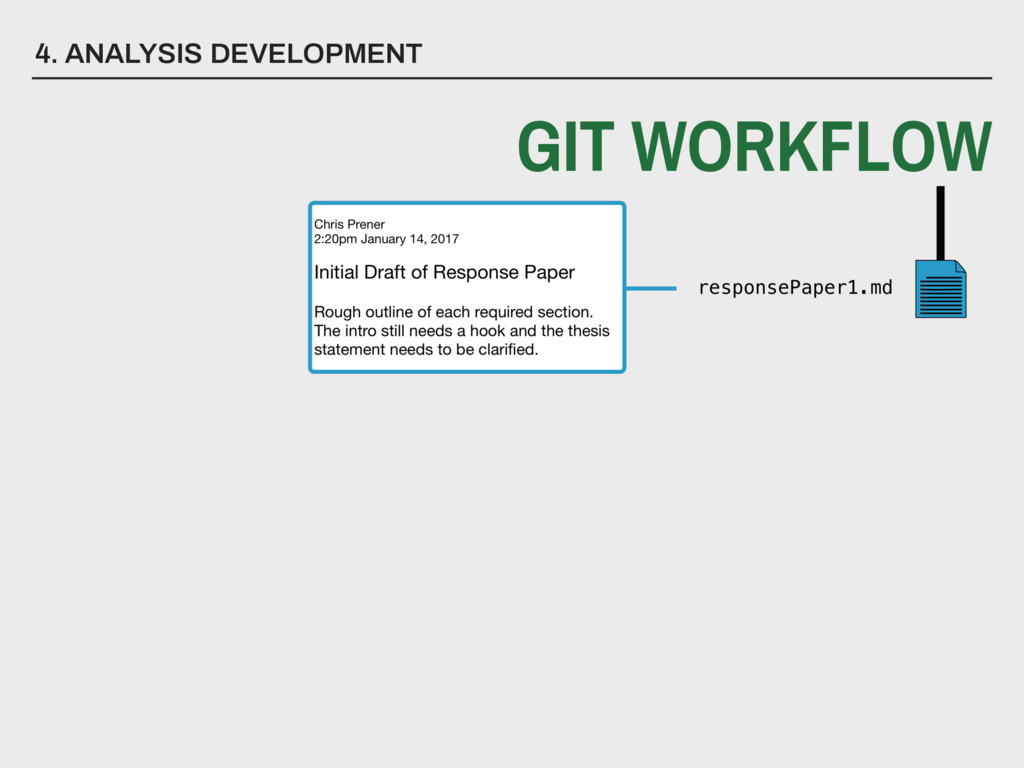
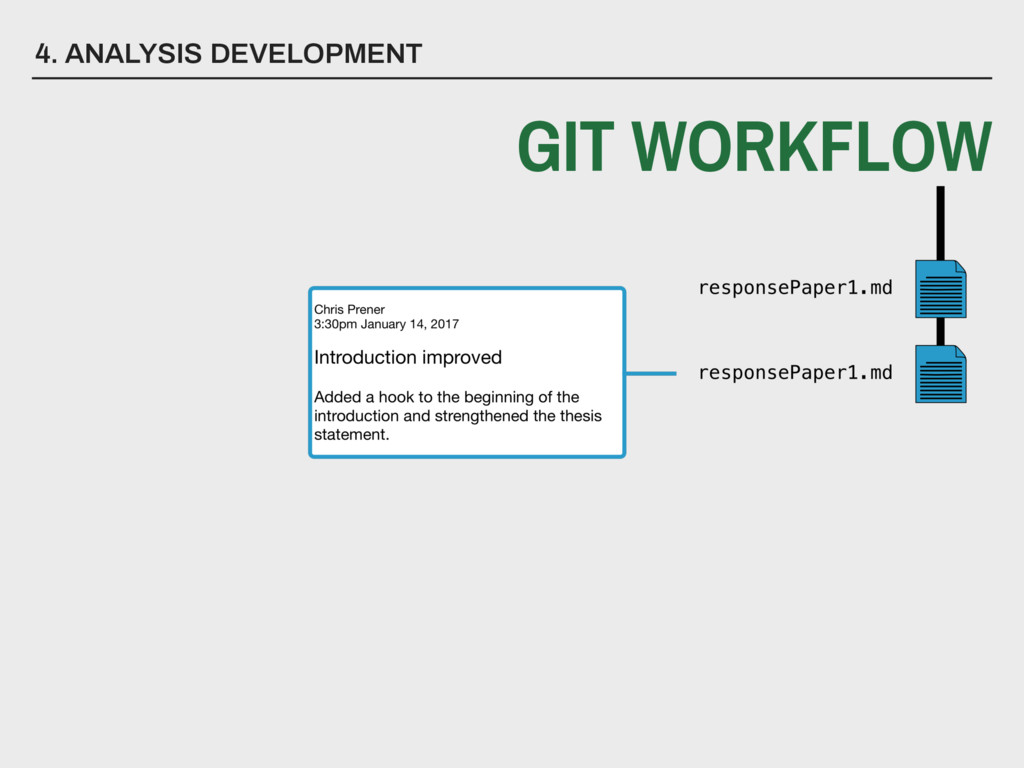
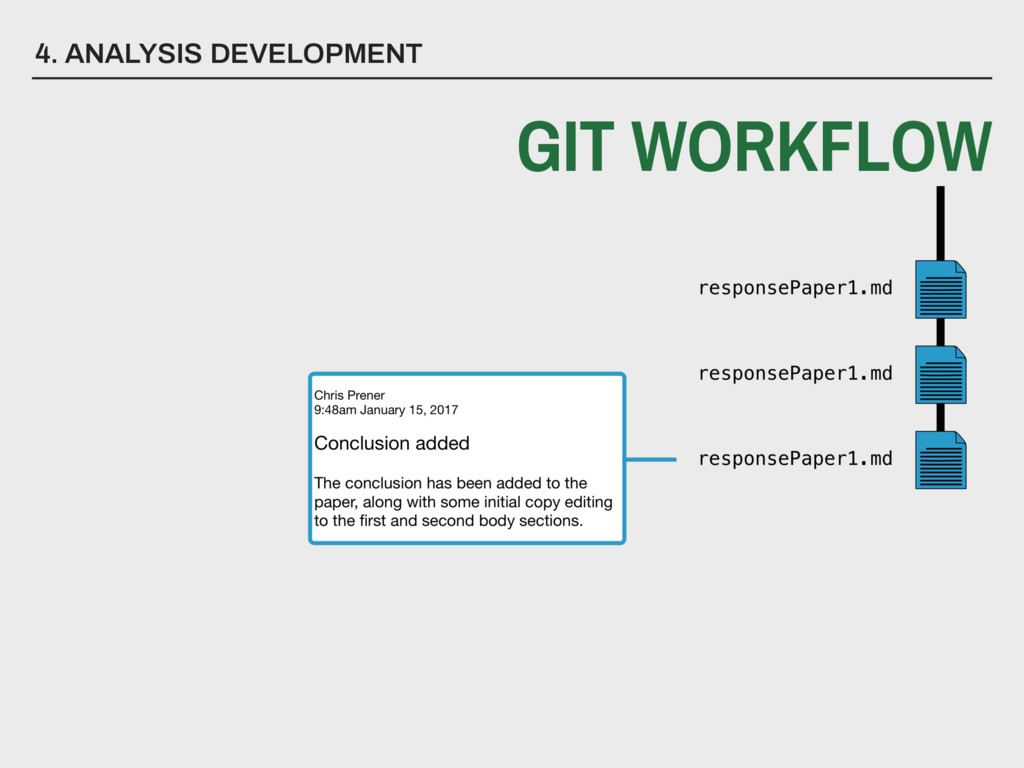
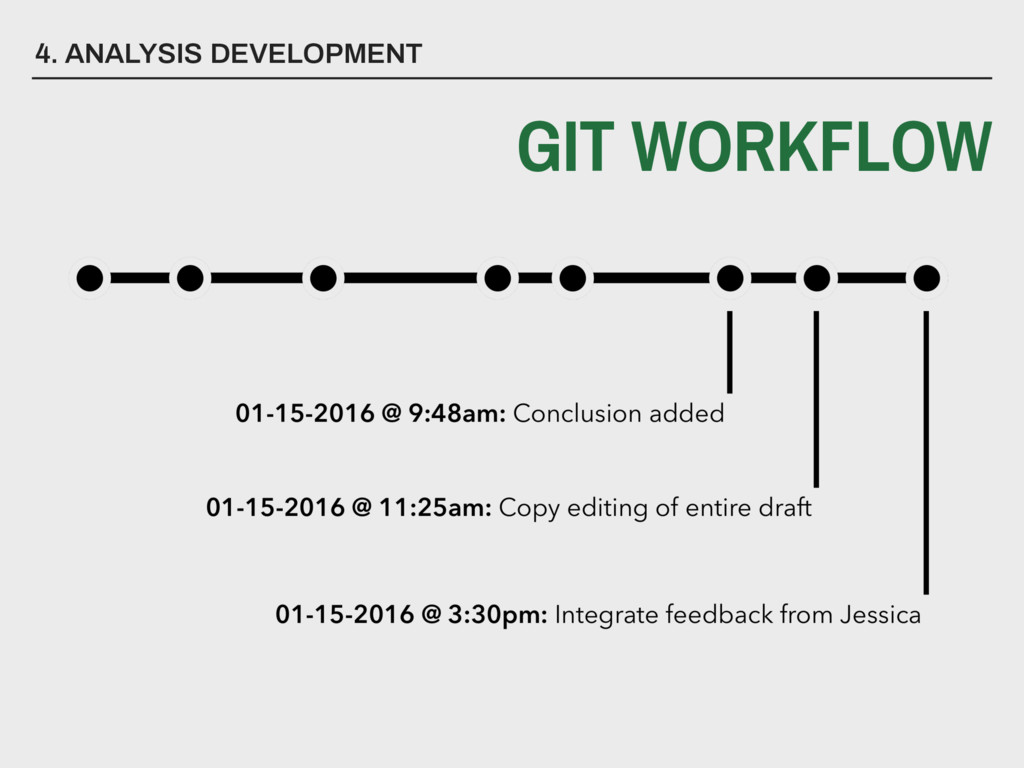
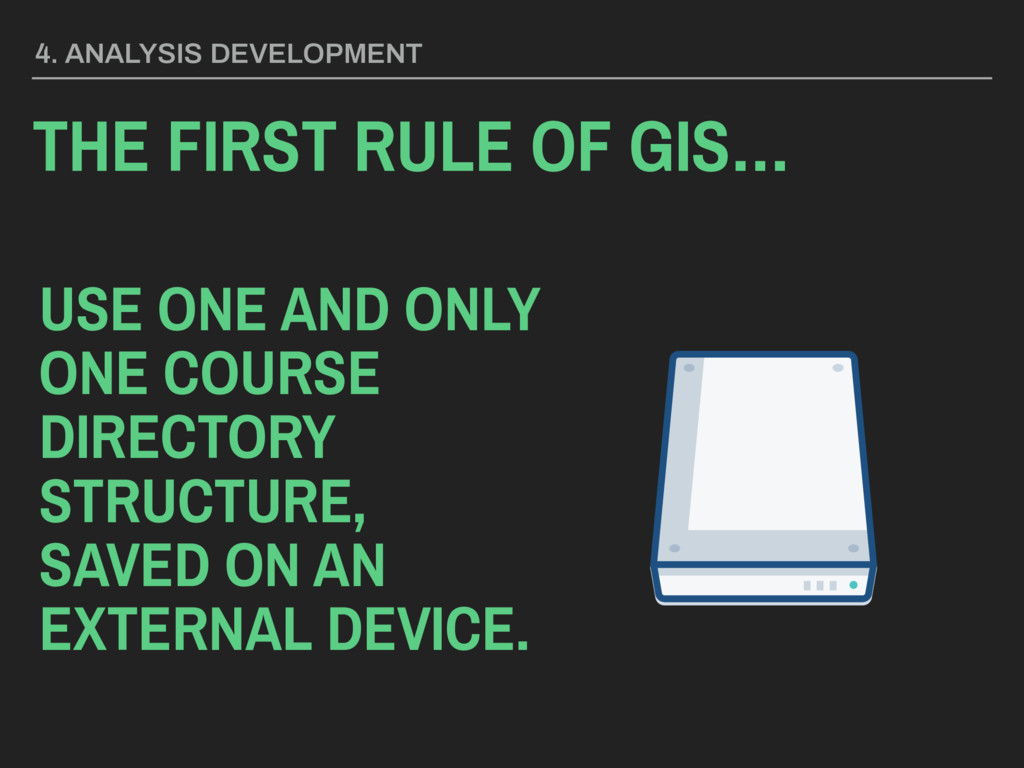
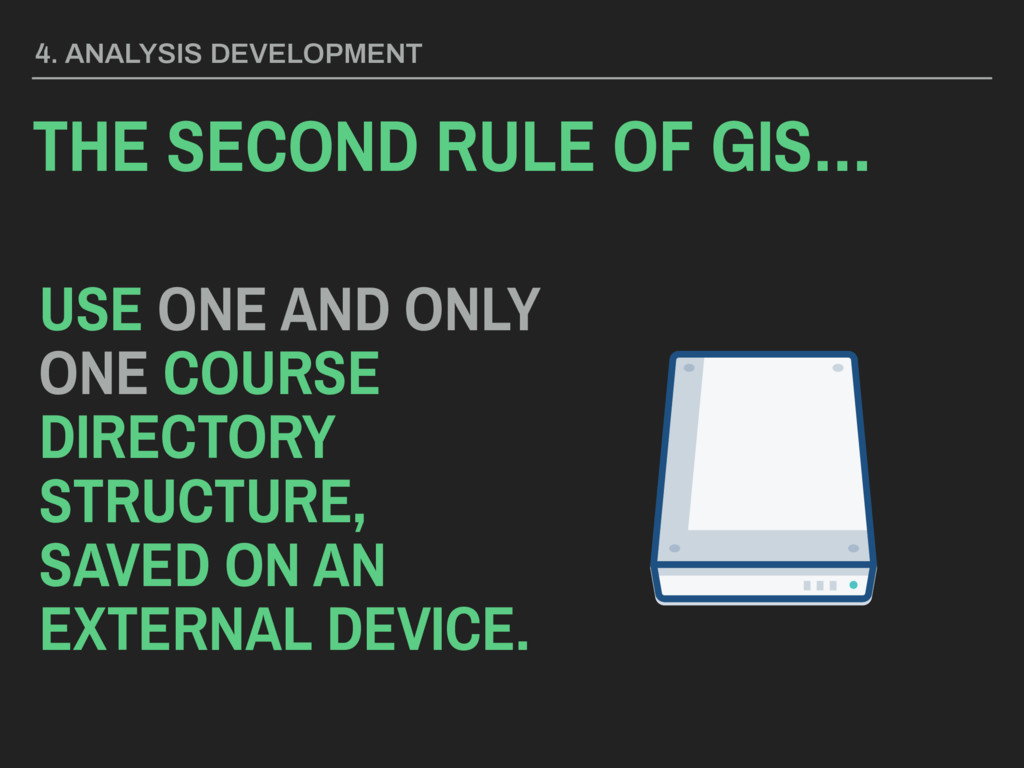
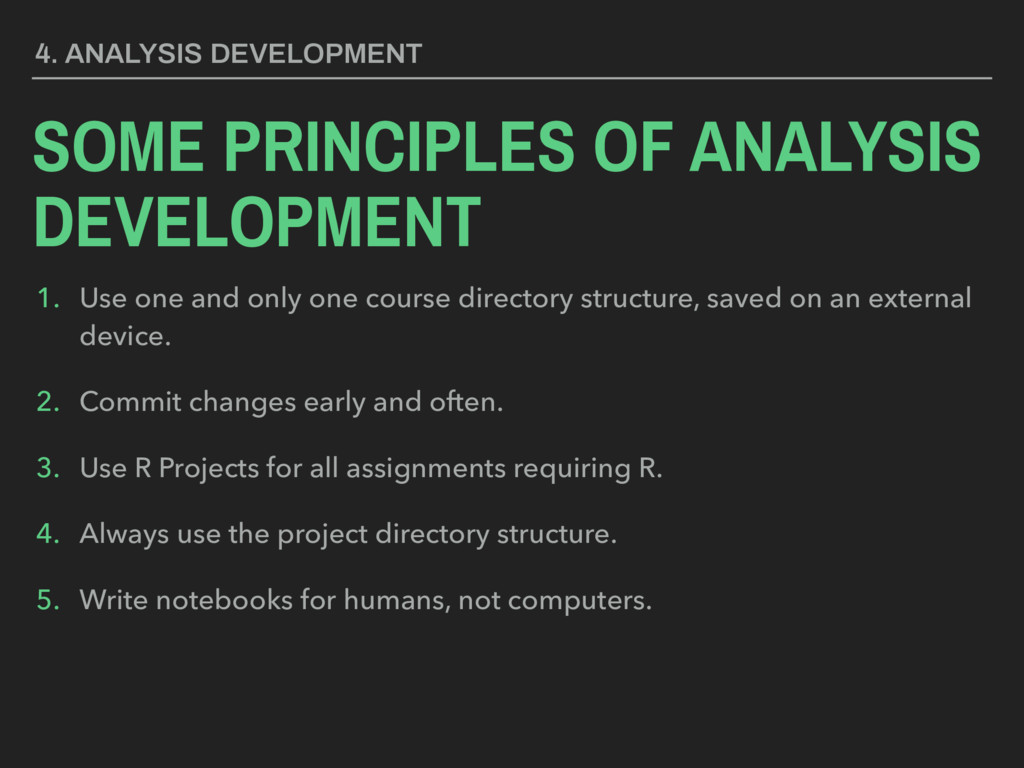
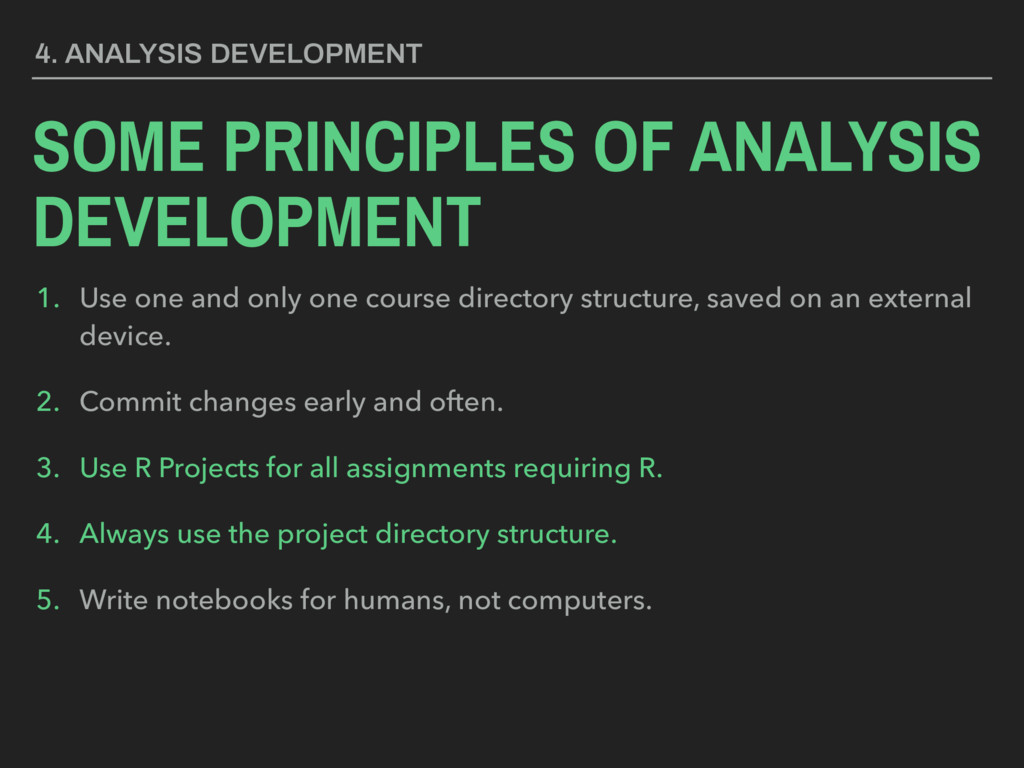
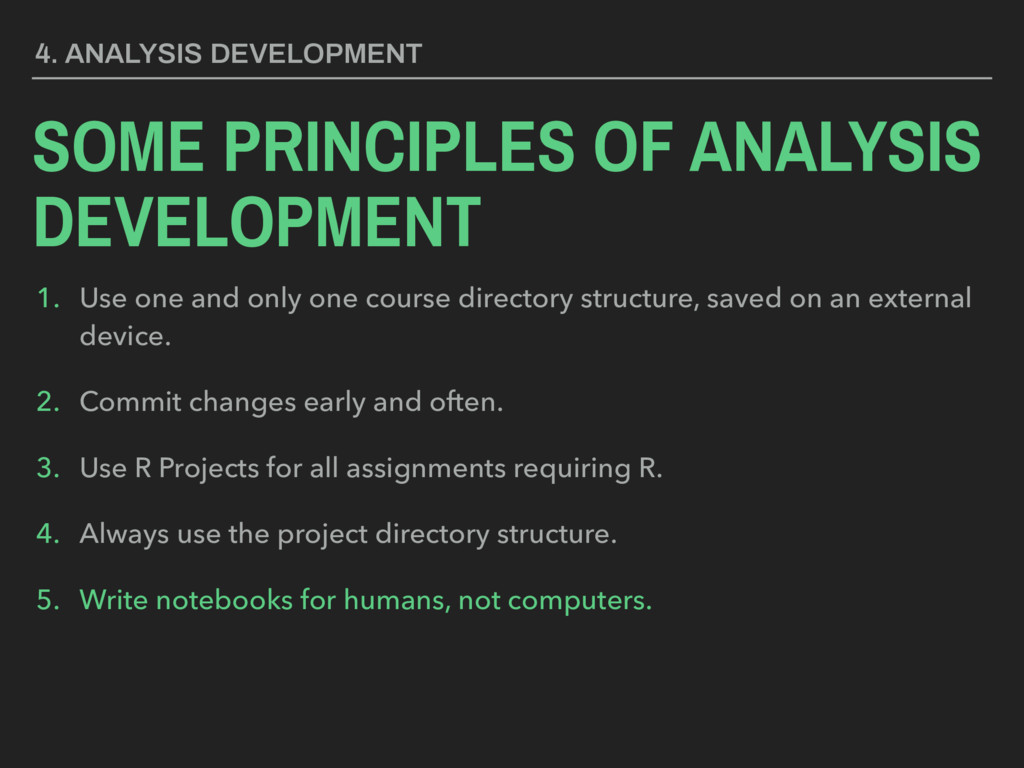
one course directory structure, saved on an external device. 2. Commit changes early and often. 3. Use R Projects for all assignments requiring R. 4. Always use the project directory structure. 5. Write notebooks for humans, not computers. 4. ANALYSIS DEVELOPMENT
one course directory structure, saved on an external device. 2. Commit changes early and often. 3. Use R Projects for all assignments requiring R. 4. Always use the project directory structure. 5. Write notebooks for humans, not computers. 4. ANALYSIS DEVELOPMENT
one course directory structure, saved on an external device. 2. Commit changes early and often. 3. Use R Projects for all assignments requiring R. 4. Always use the project directory structure. 5. Write notebooks for humans, not computers. 4. ANALYSIS DEVELOPMENT
PROGRAMS: INSTEAD OF IMAGINING THAT OUR MAIN TASK IS TO INSTRUCT A COMPUTER WHAT TO DO, LET US CONCENTRATE RATHER ON EXPLAINING TO HUMANS WHAT WE WANT THE COMPUTER TO DO. Donald Knuth, Ph.D. Literate Programming (1984)
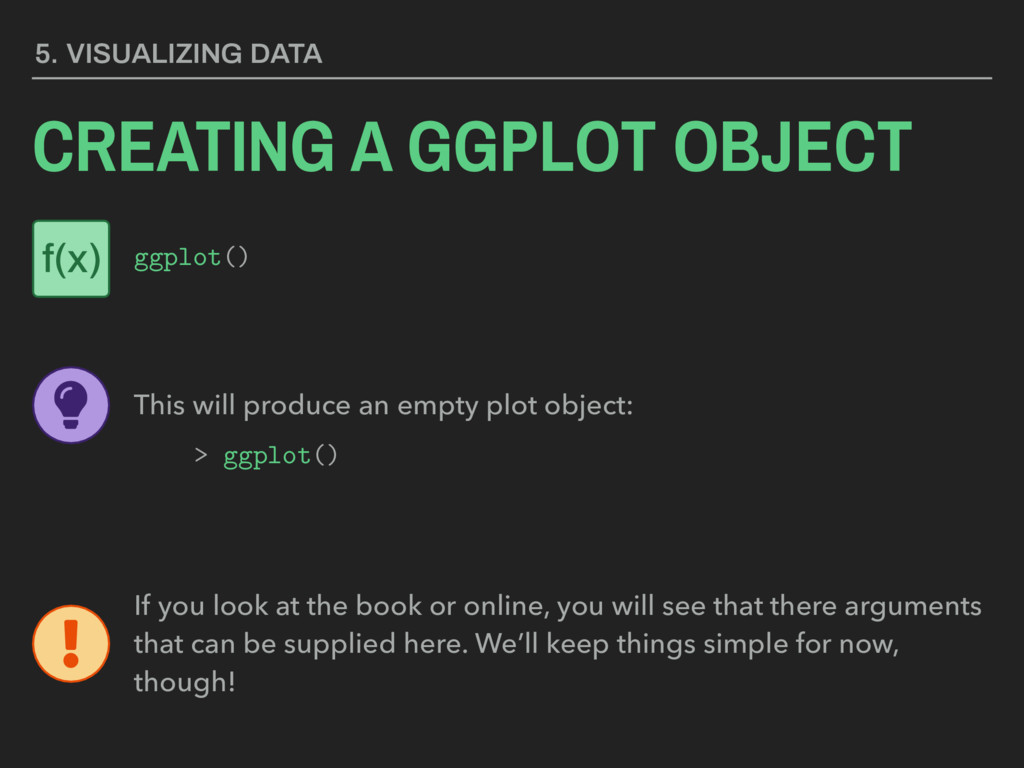
produce an empty plot object: > ggplot() If you look at the book or online, you will see that there arguments that can be supplied here. We’ll keep things simple for now, though! f(x)
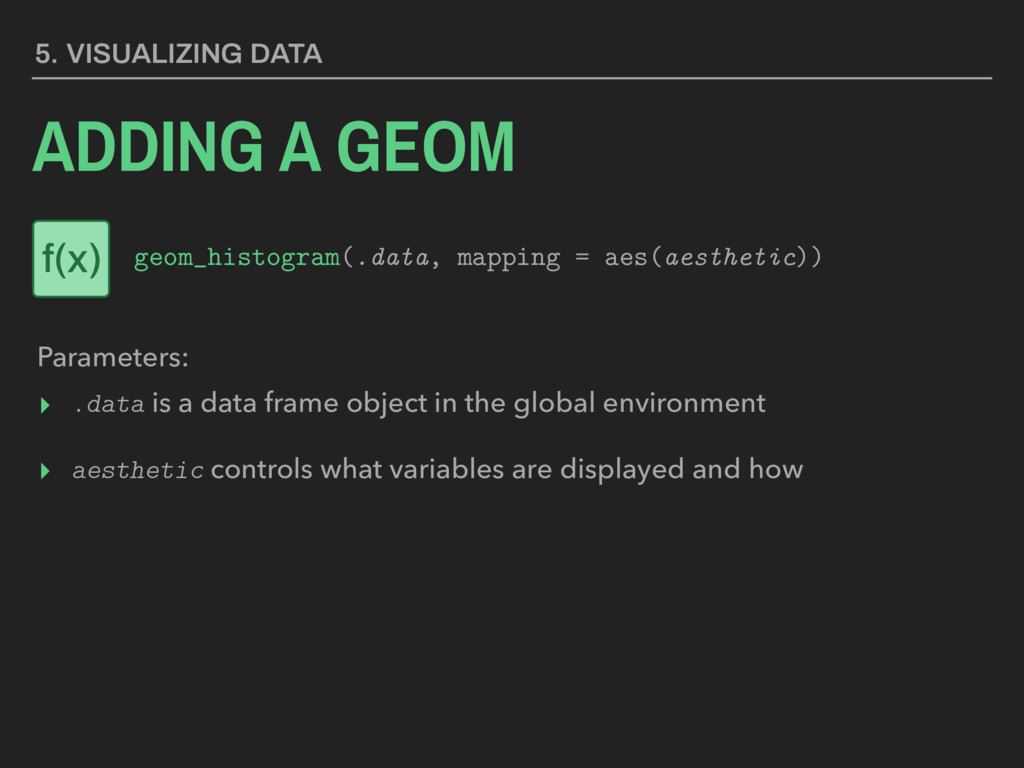
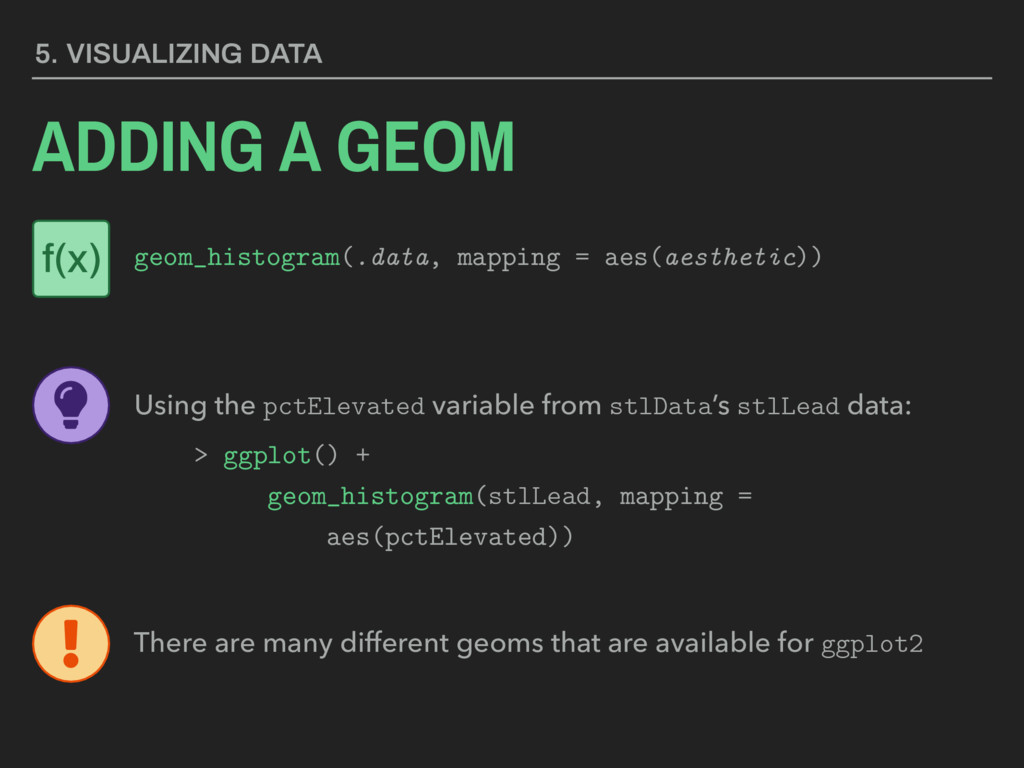
environment ▸ aesthetic controls what variables are displayed and how 5. VISUALIZING DATA ADDING A GEOM Parameters: geom_histogram(.data, mapping = aes(aesthetic)) f(x)
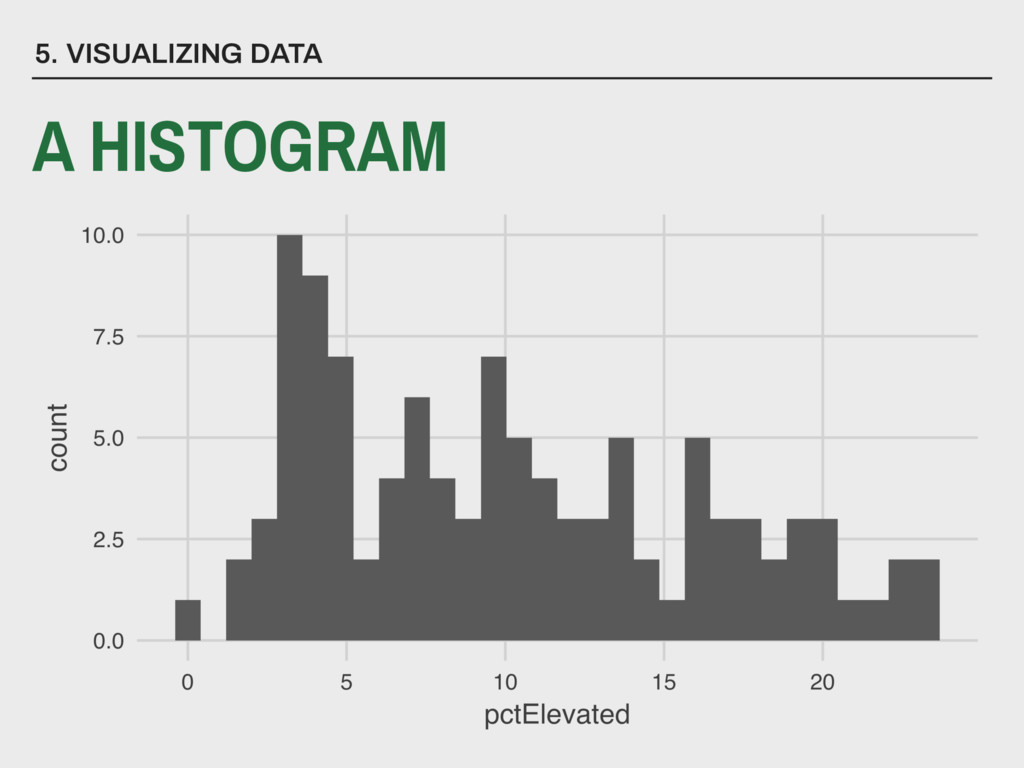
Using the pctElevated variable from stlData’s stlLead data: > ggplot() + geom_histogram(stlLead, mapping = aes(pctElevated)) There are many different geoms that are available for ggplot2 f(x)
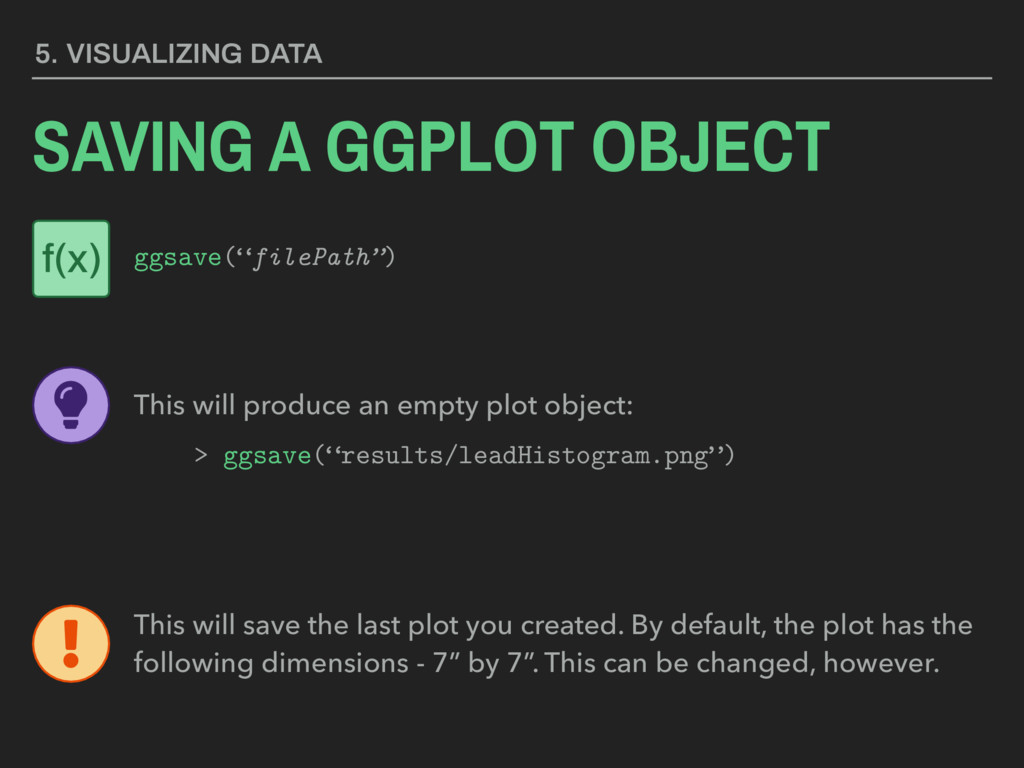
produce an empty plot object: > ggsave(“results/leadHistogram.png”) This will save the last plot you created. By default, the plot has the following dimensions - 7” by 7”. This can be changed, however. f(x)
& Public Policy discussion Pace beginning to pick- up - make sure you reach out if you have ?’s LP-01 grades returned via GitHub Final Project memo due next Monday Lab 01 and Lecture Prep 03 due next Monday SOC 5650 students need to sign-up for GIS & Public Policy days