Lecture slides for Lecture 01 of the Saint Louis University Course Quantitative Analysis: Applied Inferential Statistics. This lecture introduces core concepts related to analysis development, reproducibility, and quantitative research.
https://PollEv.com/chrisprener541 - you can skip creating a nickname! If you have not already completed the Course Onboarding and Course Preview tasks, please finish them! Details at: https://slu-soc5050.github.io/course-onboarding/ WELCOME! WELCOME TO SOC 4015 & 5050!
please submit asap! Details on course website. 1. FRONT MATTER ANNOUNCEMENTS We’ll start every class with “Front Matter” - goal is to share what we are covering, what due dates are coming up, and any announcements. No class next week, but there is coursework! Before Lecture-03: Lab-01, LP-03, Final Project Memo
▸ Curriculum advisor & lesson maintainer for The Carpentries’ Social Science and Geospatial Lessons ▸ Former EMT and EMS Dispatcher ▸ I wanted to be a ED physician once upon a time 1. FRONT MATTER ABOUT CHRIS
Sociology (Health/Diversity emphasis) • SOC 3220: Urban Sociology & The Wire • SOC 4650/5650: Intro to GIS • SLU Data Science Seminar 1. FRONT MATTER ABOUT CHRIS
system as a part of the social safety-net • Neighborhood order (and disorder) in St. Louis • Mental health outcomes, literacy, and discrimination • Approaches to processing “big” and complex data 1. FRONT MATTER ABOUT CHRIS
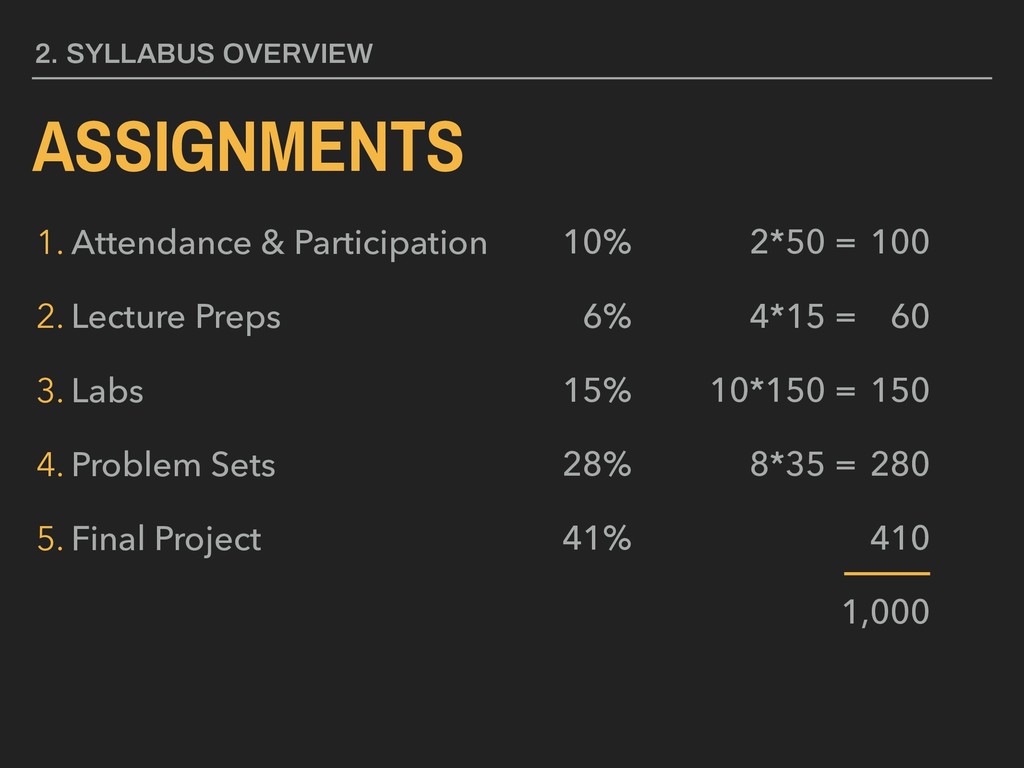
- Describe the use of various statistical tests, their requirements and assumptions, and their interpretation; execute these tests both by hand and programmatically using R 2. Fundamentals of Data Analysis 3. Fundamentals of Data Visualization 4. Quantitative Research Synthesis
2. Fundamentals of Data Analysis - Perform basic data cleaning and analysis tasks programmatically using R in ways that support high quality documentation and replication. 3. Fundamentals of Data Visualization 4. Quantitative Research Synthesis
2. Fundamentals of Data Analysis 3. Fundamentals of Data Visualization - Create and present publication quality plots programmatically using R and ggplot2. 4. Quantitative Research Synthesis
2. Fundamentals of Data Analysis 3. Fundamentals of Data Visualization 4. Quantitative Research Synthesis - Plan, implement (using R), and present (using knitr as well as the word processing and presentation applications of your choice) a research project that uses linear regression to answer a research question.
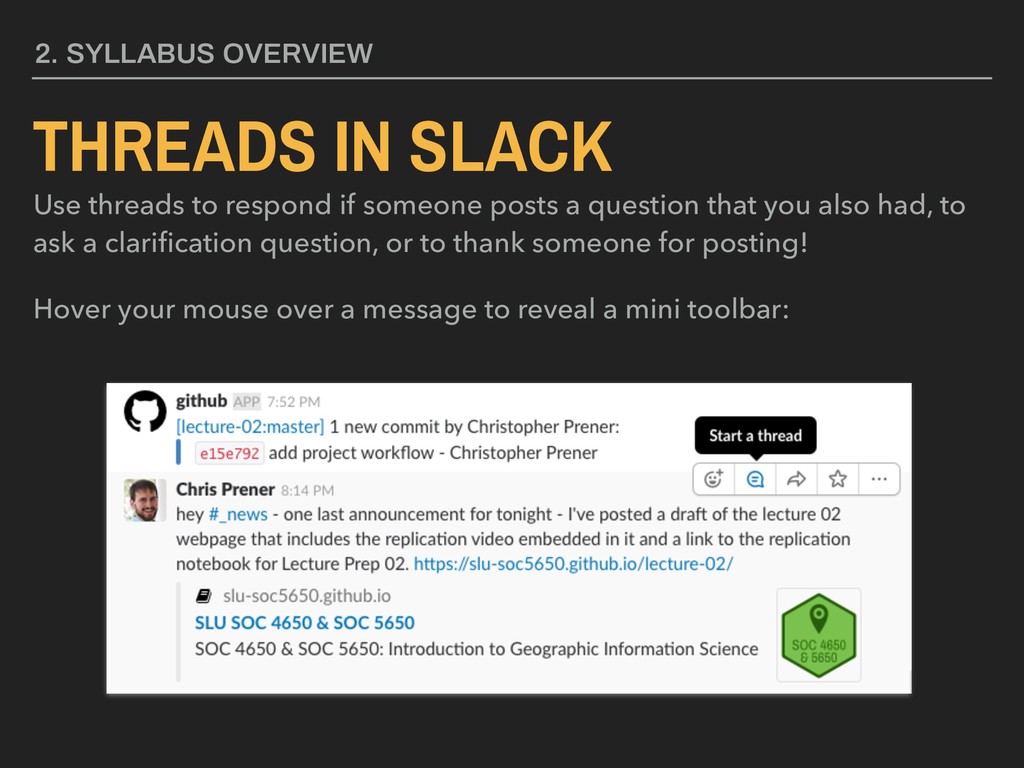
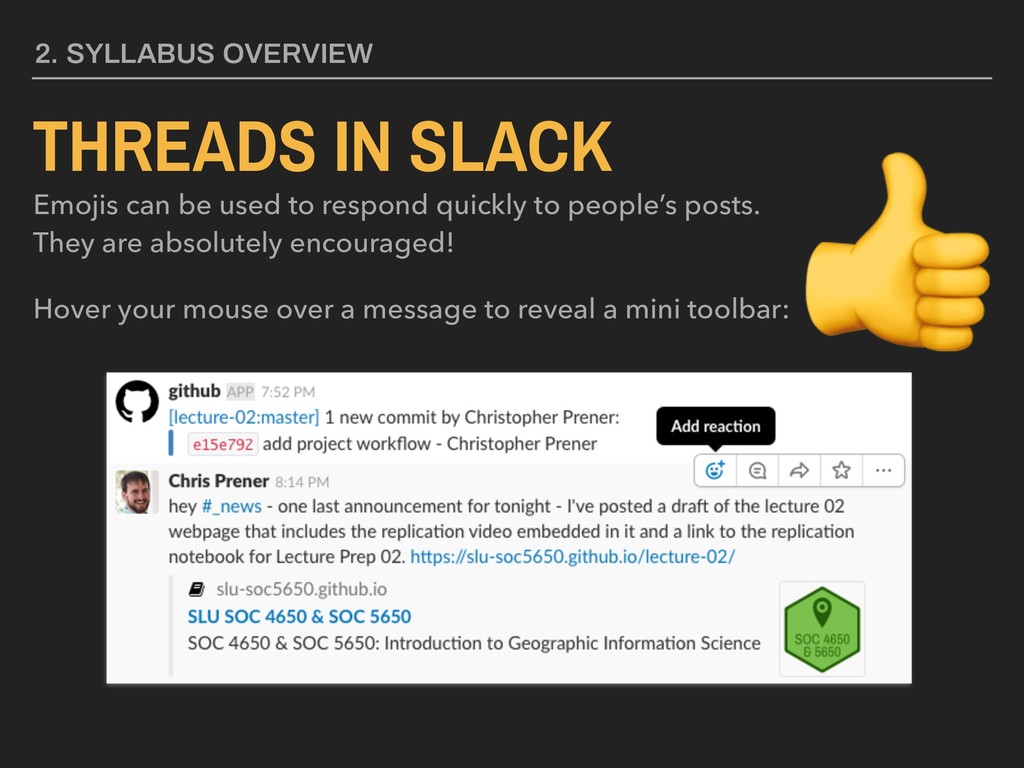
if someone posts a question that you also had, to ask a clarification question, or to thank someone for posting! Hover your mouse over a message to reveal a mini toolbar:
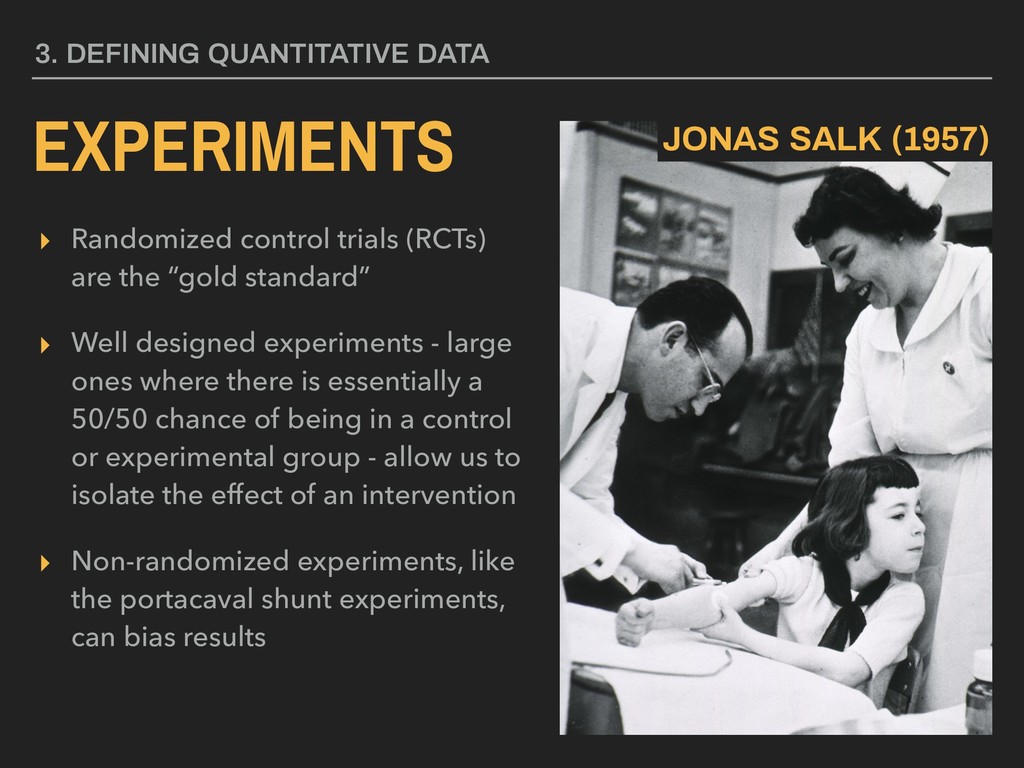
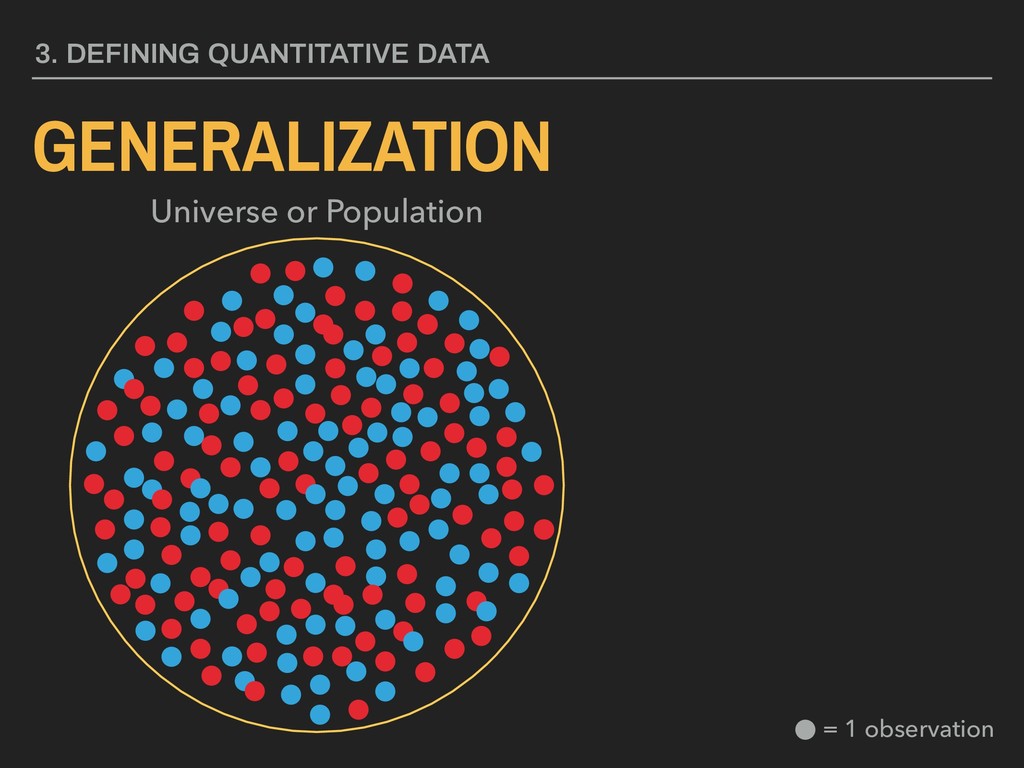
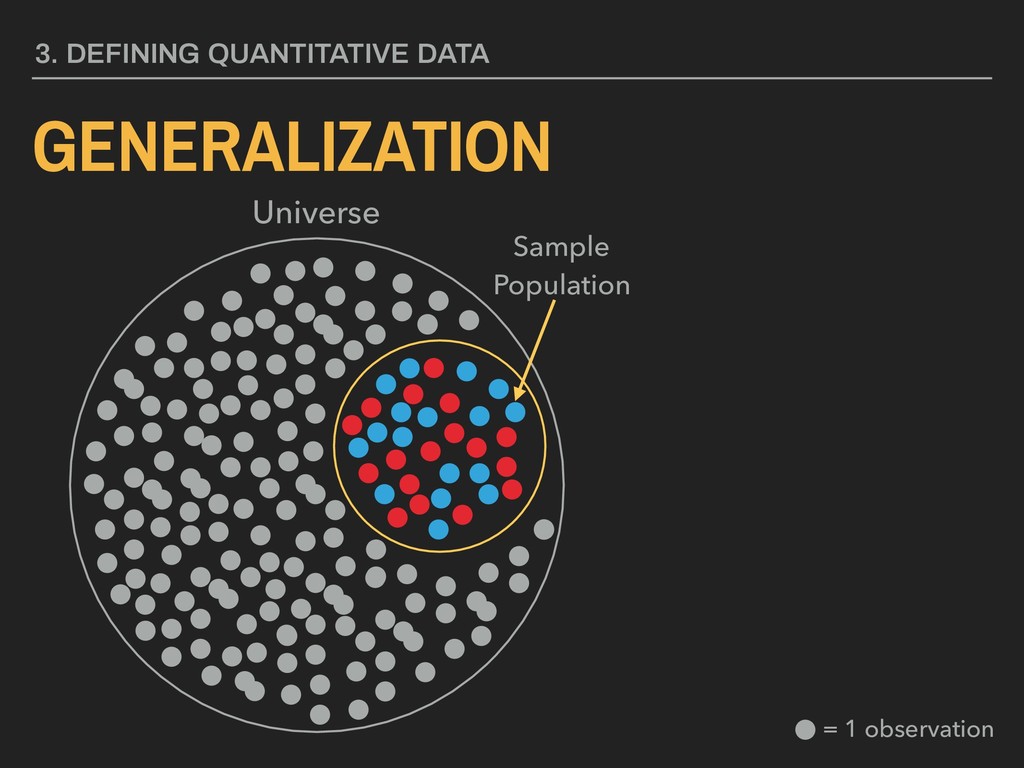
Well designed experiments - large ones where there is essentially a 50/50 chance of being in a control or experimental group - allow us to isolate the effect of an intervention ▸ Non-randomized experiments, like the portacaval shunt experiments, can bias results 3. DEFINING QUANTITATIVE DATA EXPERIMENTS JONAS SALK (1957)
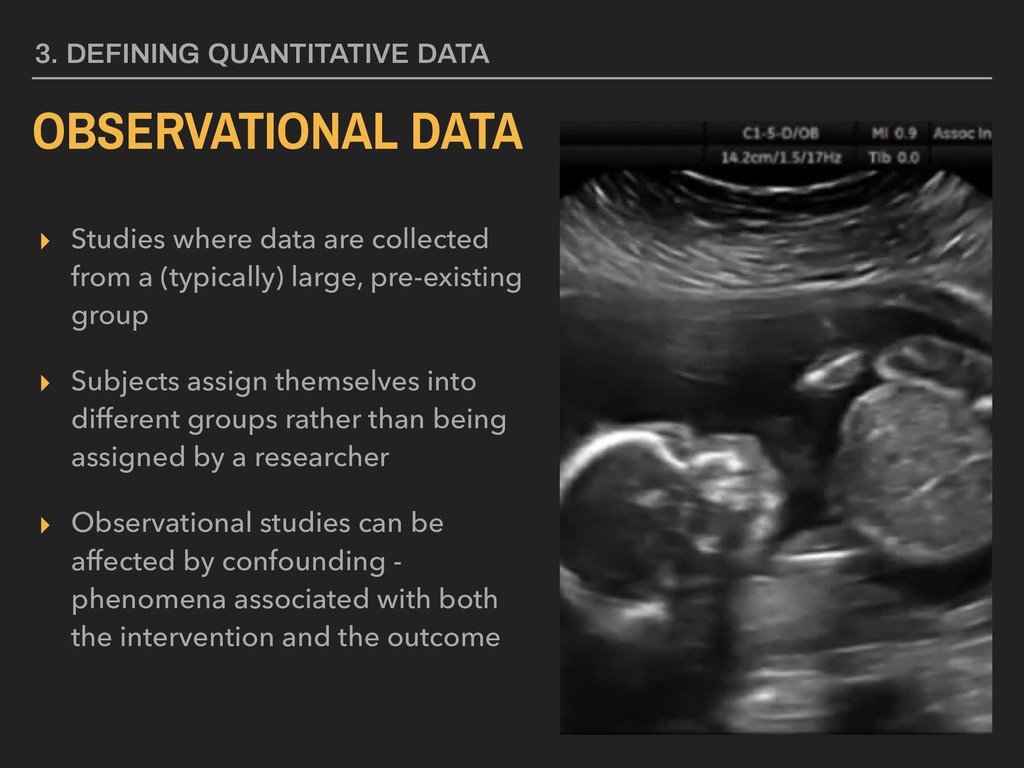
pre-existing group ▸ Subjects assign themselves into different groups rather than being assigned by a researcher ▸ Observational studies can be affected by confounding - phenomena associated with both the intervention and the outcome 3. DEFINING QUANTITATIVE DATA OBSERVATIONAL DATA
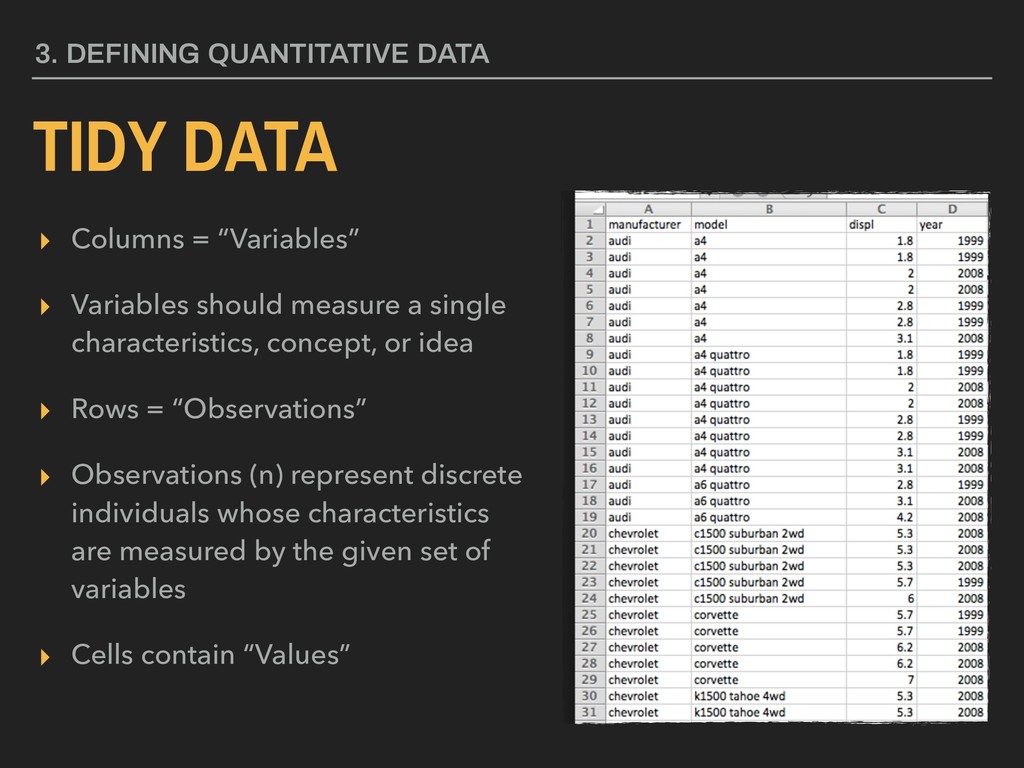
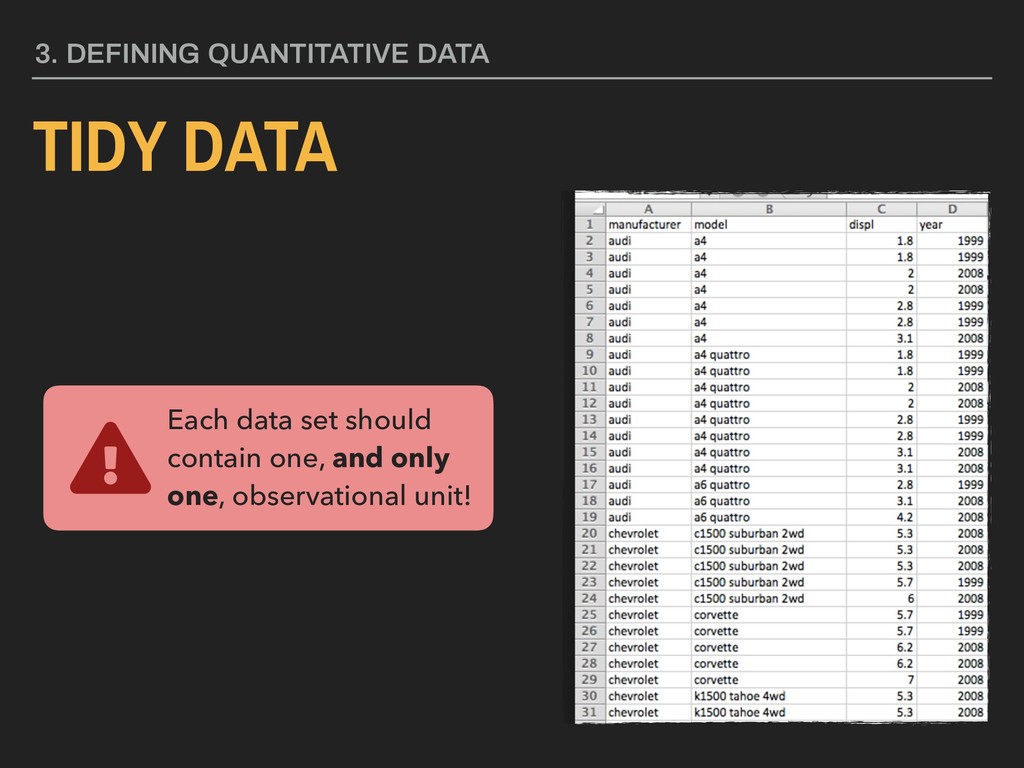
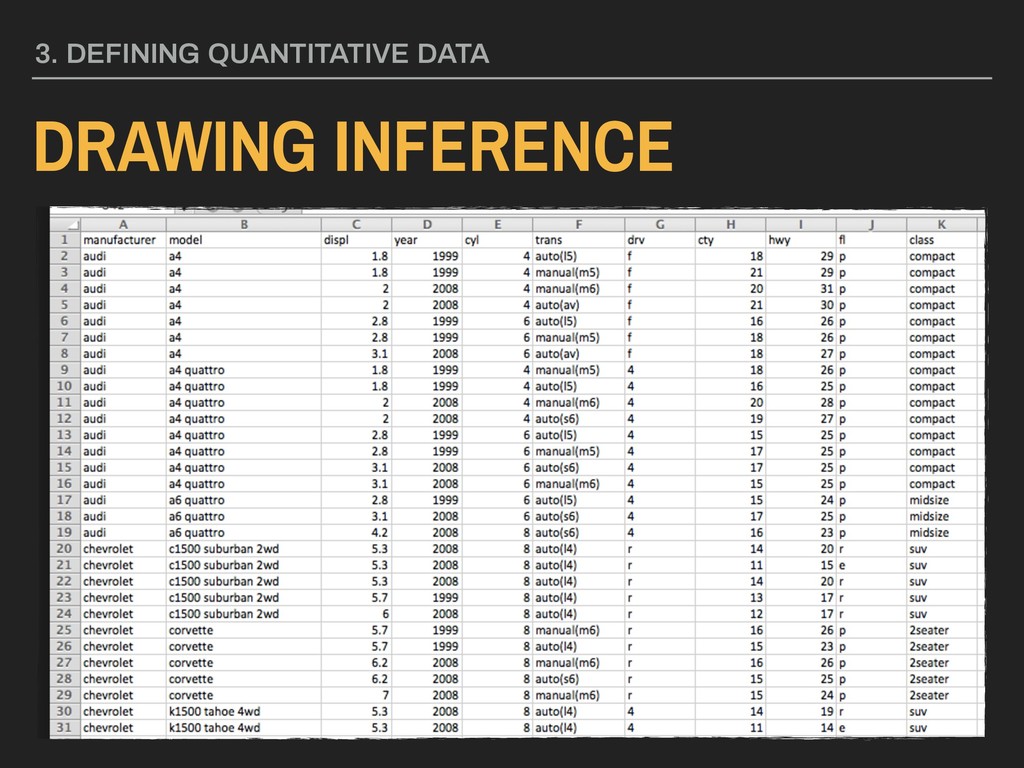
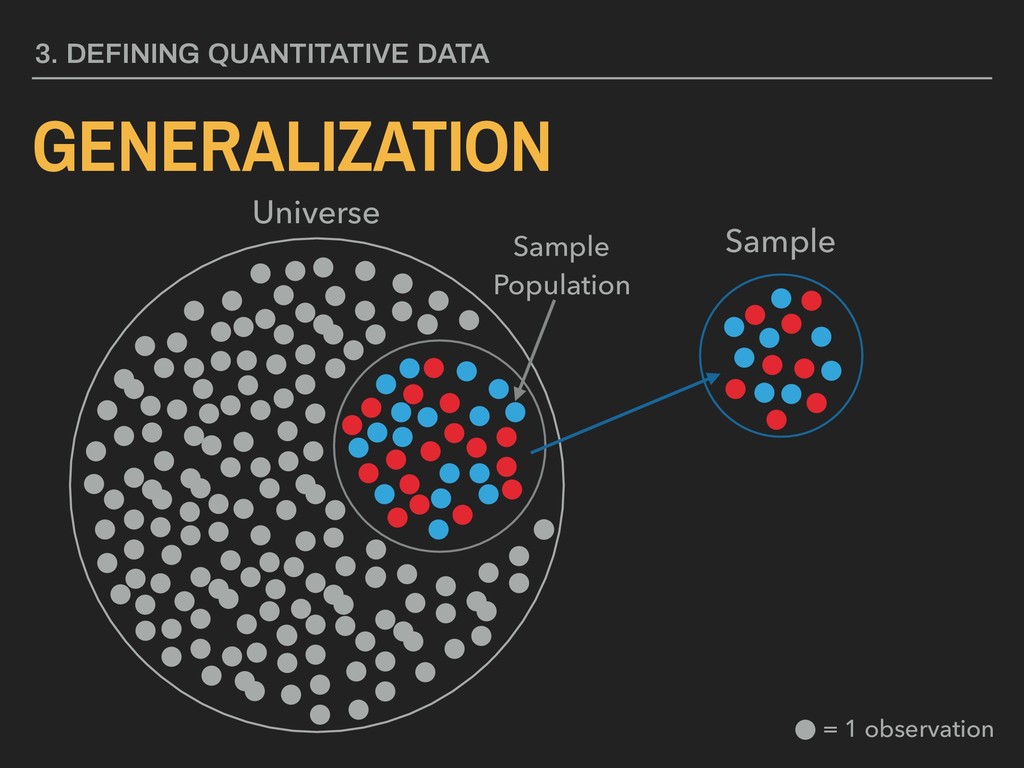
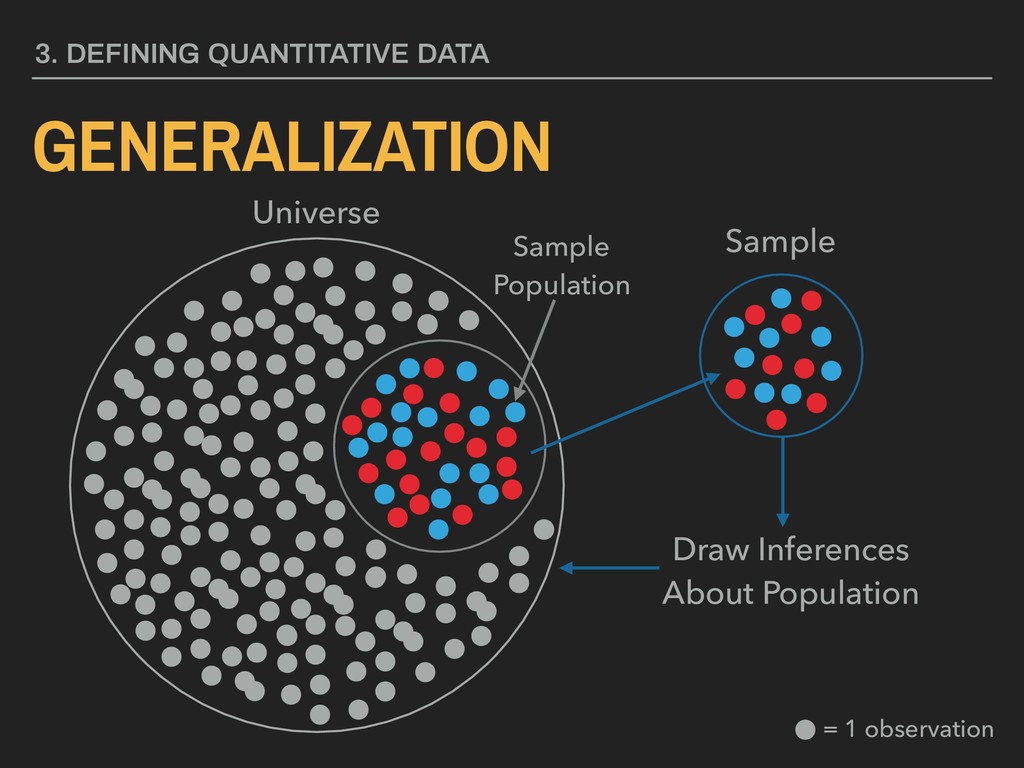
characteristics, concept, or idea ▸ Rows = “Observations” ▸ Observations (n) represent discrete individuals whose characteristics are measured by the given set of variables ▸ Cells contain “Values” 3. DEFINING QUANTITATIVE DATA TIDY DATA
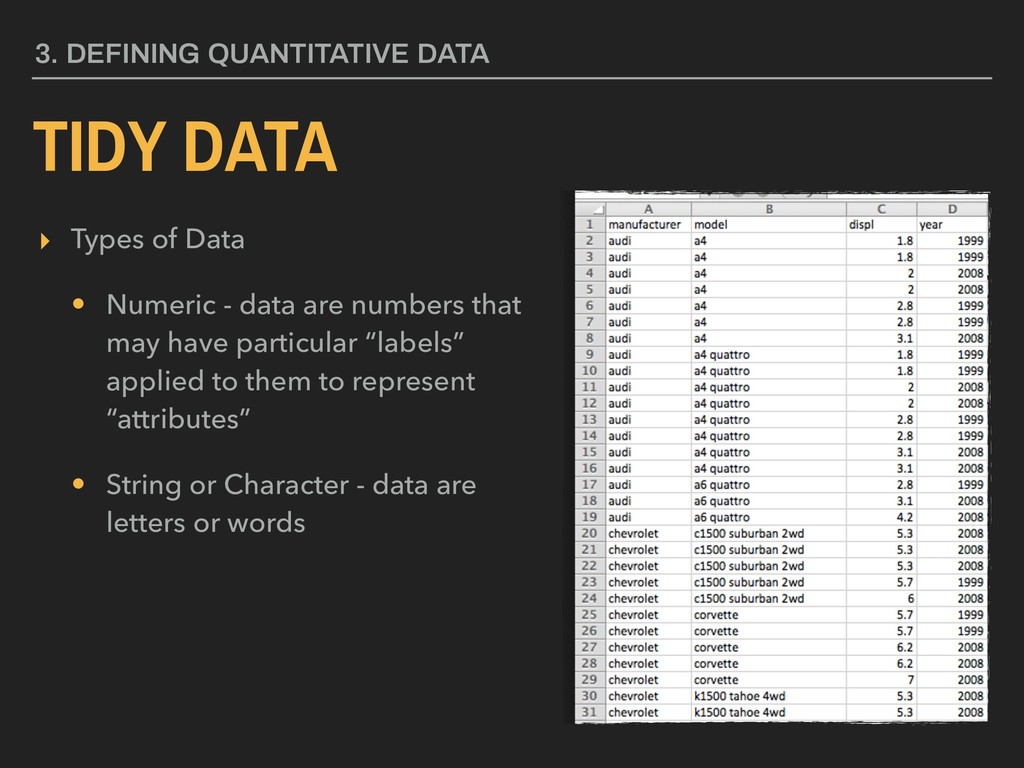
that may have particular “labels” applied to them to represent “attributes” • String or Character - data are letters or words 3. DEFINING QUANTITATIVE DATA TIDY DATA
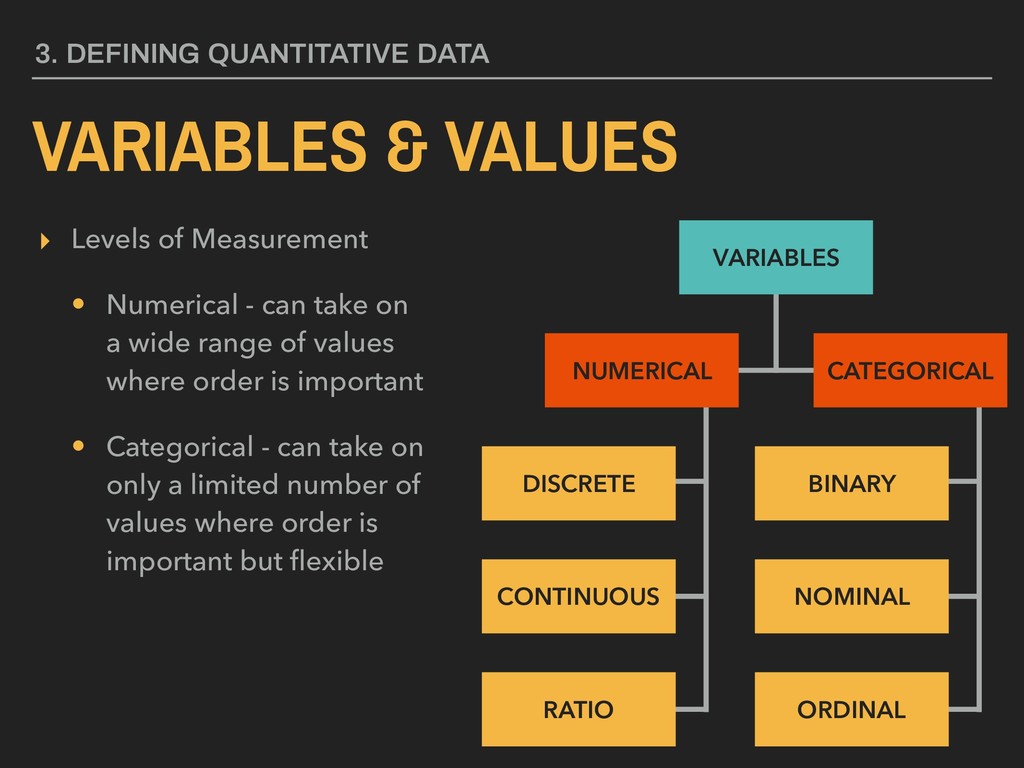
a wide range of values where order is important • Categorical - can take on only a limited number of values where order is important but flexible 3. DEFINING QUANTITATIVE DATA VARIABLES & VALUES NUMERICAL CATEGORICAL DISCRETE CONTINUOUS BINARY NOMINAL ORDINAL RATIO VARIABLES
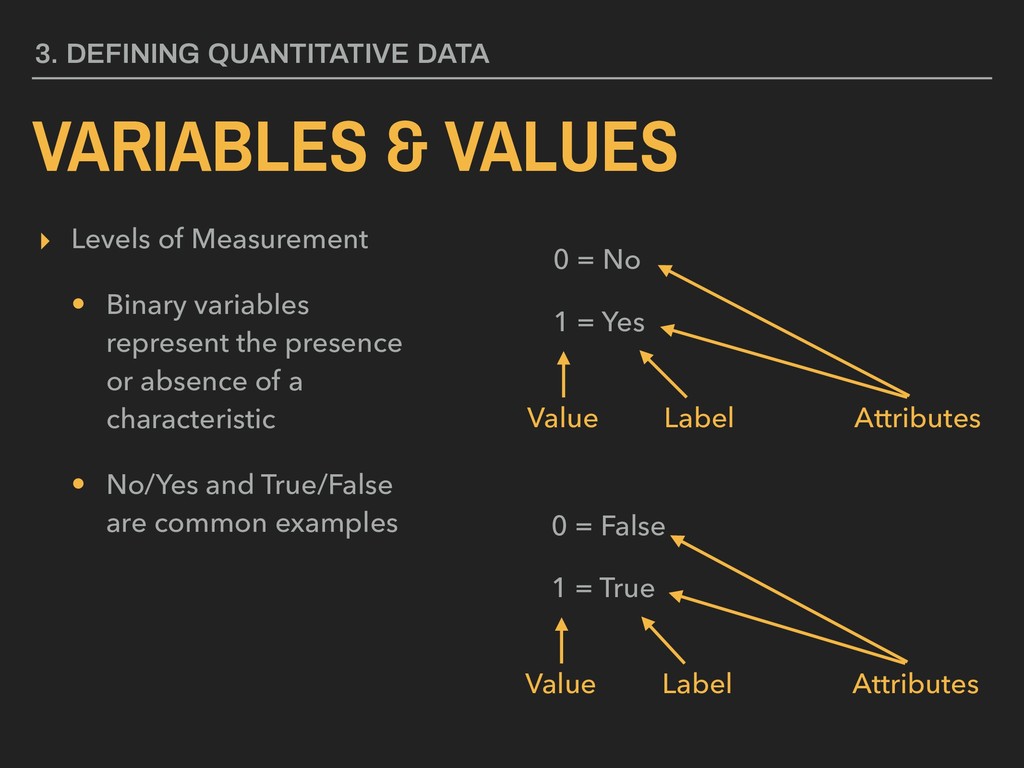
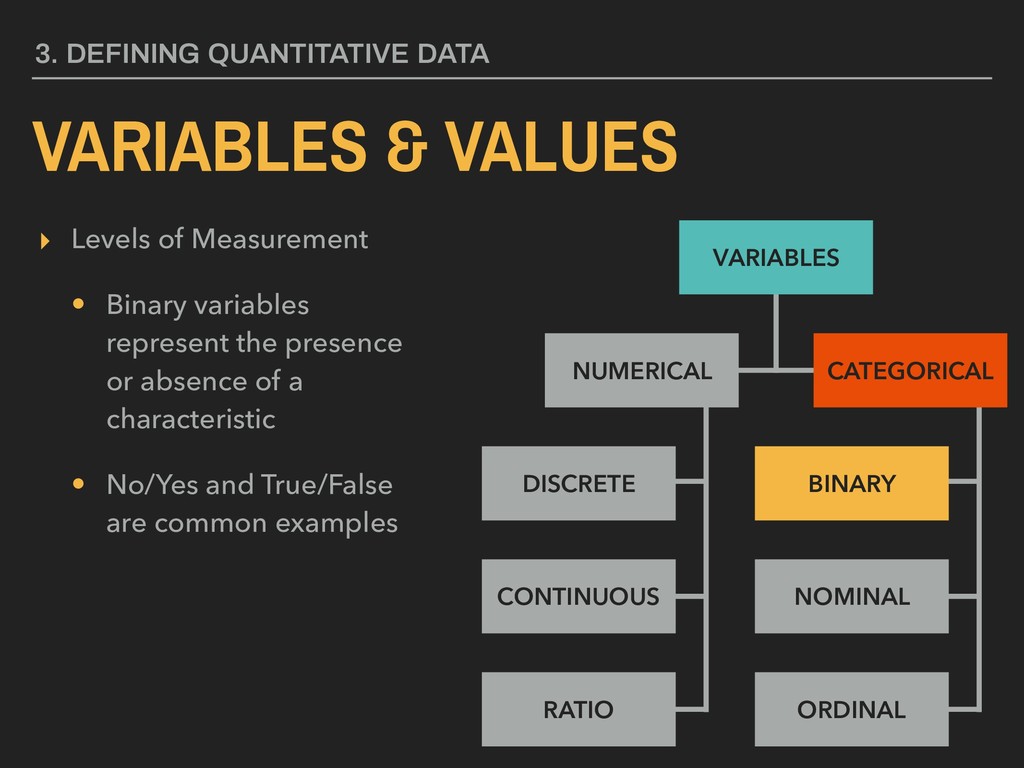
or absence of a characteristic • No/Yes and True/False are common examples 3. DEFINING QUANTITATIVE DATA VARIABLES & VALUES NUMERICAL CATEGORICAL DISCRETE CONTINUOUS BINARY NOMINAL ORDINAL RATIO VARIABLES
or absence of a characteristic • No/Yes and True/False are common examples 3. DEFINING QUANTITATIVE DATA VARIABLES & VALUES 0 = No 1 = Yes Value Label Attributes 0 = False 1 = True Value Label Attributes
or absence of a characteristic • No/Yes and True/False are common examples 3. DEFINING QUANTITATIVE DATA VARIABLES & VALUES NUMERICAL CATEGORICAL DISCRETE CONTINUOUS BINARY NOMINAL ORDINAL RATIO VARIABLES
or absence of a characteristic • No/Yes and True/False are common examples • Sometimes called “dummy” or “logical” variables 3. DEFINING QUANTITATIVE DATA VARIABLES & VALUES NUMERICAL CATEGORICAL DISCRETE CONTINUOUS LOGICAL NOMINAL ORDINAL RATIO VARIABLES
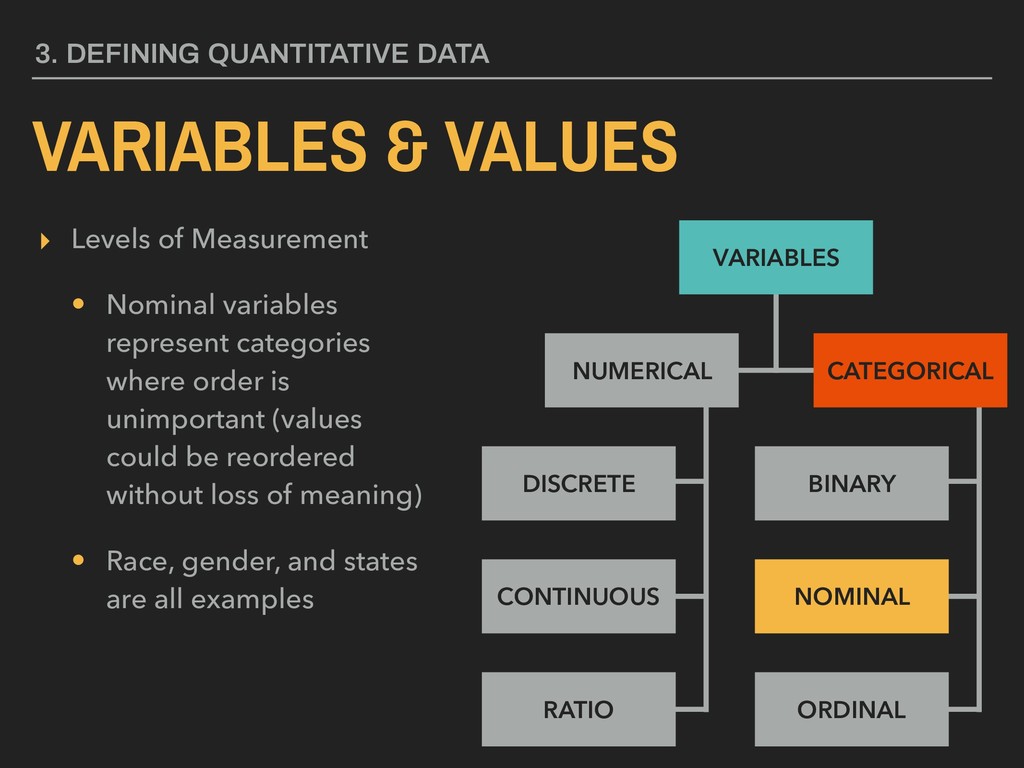
order is unimportant (values could be reordered without loss of meaning) • Race, gender, and states are all examples 3. DEFINING QUANTITATIVE DATA VARIABLES & VALUES NUMERICAL CATEGORICAL DISCRETE CONTINUOUS BINARY NOMINAL ORDINAL RATIO VARIABLES
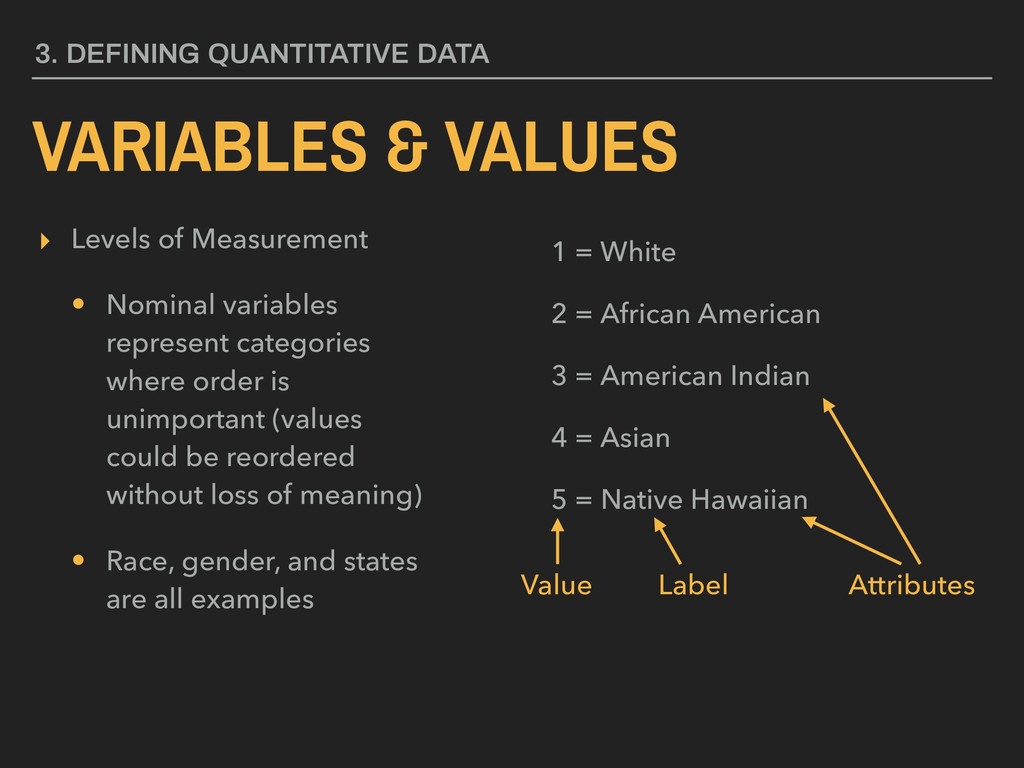
order is unimportant (values could be reordered without loss of meaning) • Race, gender, and states are all examples 3. DEFINING QUANTITATIVE DATA VARIABLES & VALUES 1 = White 2 = African American 3 = American Indian 4 = Asian 5 = Native Hawaiian Value Label Attributes
order is unimportant (values could be reordered without loss of meaning) • Race, gender, and states are all examples 3. DEFINING QUANTITATIVE DATA VARIABLES & VALUES NUMERICAL CATEGORICAL DISCRETE CONTINUOUS BINARY NOMINAL ORDINAL RATIO VARIABLES
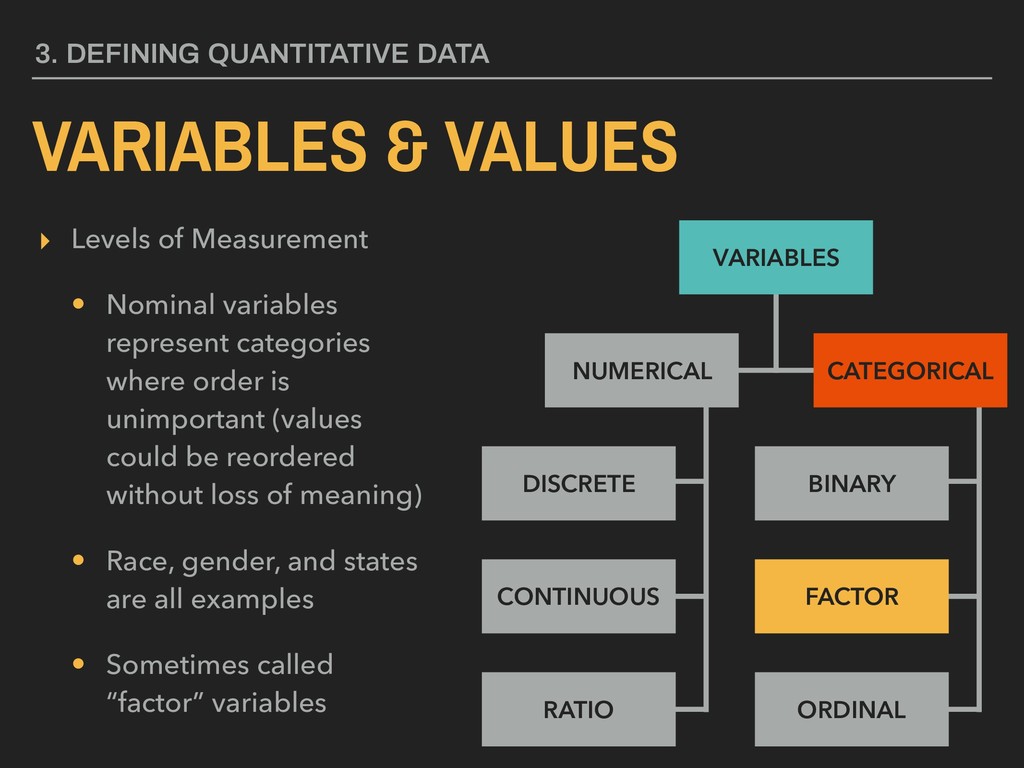
order is unimportant (values could be reordered without loss of meaning) • Race, gender, and states are all examples • Sometimes called “factor” variables 3. DEFINING QUANTITATIVE DATA VARIABLES & VALUES NUMERICAL CATEGORICAL DISCRETE CONTINUOUS BINARY FACTOR ORDINAL RATIO VARIABLES
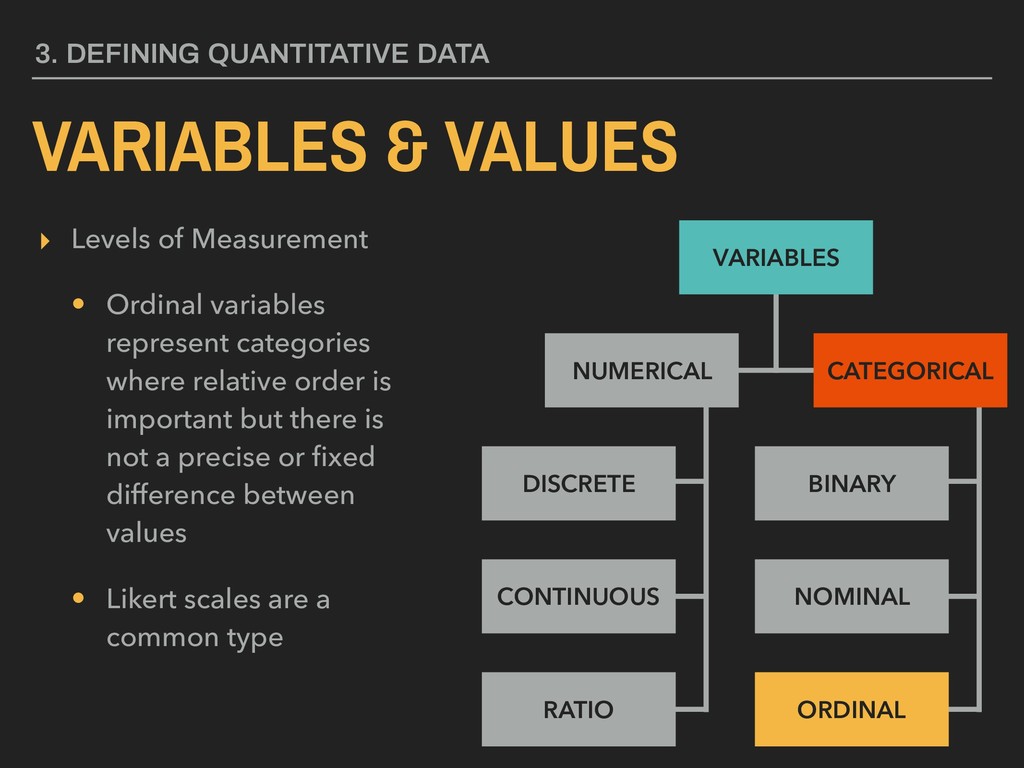
relative order is important but there is not a precise or fixed difference between values • Likert scales are a common type 3. DEFINING QUANTITATIVE DATA VARIABLES & VALUES NUMERICAL CATEGORICAL DISCRETE CONTINUOUS BINARY NOMINAL ORDINAL RATIO VARIABLES
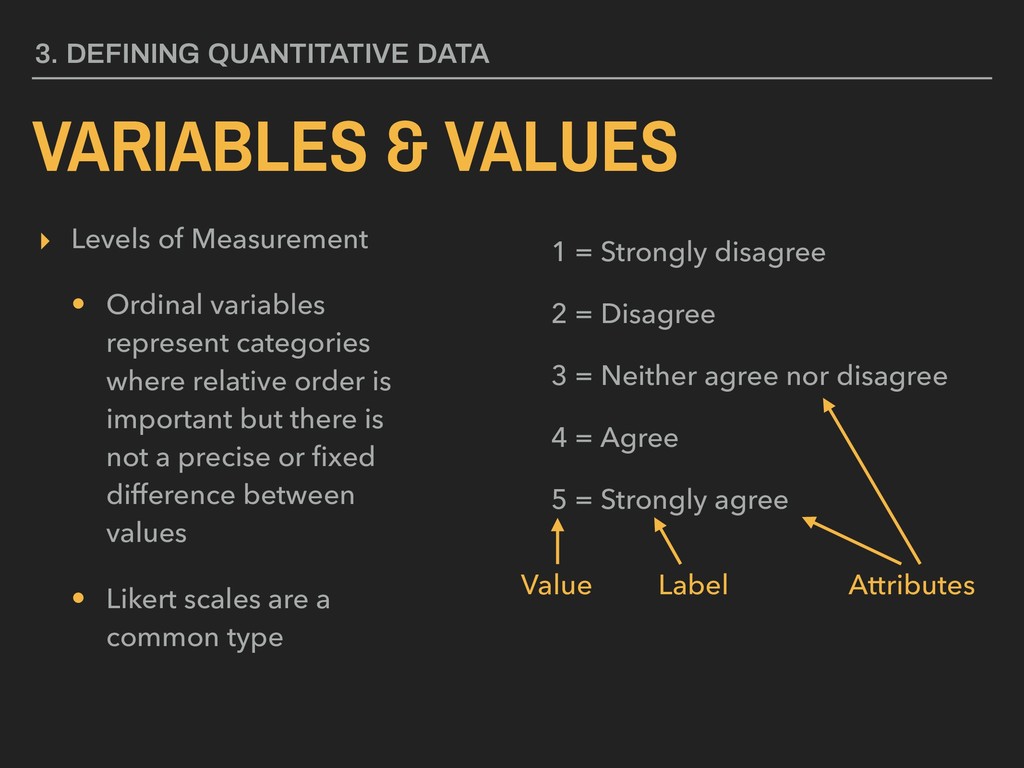
relative order is important but there is not a precise or fixed difference between values • Likert scales are a common type 3. DEFINING QUANTITATIVE DATA VARIABLES & VALUES 1 = Strongly disagree 2 = Disagree 3 = Neither agree nor disagree 4 = Agree 5 = Strongly agree Value Label Attributes
relative order is important but there is not a precise or fixed difference between values • Likert scales are a common type 3. DEFINING QUANTITATIVE DATA VARIABLES & VALUES NUMERICAL CATEGORICAL DISCRETE CONTINUOUS BINARY NOMINAL ORDINAL RATIO VARIABLES
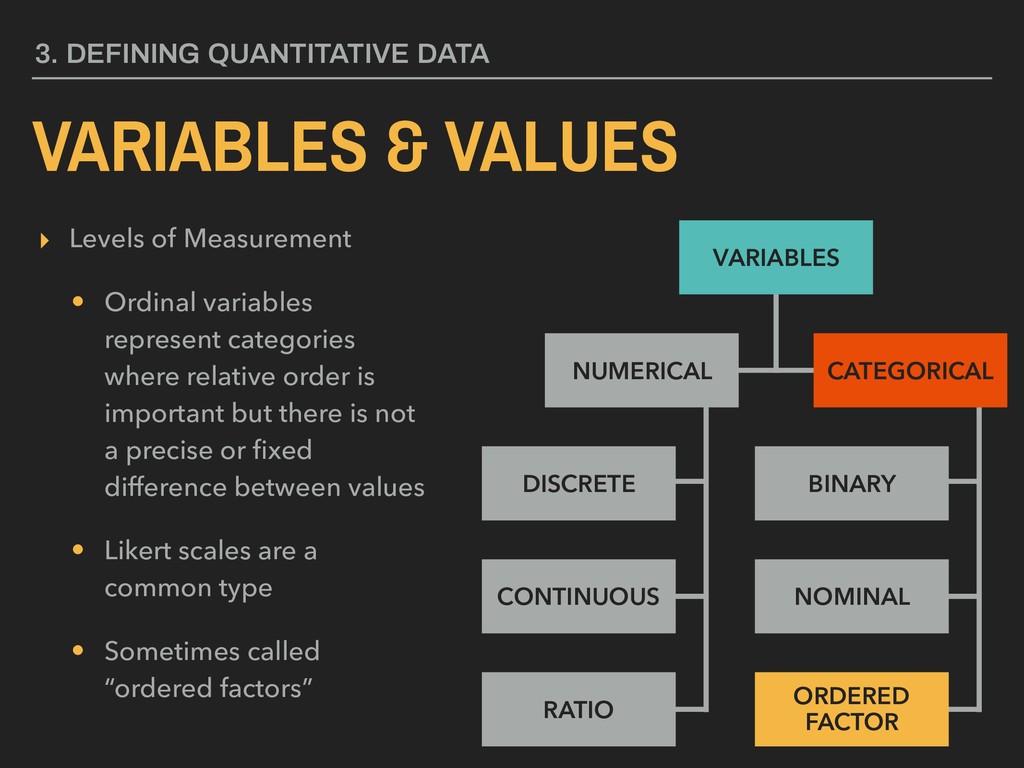
relative order is important but there is not a precise or fixed difference between values • Likert scales are a common type • Sometimes called “ordered factors” 3. DEFINING QUANTITATIVE DATA VARIABLES & VALUES NUMERICAL CATEGORICAL DISCRETE CONTINUOUS BINARY NOMINAL ORDERED FACTOR RATIO VARIABLES
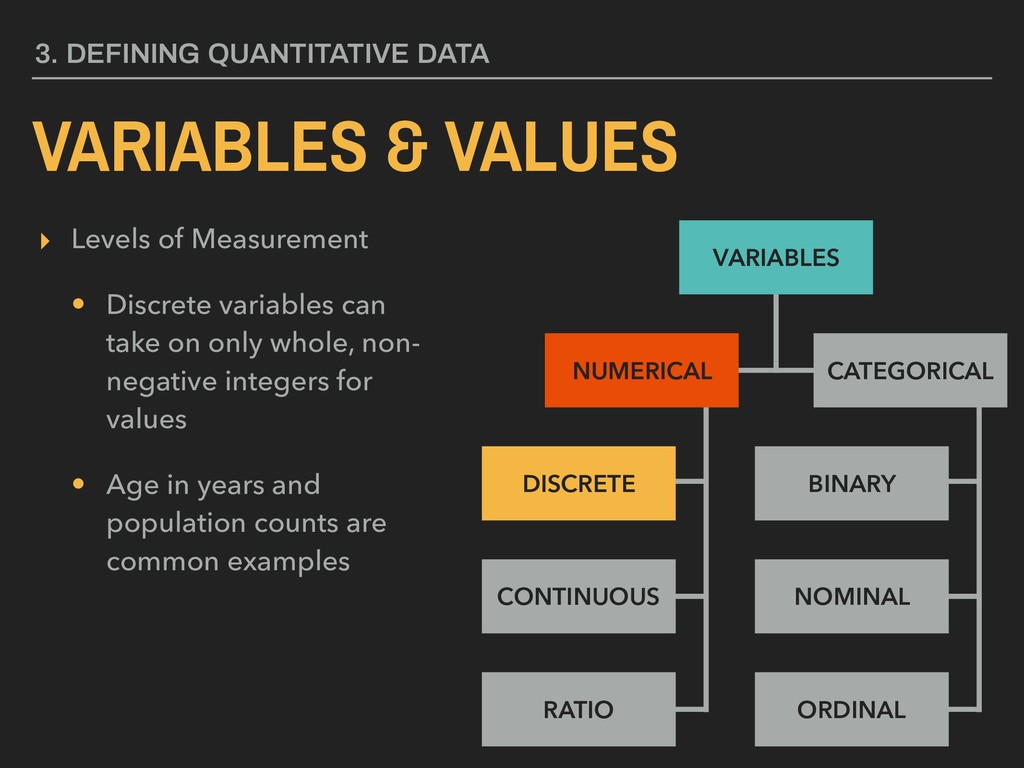
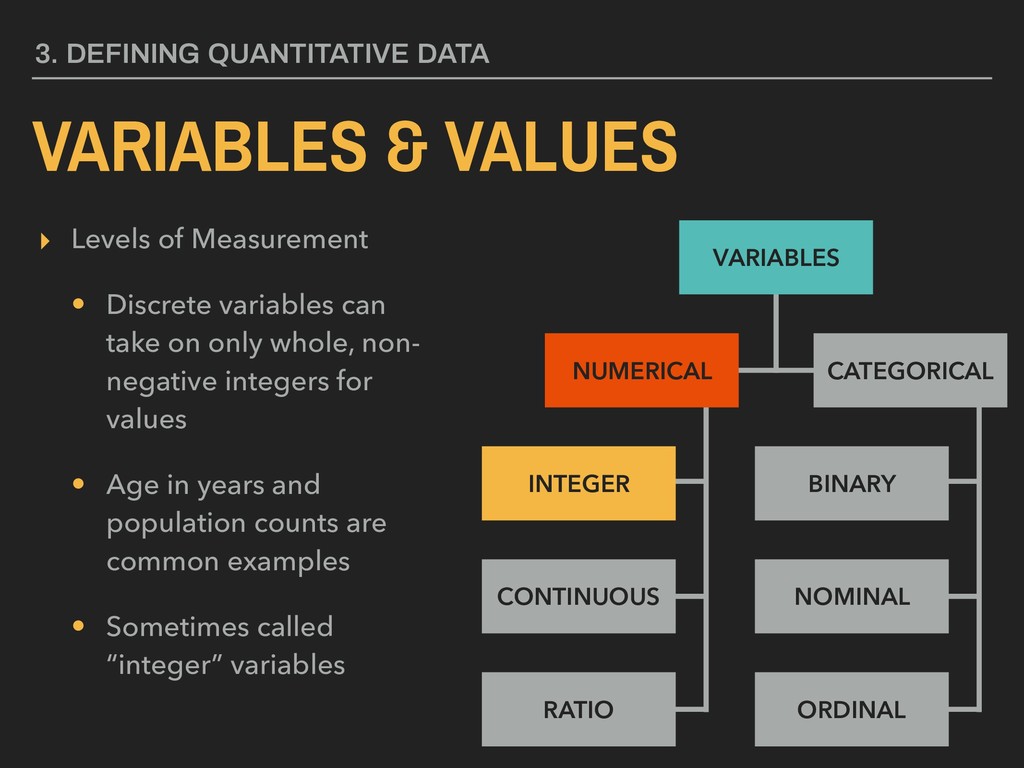
only whole, non- negative integers for values • Age in years and population counts are common examples 3. DEFINING QUANTITATIVE DATA VARIABLES & VALUES NUMERICAL CATEGORICAL DISCRETE CONTINUOUS BINARY NOMINAL ORDINAL RATIO VARIABLES
only whole, non- negative integers for values • Age in years and population counts are common examples 3. DEFINING QUANTITATIVE DATA VARIABLES & VALUES Age: 0, 1, 2, … k Value Last Possible Value
only whole, non- negative integers for values • Age in years and population counts are common examples 3. DEFINING QUANTITATIVE DATA VARIABLES & VALUES NUMERICAL CATEGORICAL DISCRETE CONTINUOUS BINARY NOMINAL ORDINAL RATIO VARIABLES
only whole, non- negative integers for values • Age in years and population counts are common examples • Sometimes called “integer” variables 3. DEFINING QUANTITATIVE DATA VARIABLES & VALUES NUMERICAL CATEGORICAL INTEGER CONTINUOUS BINARY NOMINAL ORDINAL RATIO VARIABLES
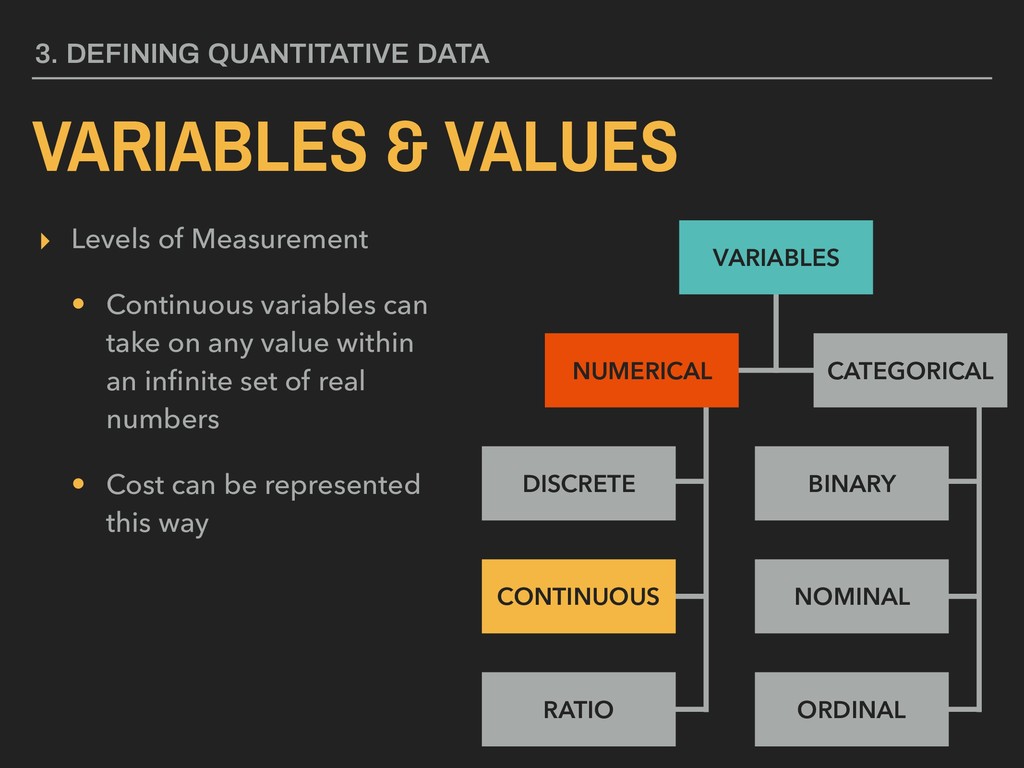
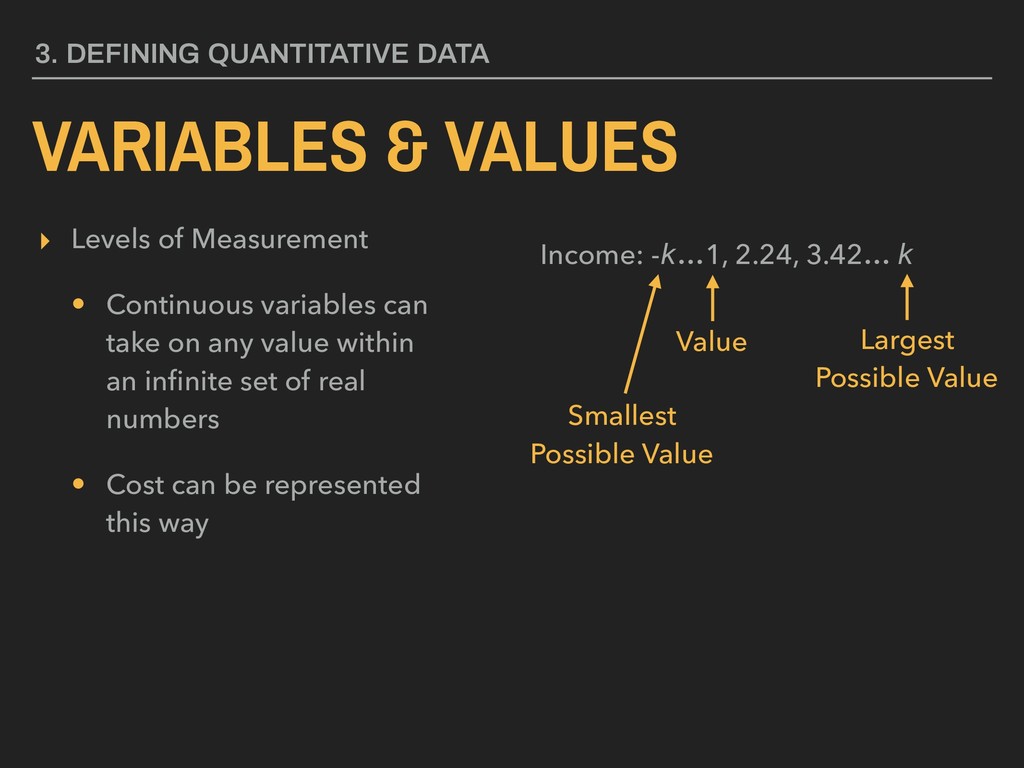
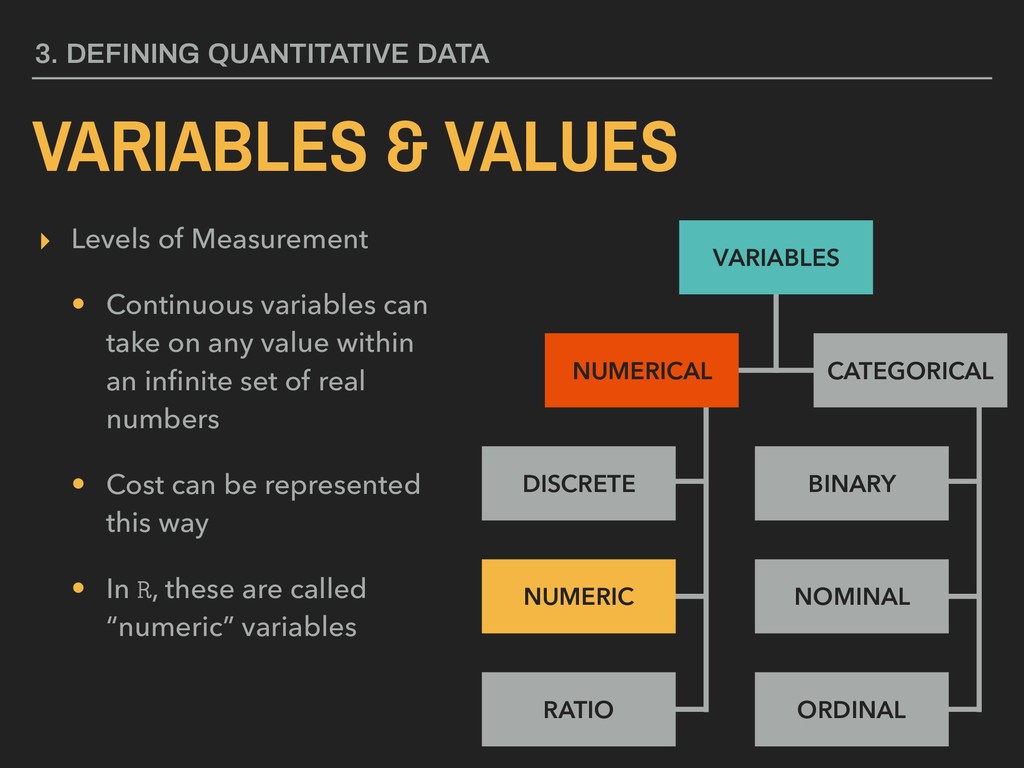
any value within an infinite set of real numbers • Cost can be represented this way 3. DEFINING QUANTITATIVE DATA VARIABLES & VALUES NUMERICAL CATEGORICAL DISCRETE CONTINUOUS BINARY NOMINAL ORDINAL RATIO VARIABLES
any value within an infinite set of real numbers • Cost can be represented this way 3. DEFINING QUANTITATIVE DATA VARIABLES & VALUES Income: -k…1, 2.24, 3.42… k Value Largest Possible Value Smallest Possible Value
any value within an infinite set of real numbers • Cost can be represented this way 3. DEFINING QUANTITATIVE DATA VARIABLES & VALUES NUMERICAL CATEGORICAL DISCRETE CONTINUOUS BINARY NOMINAL ORDINAL RATIO VARIABLES
any value within an infinite set of real numbers • Cost can be represented this way • In R, these are called “numeric” variables 3. DEFINING QUANTITATIVE DATA VARIABLES & VALUES NUMERICAL CATEGORICAL DISCRETE NUMERIC BINARY NOMINAL ORDINAL RATIO VARIABLES
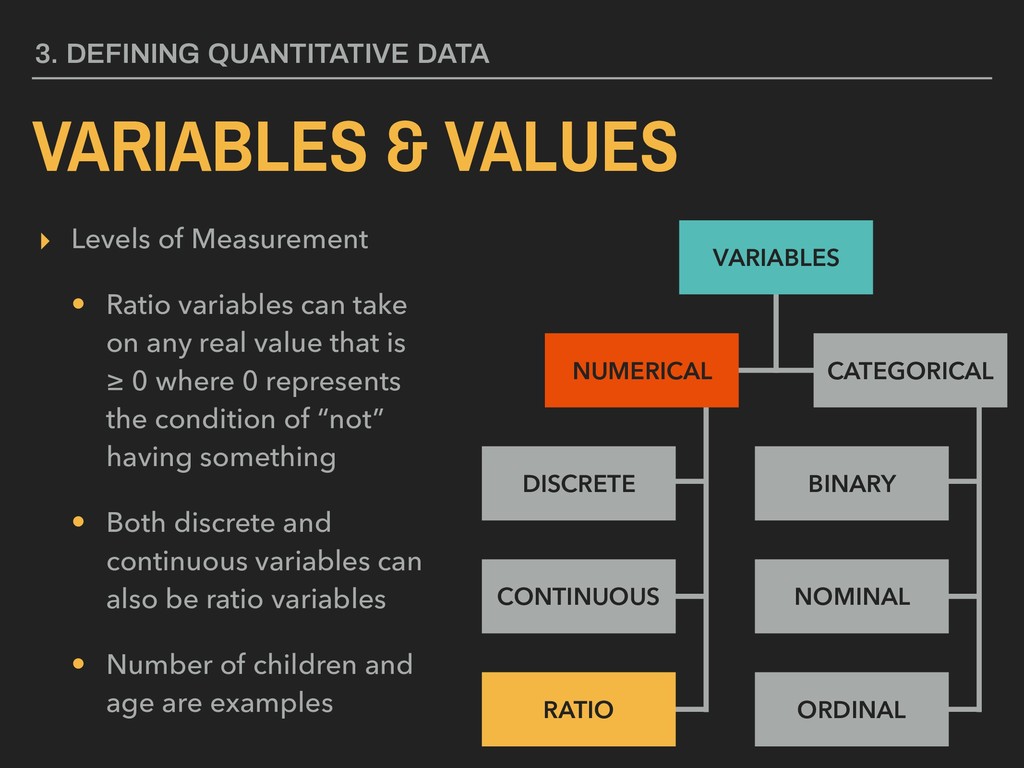
any real value that is ≥ 0 where 0 represents the condition of “not” having something • Both discrete and continuous variables can also be ratio variables • Number of children and age are examples 3. DEFINING QUANTITATIVE DATA VARIABLES & VALUES NUMERICAL CATEGORICAL DISCRETE CONTINUOUS BINARY NOMINAL ORDINAL RATIO VARIABLES
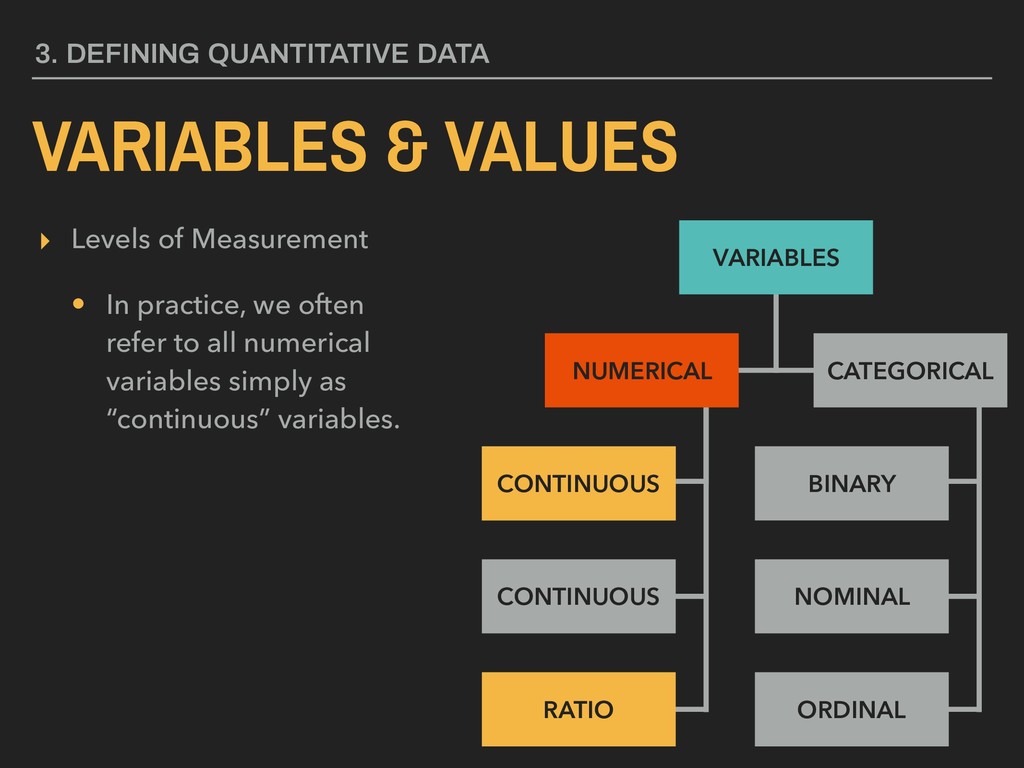
to all numerical variables simply as “continuous” variables. 3. DEFINING QUANTITATIVE DATA VARIABLES & VALUES CATEGORICAL DISCRETE CONTINUOUS BINARY NOMINAL ORDINAL RATIO VARIABLES NUMERICAL CONTINUOUS
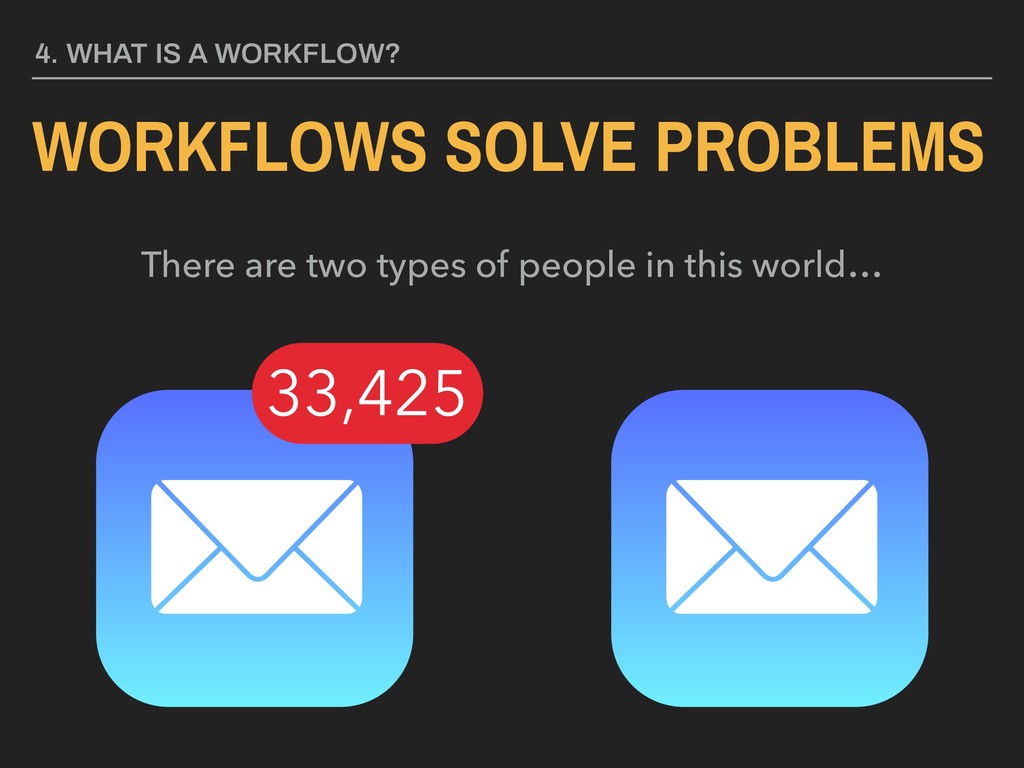
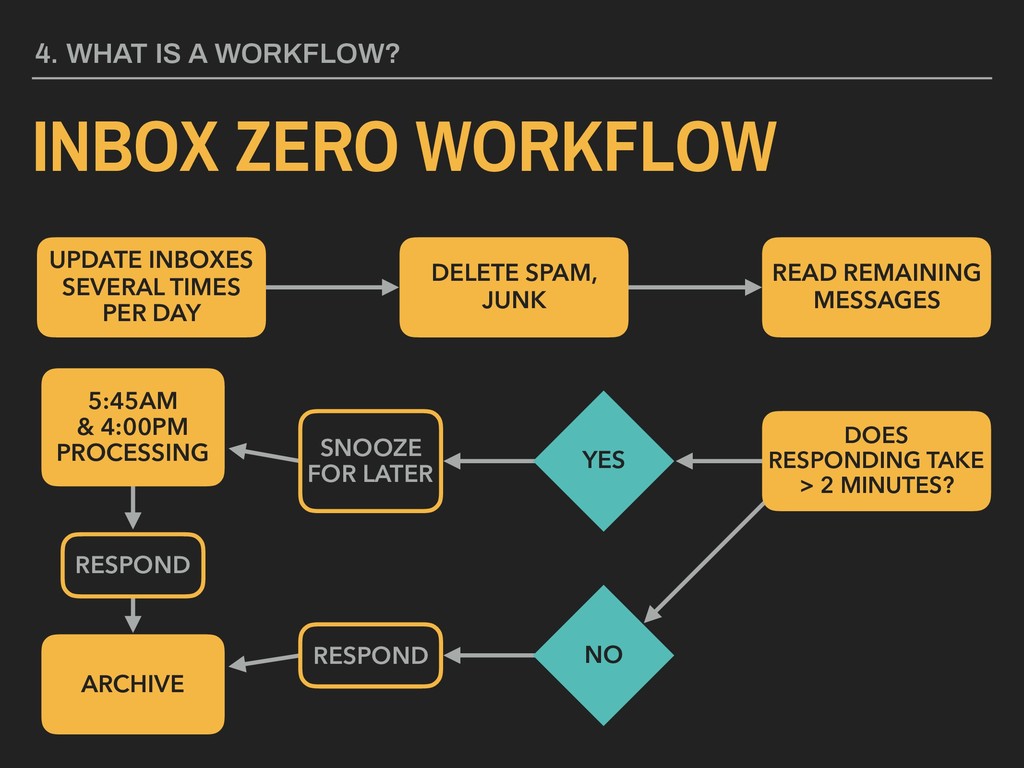
SEVERAL TIMES PER DAY DELETE SPAM, JUNK READ REMAINING MESSAGES DOES RESPONDING TAKE > 2 MINUTES? RESPOND YES SNOOZE FOR LATER 5:45AM & 4:00PM PROCESSING ARCHIVE RESPOND NO
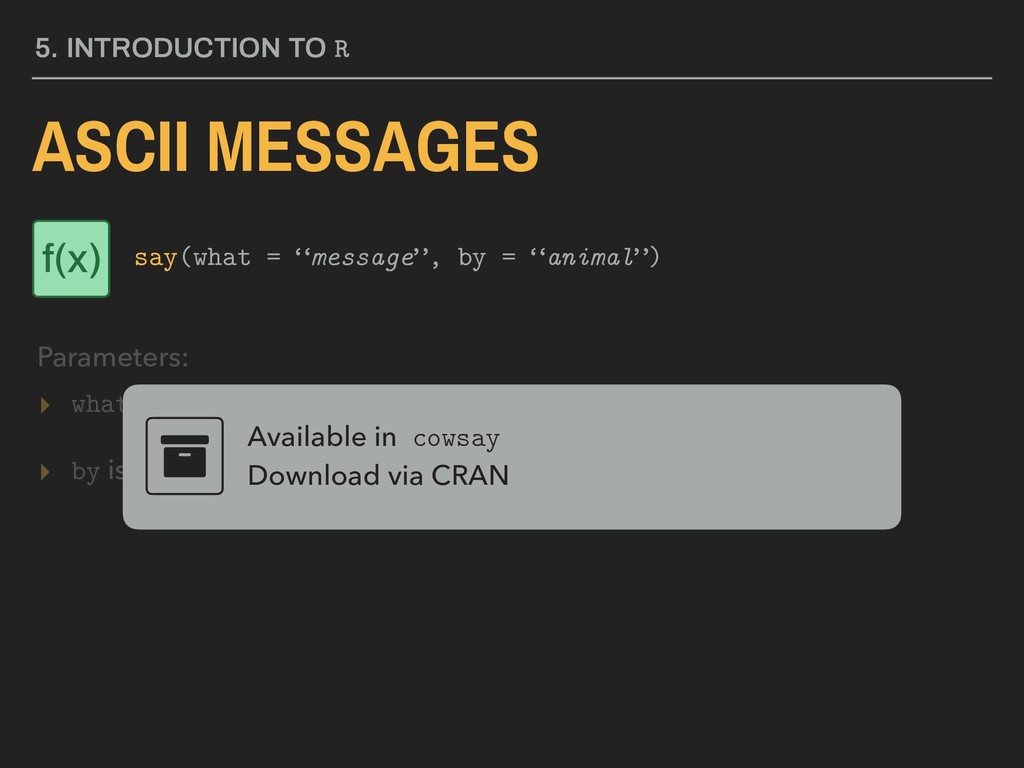
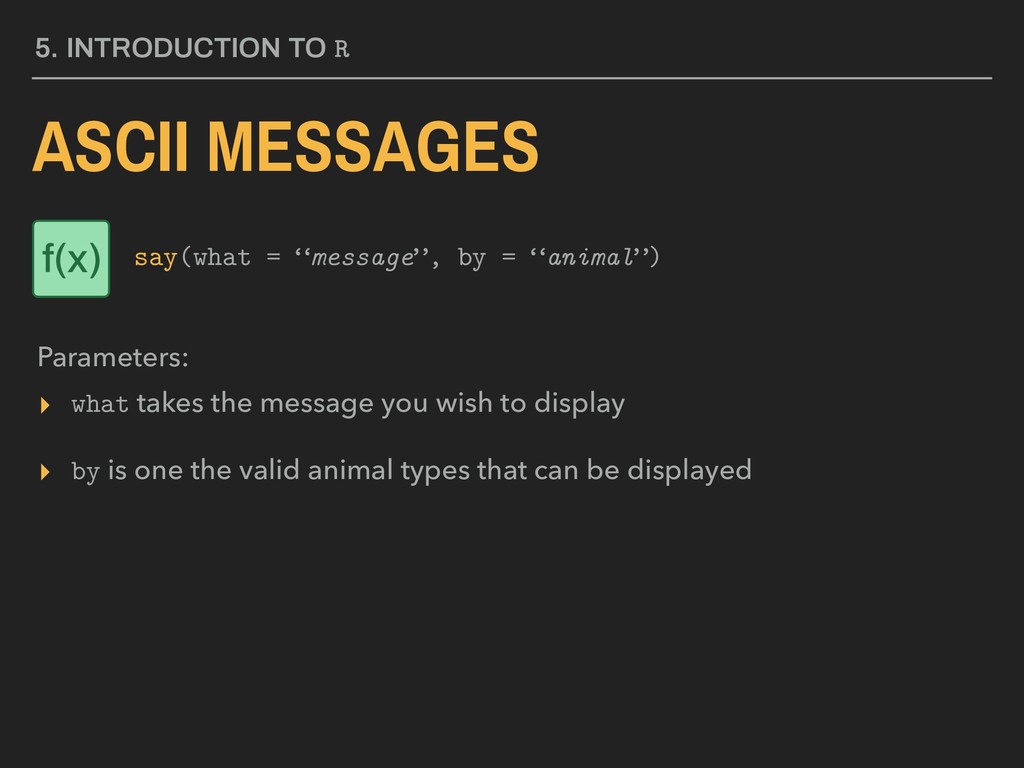
by is one the valid animal types that can be displayed Available in cowsay Download via CRAN 5. INTRODUCTION TO R ASCII MESSAGES Parameters: say(what = “message”, by = “animal”) f(x)
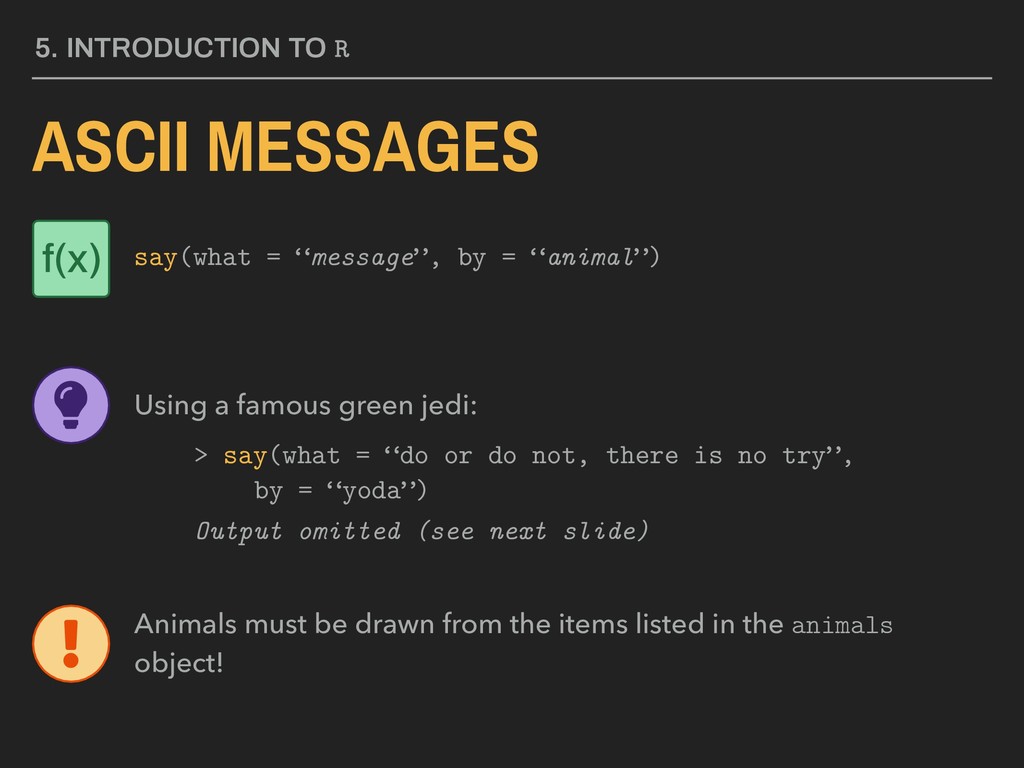
= “animal”) Using a famous green jedi: > say(what = “do or do not, there is no try”, by = “yoda”) Output omitted (see next slide) Animals must be drawn from the items listed in the animals object! f(x)
BACK MATTER Course Onboarding and Course Preview materials were due today - please submit asap! Details on course website. We’ll end every class with “Back Matter” - goal is to share what we are covering, what due dates are coming up, and any announcements. Before Lecture-03: Lab-01, LP-03, Final Project Memo