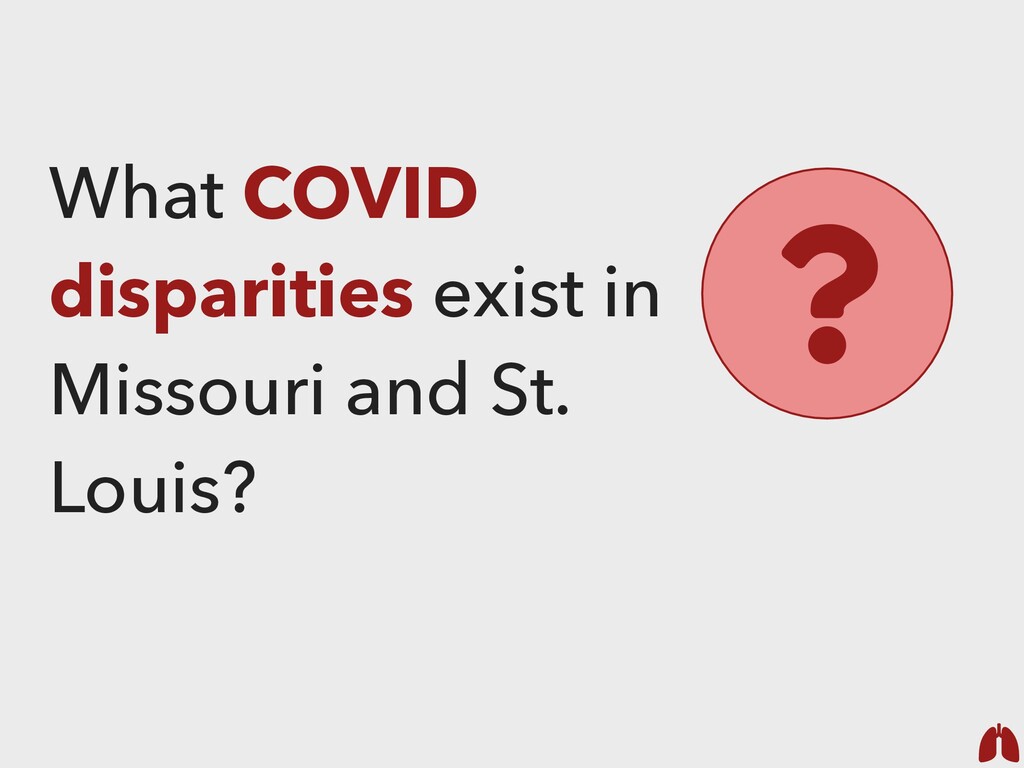
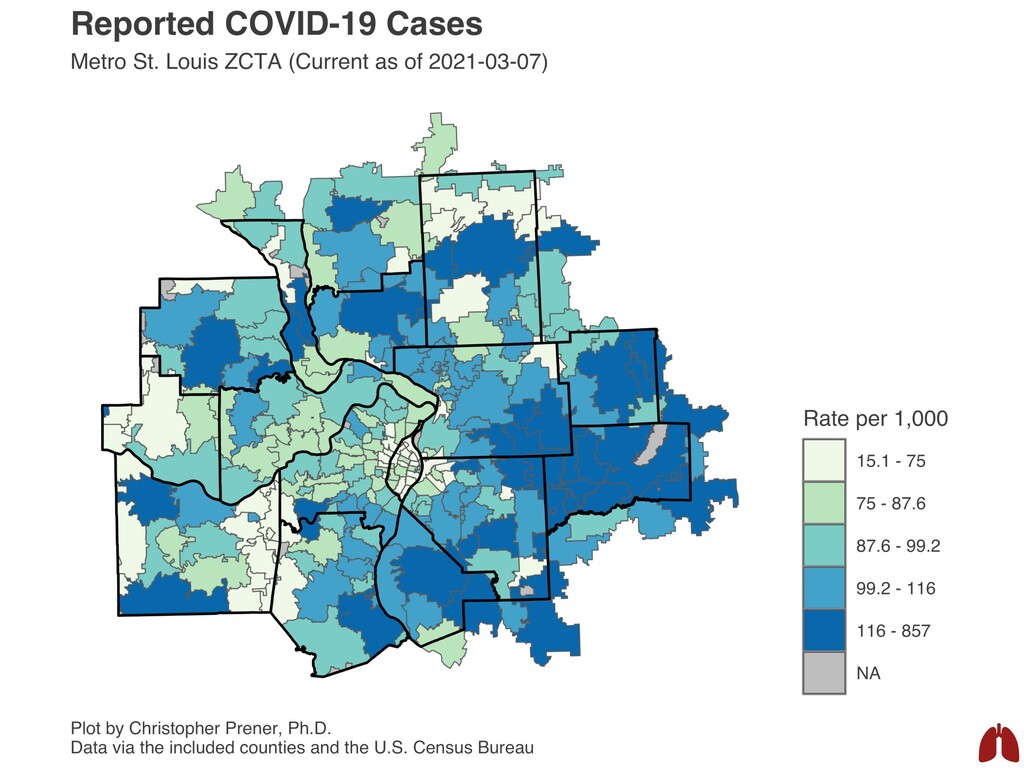
on COVID? 3. What is wrong with this arrangement for COVID data? 4. What does the sewing kit look like for my COVID work? 5. What COIVD disparities exist in Missouri and St. Louis? 6. Discussion: Why are there issues with vaccination access in Missouri and globally? How can we redesign the vaccination system to increase equity? SAINT LOUIS UNIVERSITY | ST. LOUIS, MO | 03.08.2021
and computational methods ▸ Affiliations: • Core Faculty, SLU’s Advanced HEAlth Data Research Institute • SLU’s Institute for Healing Justice and Equity • Northeastern University’s Institute for Health Equity and Social Justice Research 1. PREFACE “HI, I’M CHRIS”
and computational methods ▸ Teaching: • SOC 1120 - Introduction to Sociology (Diversity and Health) • I always offer an honors seminar alongside this class - we meet three times to go in-depth on a topic; also focus on op-eds • SOC 4650 - Introduction to GIS 1. PREFACE “HI, I’M CHRIS”
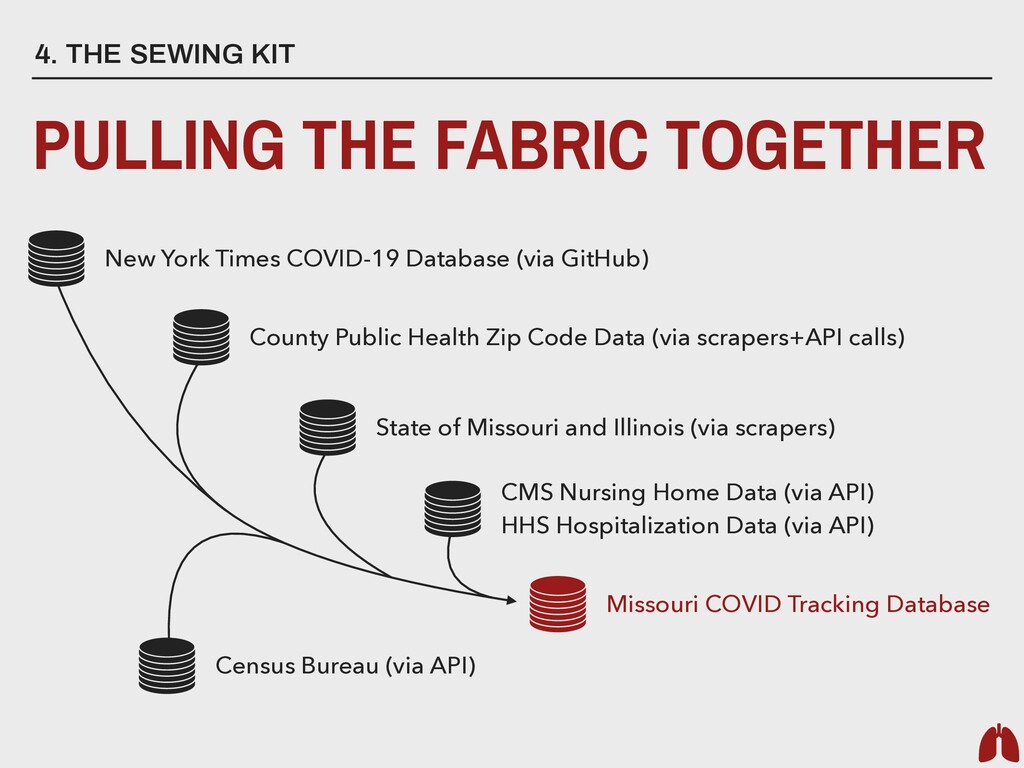
Times COVID-19 Database (via GitHub) County Public Health Zip Code Data (via scrapers+API calls) Missouri COVID Tracking Database State of Missouri and Illinois (via scrapers) CMS Nursing Home Data (via API) HHS Hospitalization Data (via API) Census Bureau (via API)
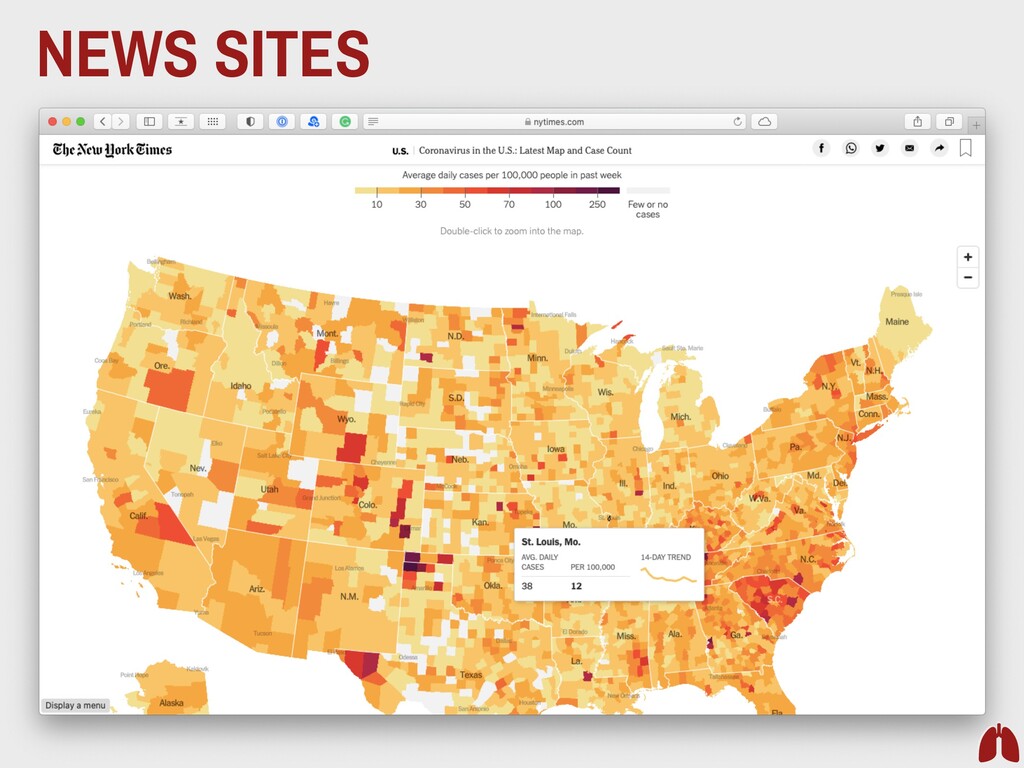
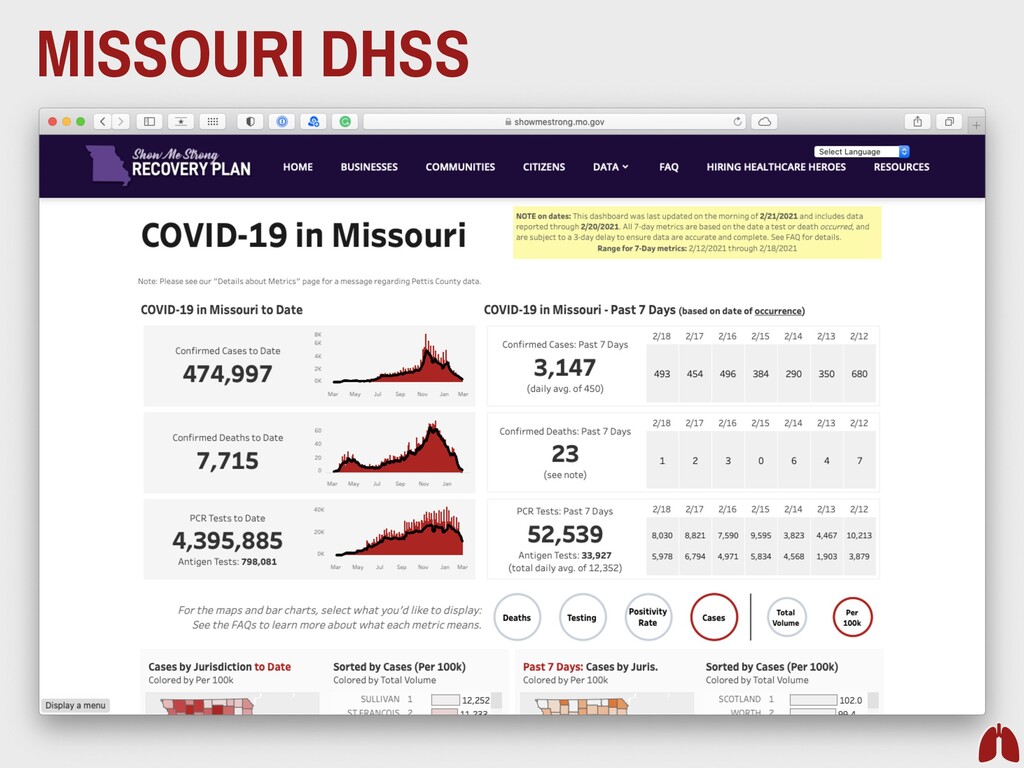
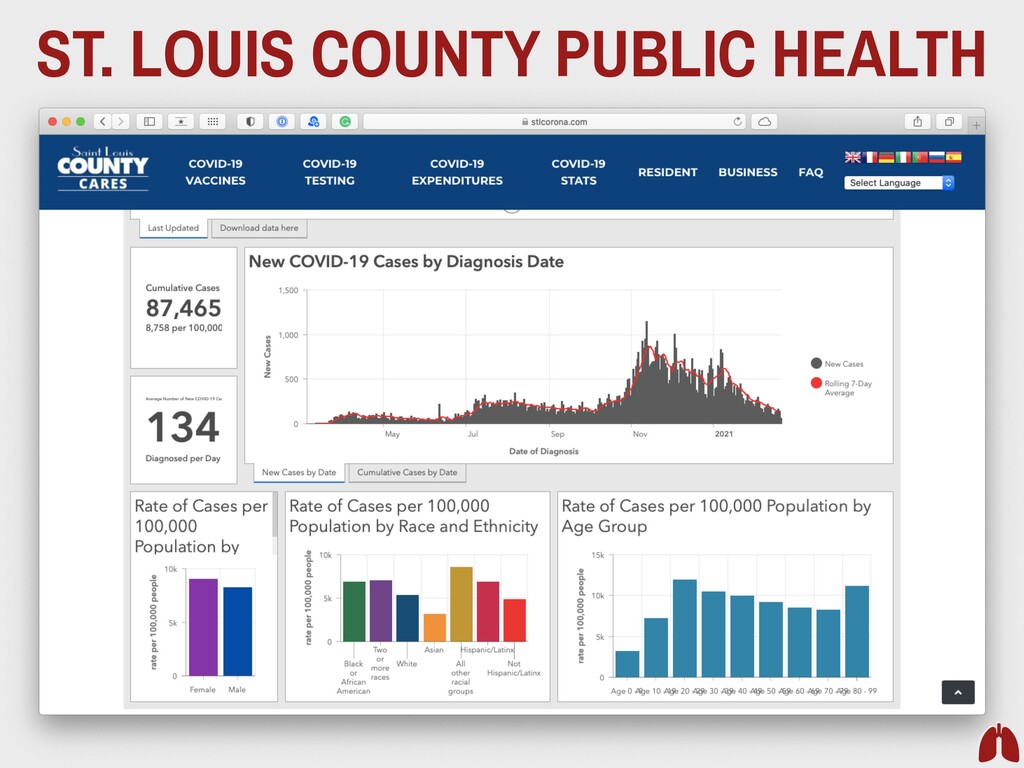
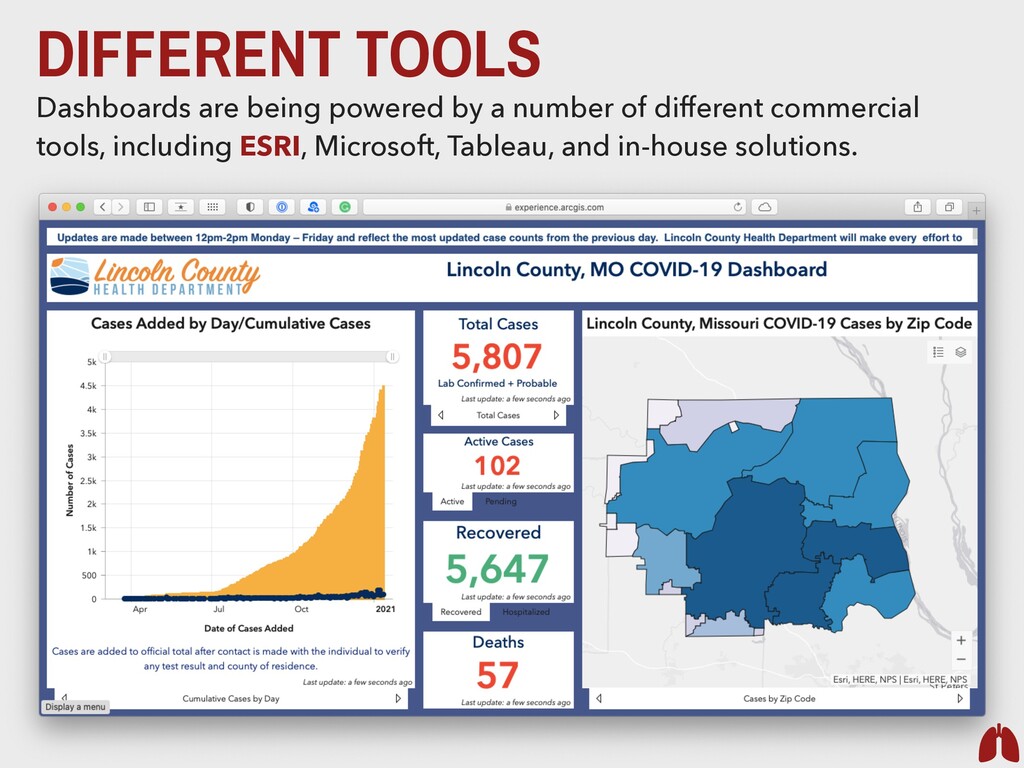
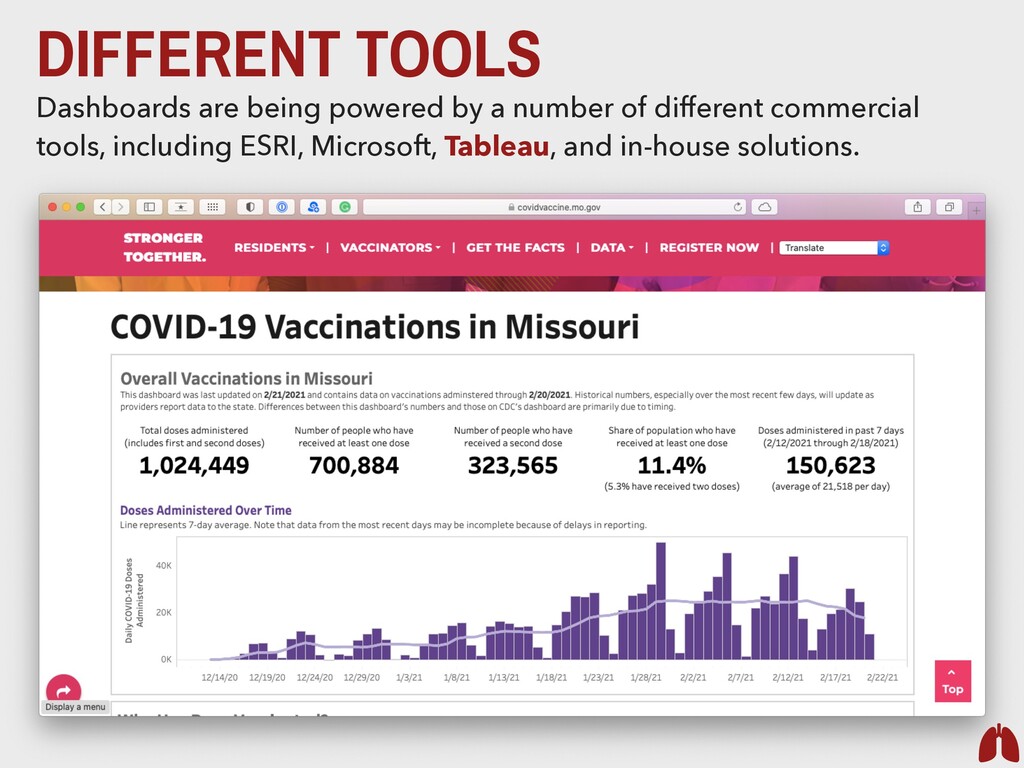
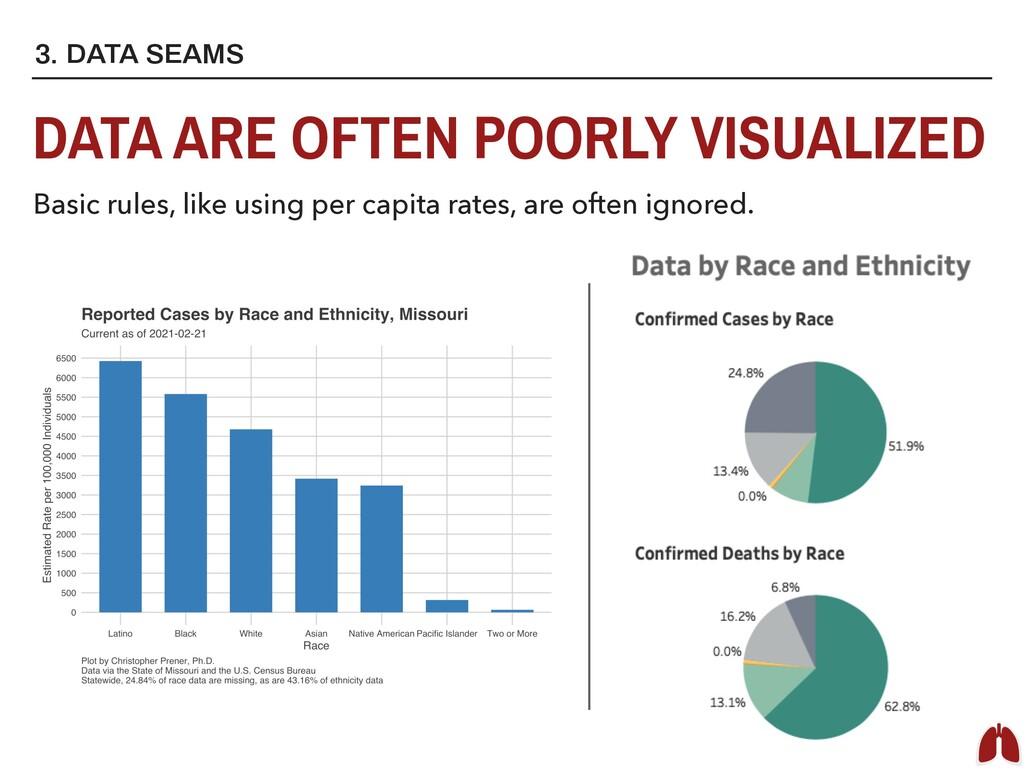
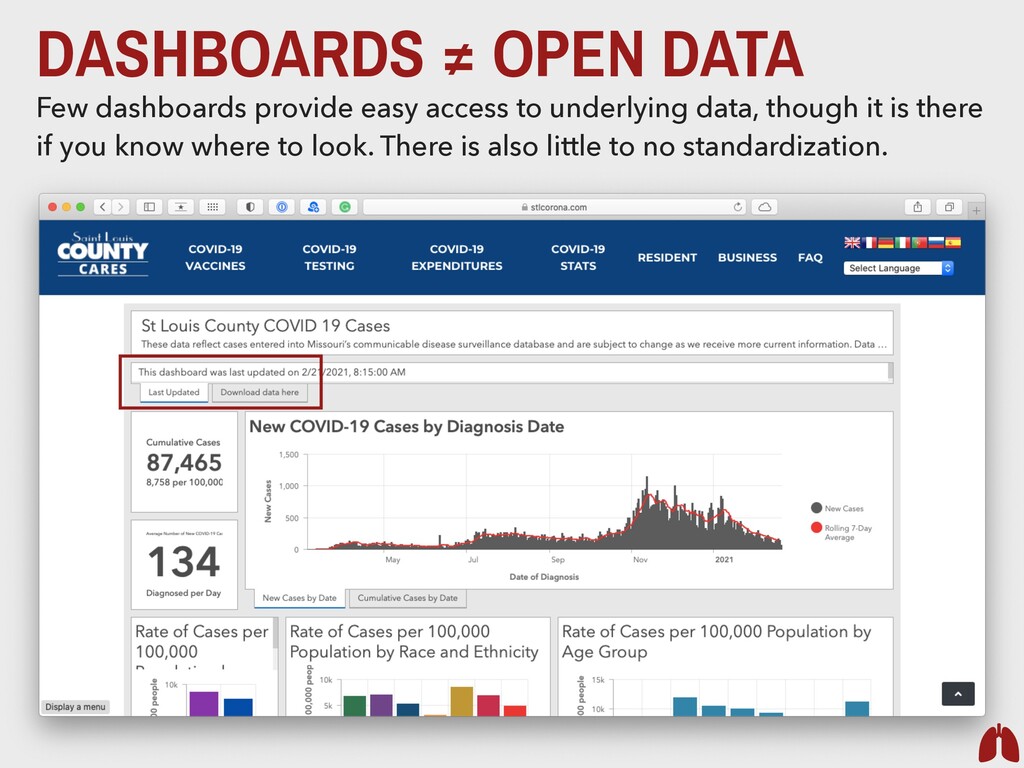
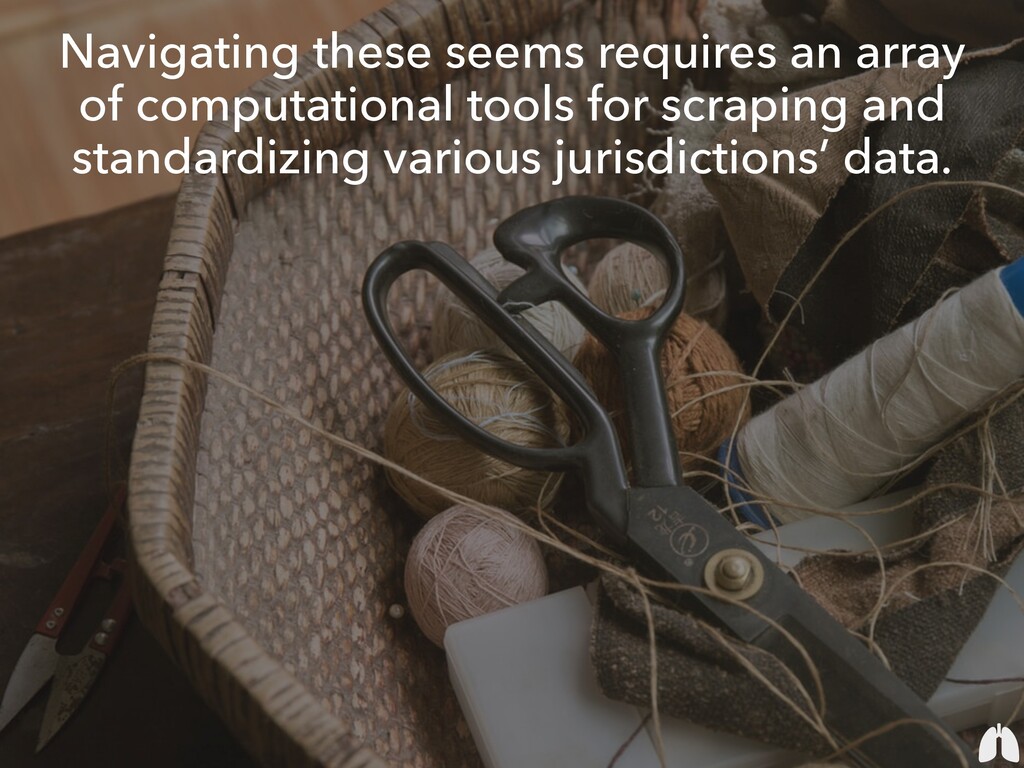
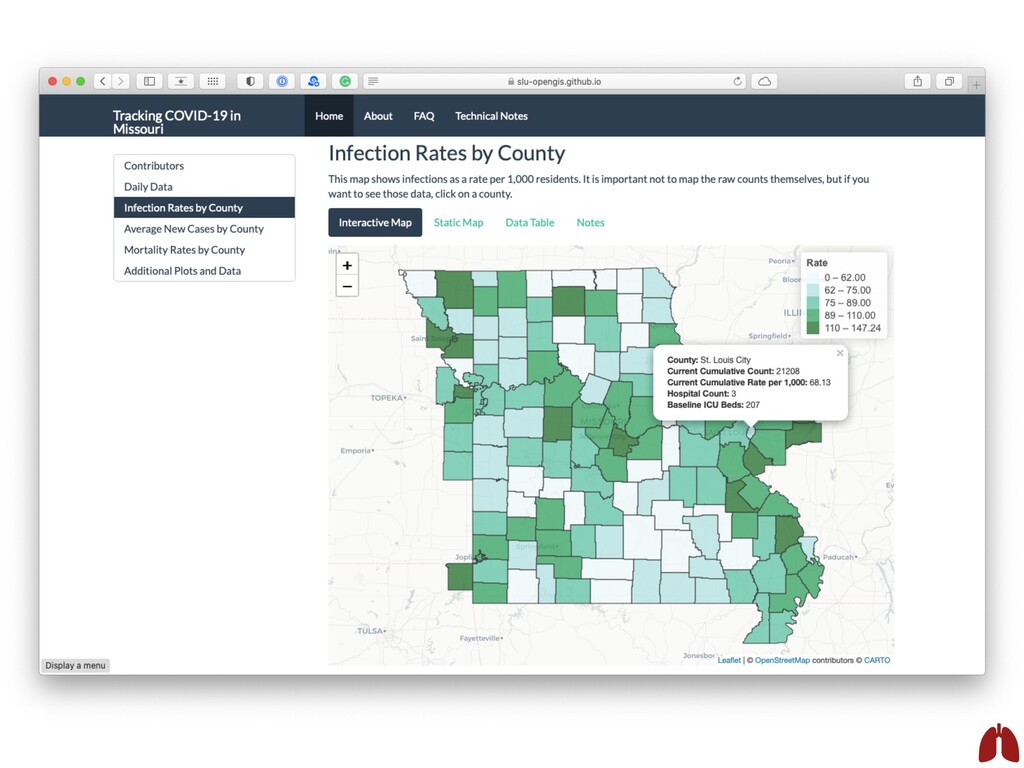
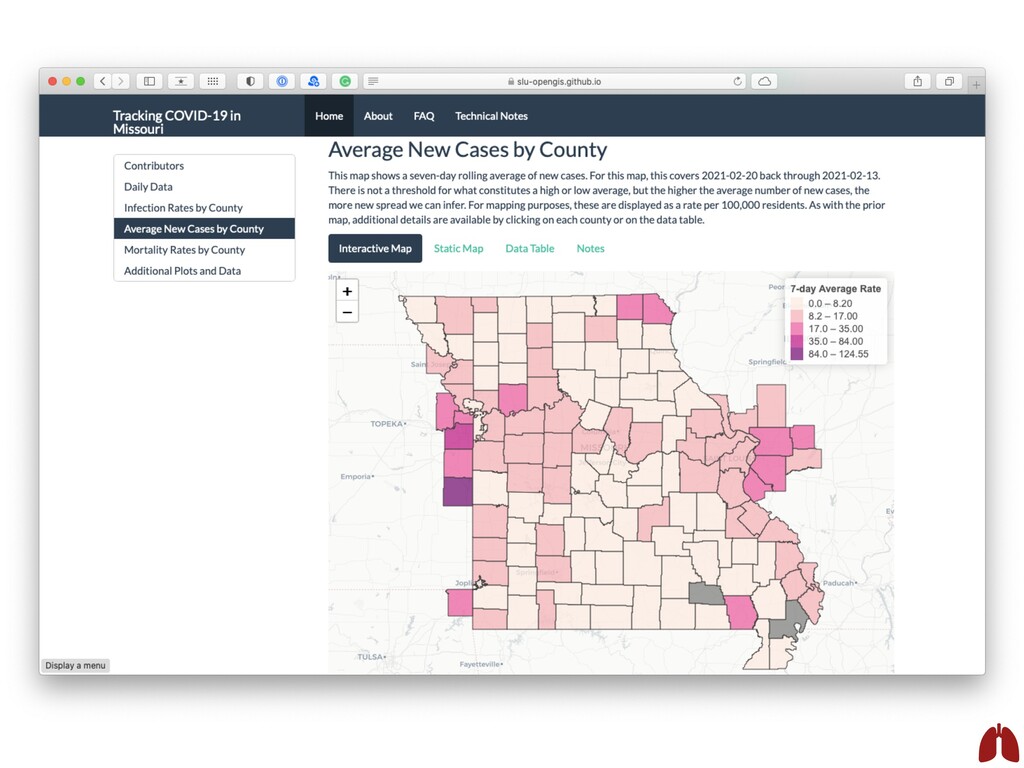
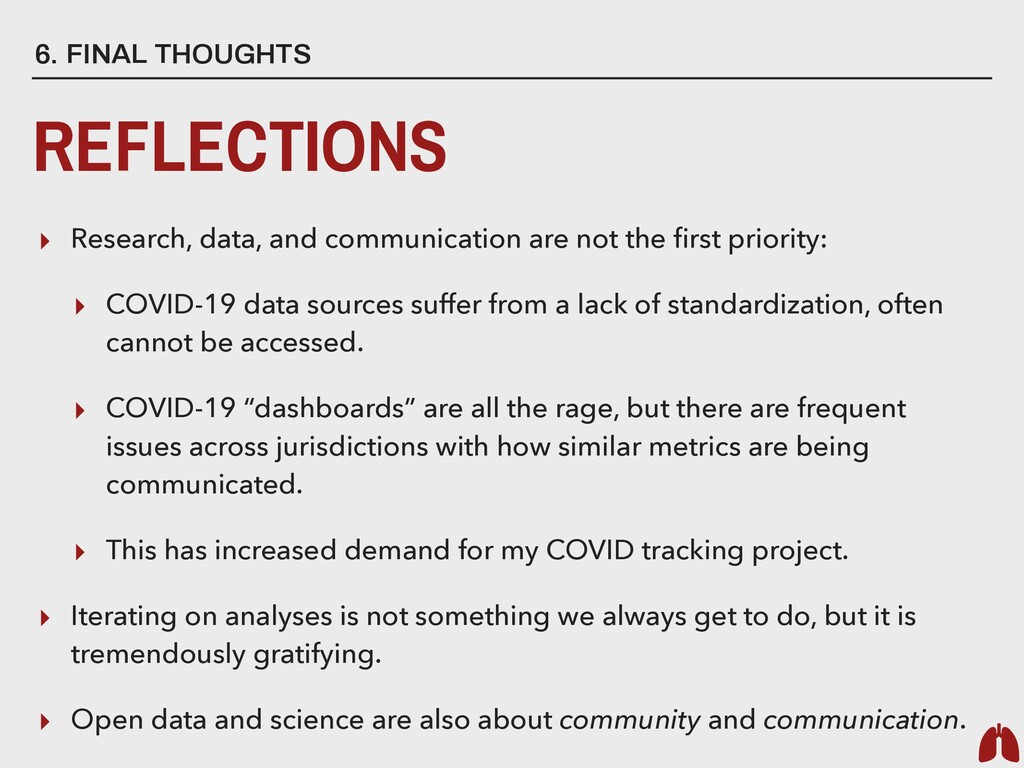
not the first priority: ▸ COVID-19 data sources suffer from a lack of standardization, often cannot be accessed. ▸ COVID-19 “dashboards” are all the rage, but there are frequent issues across jurisdictions with how similar metrics are being communicated. ▸ This has increased demand for my COVID tracking project. ▸ Iterating on analyses is not something we always get to do, but it is tremendously gratifying. ▸ Open data and science are also about community and communication.
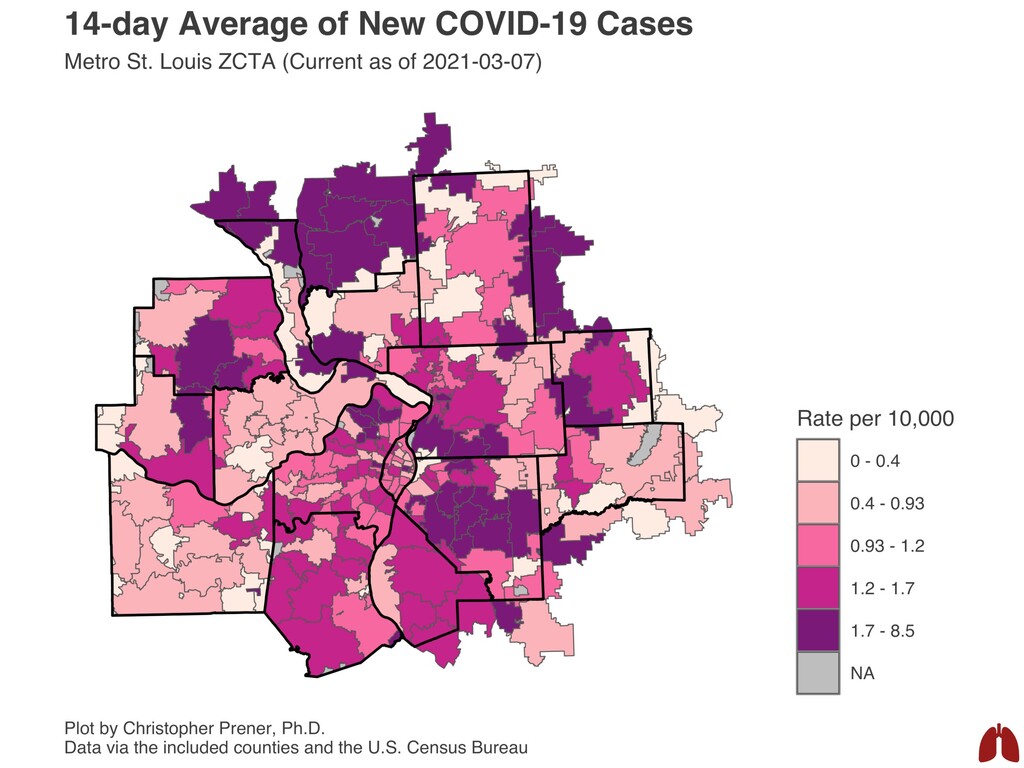
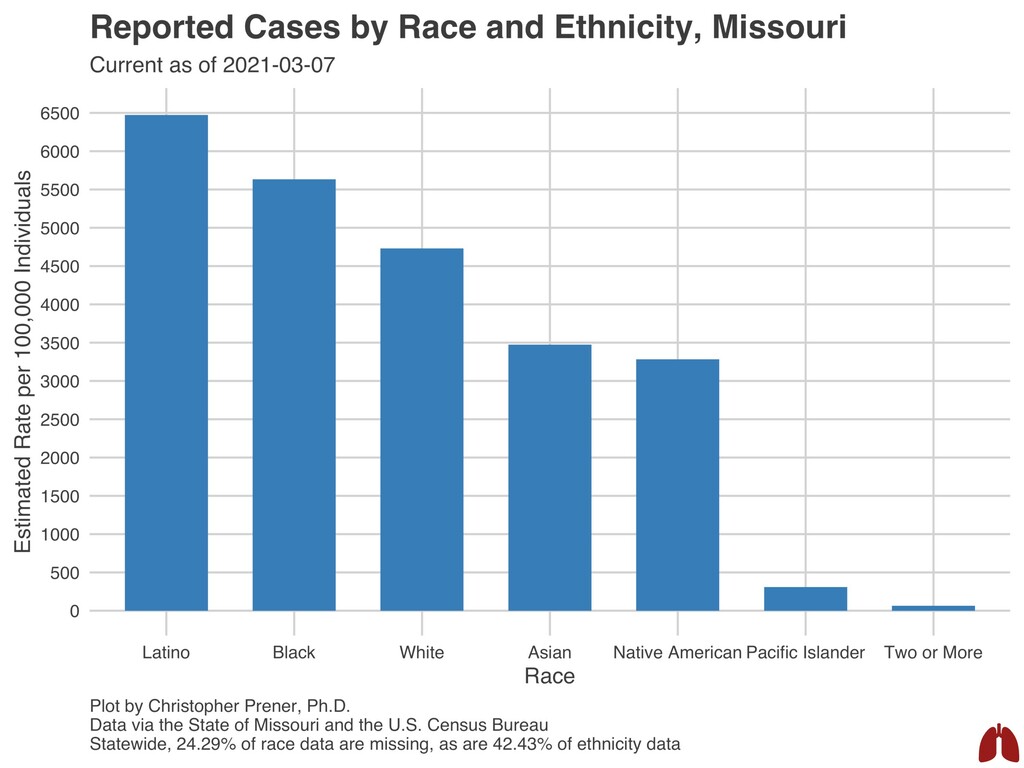
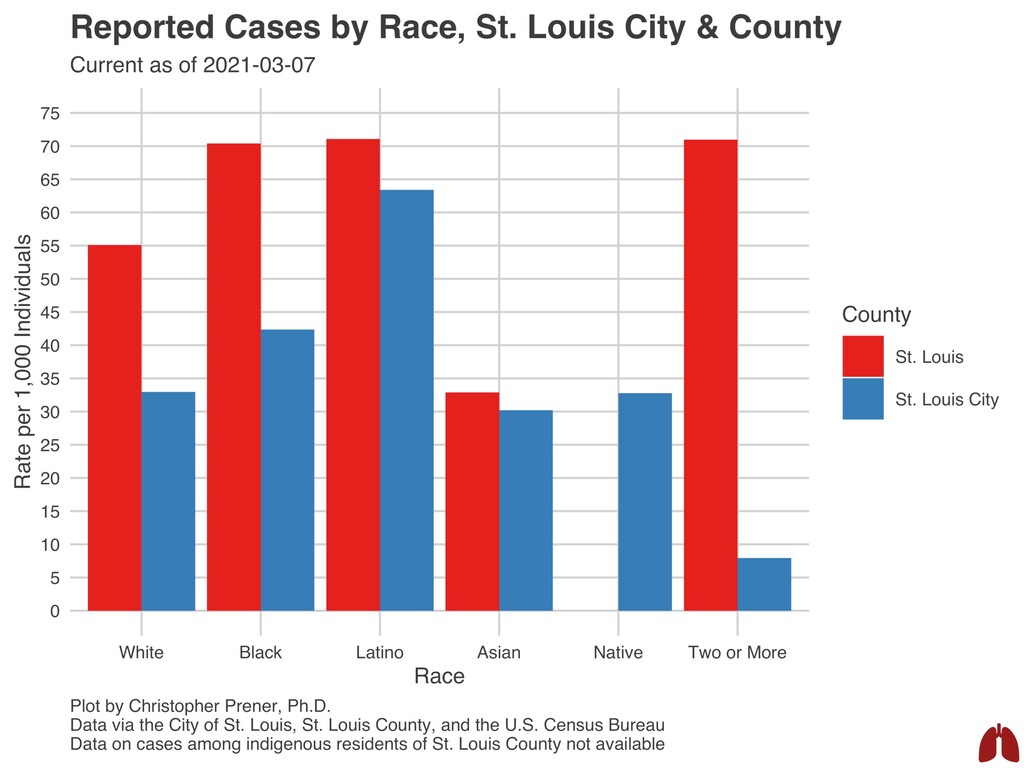
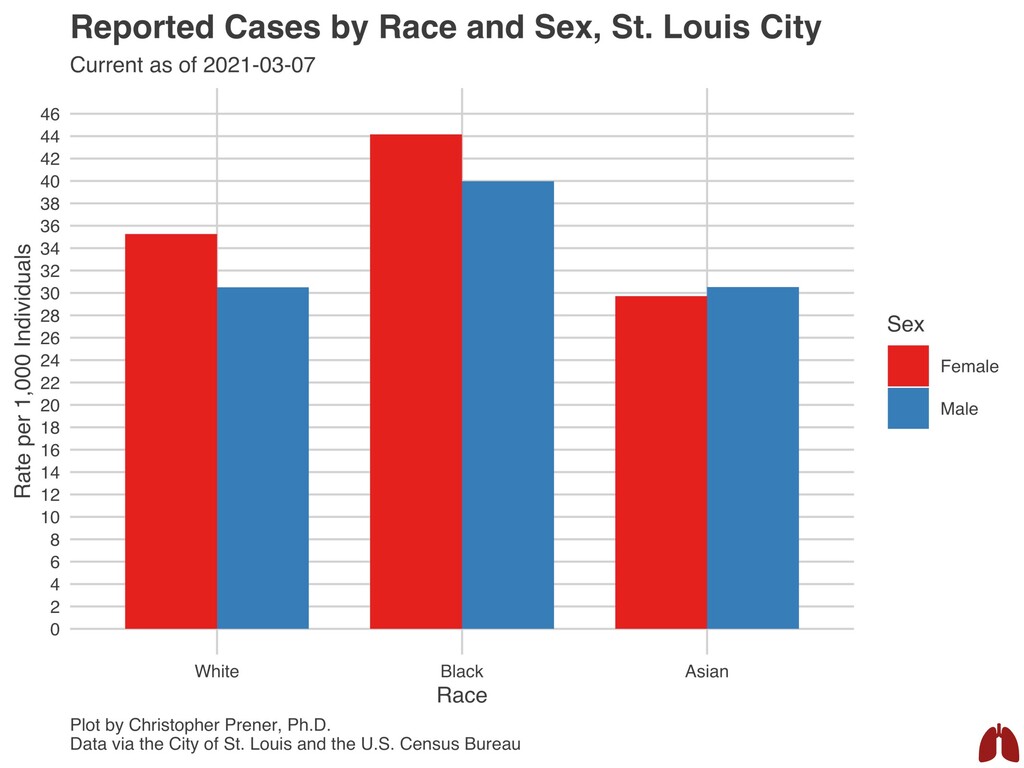
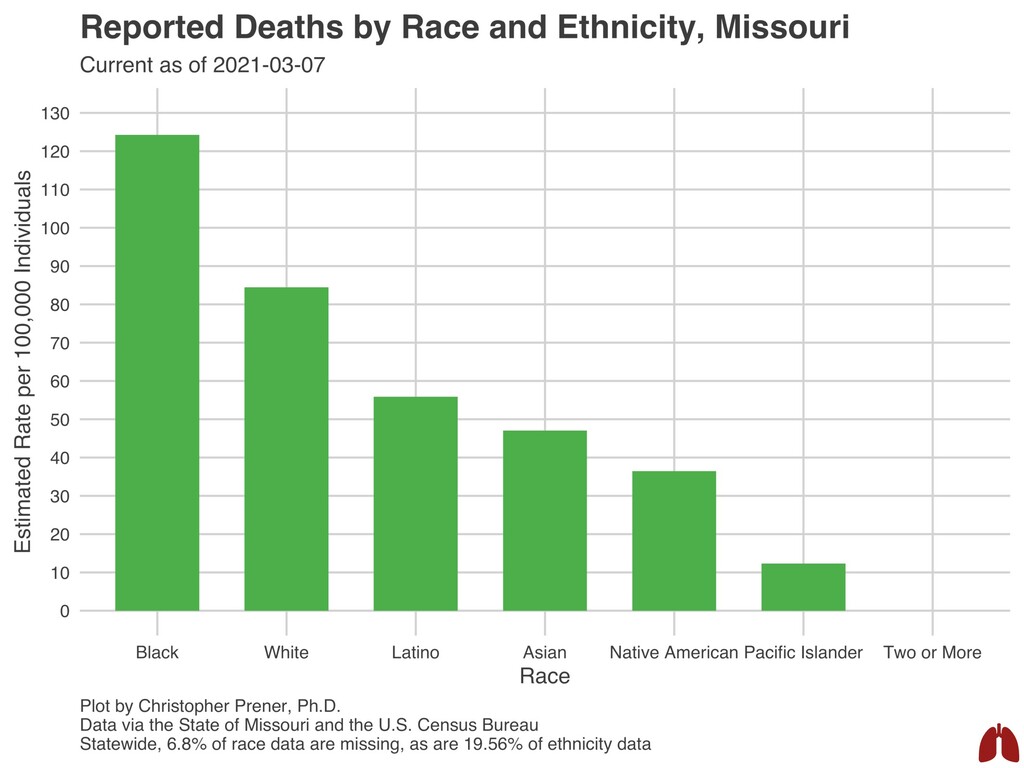
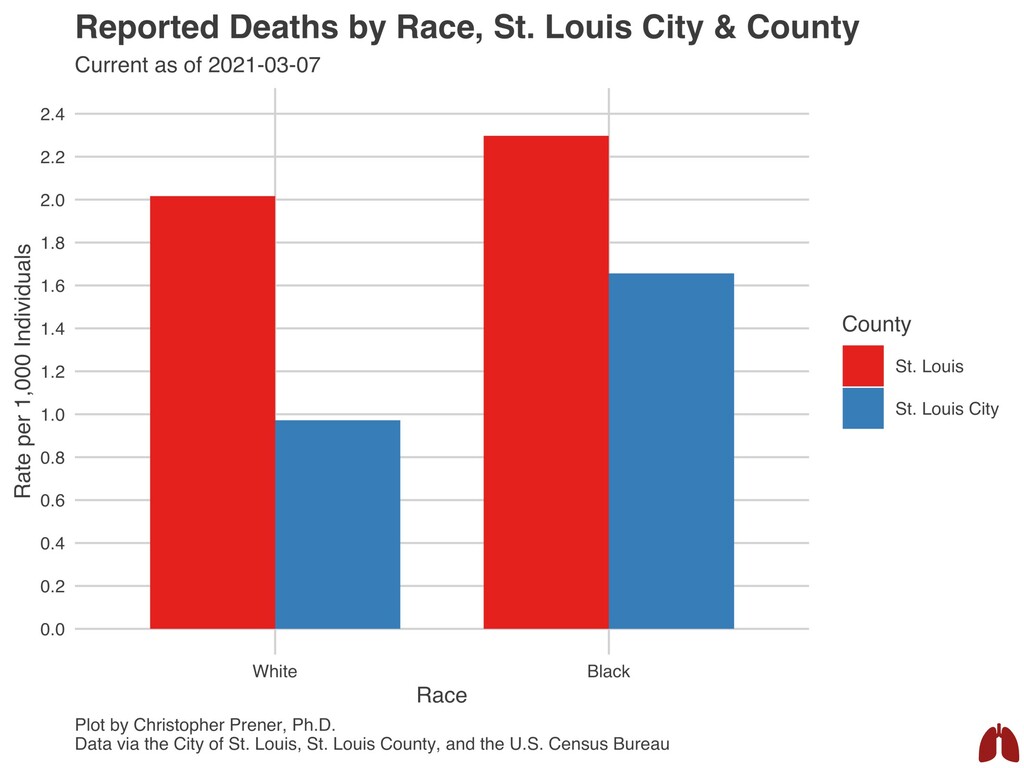
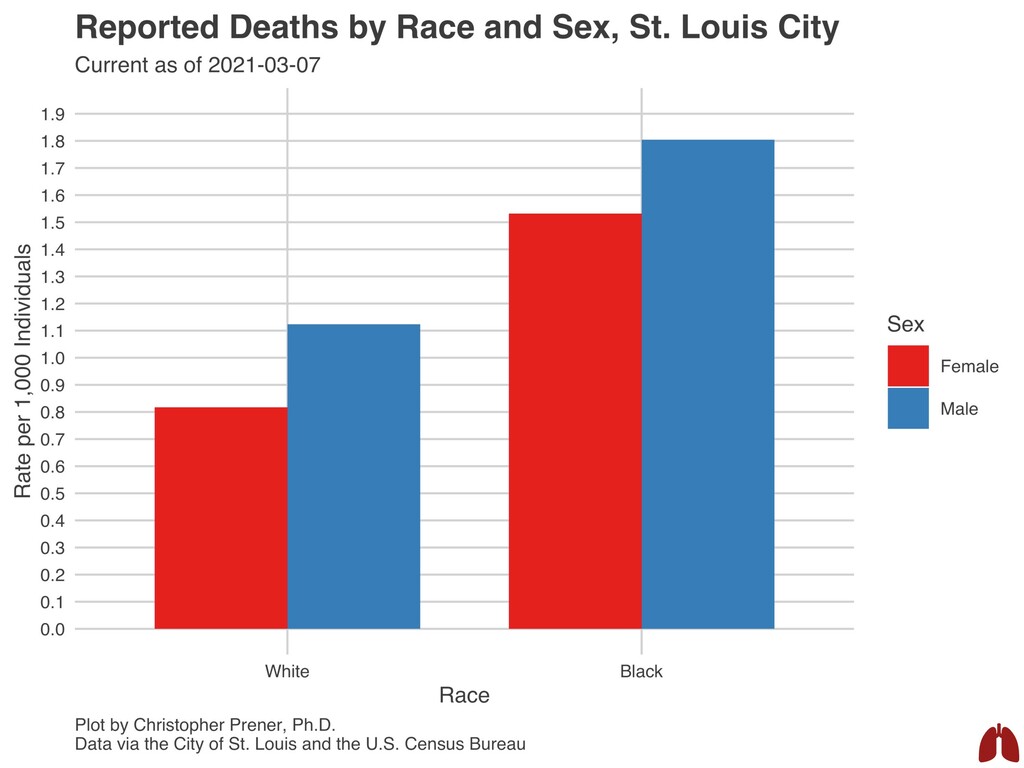
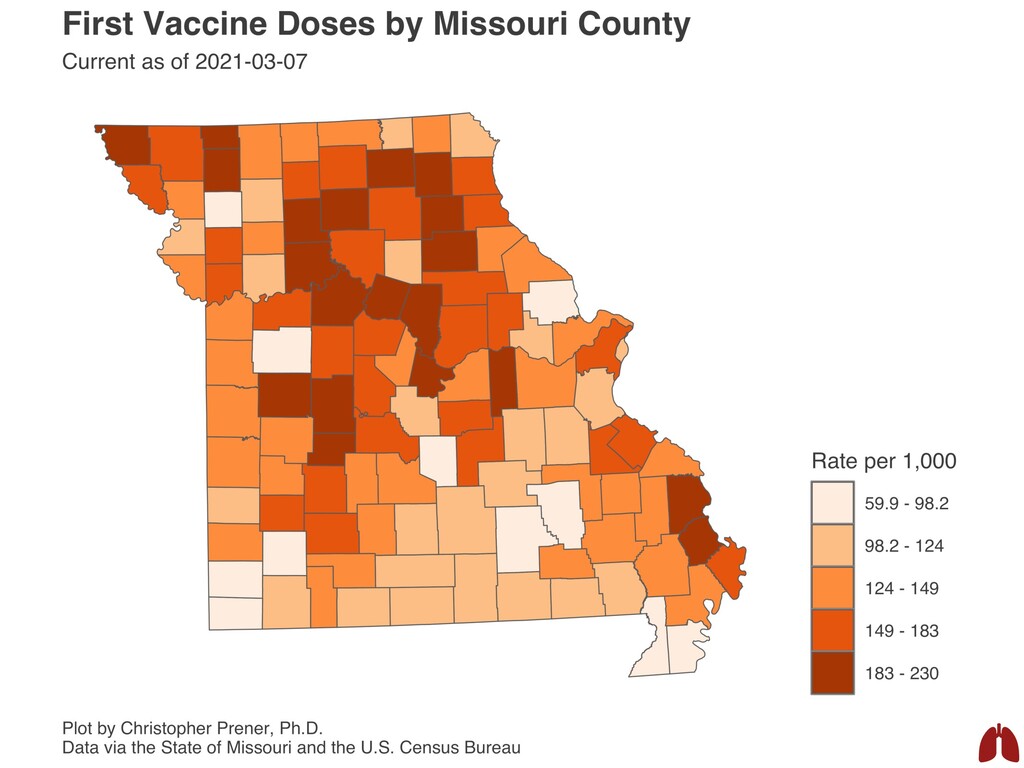
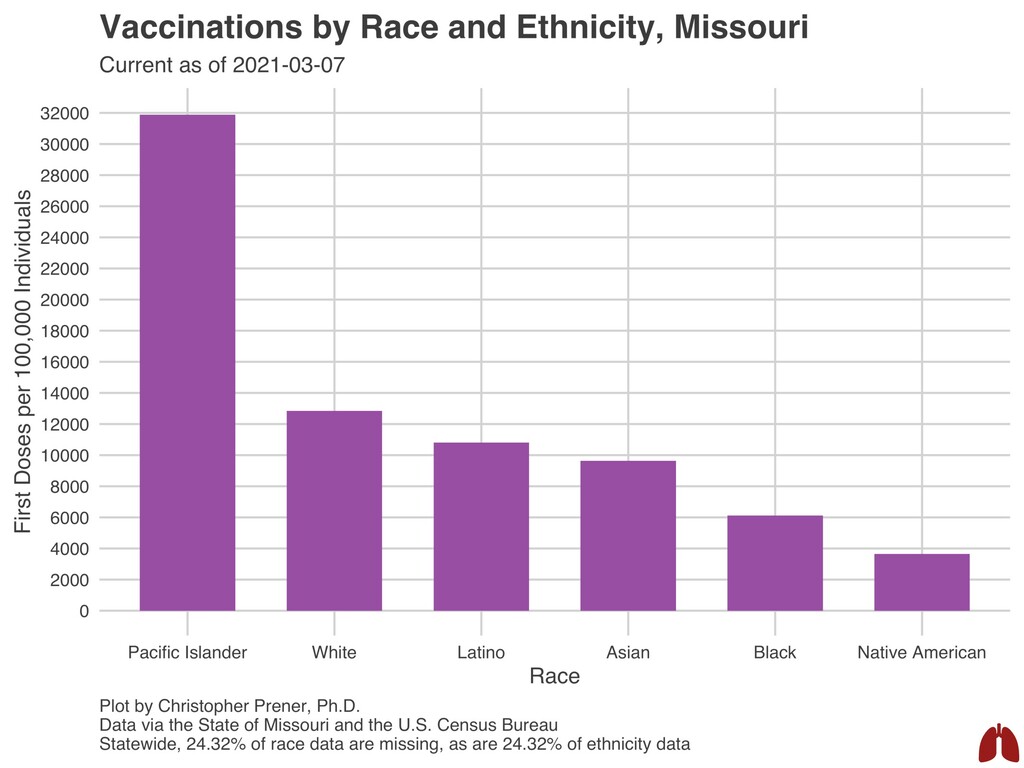
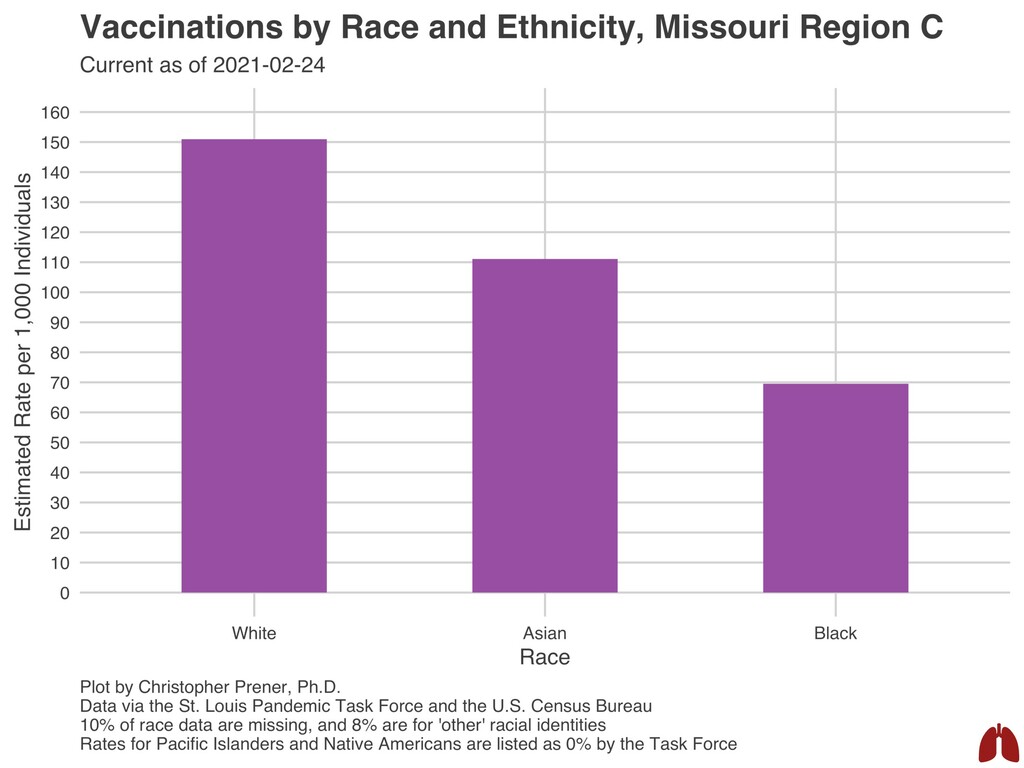
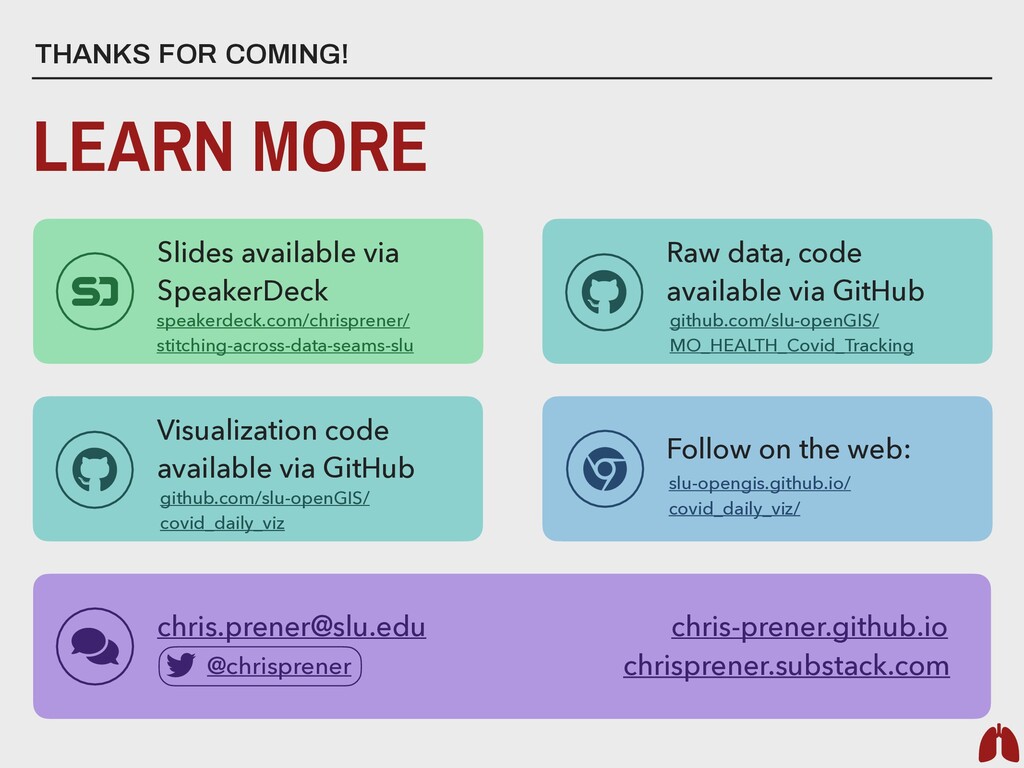
Raw data, code available via GitHub github.com/slu-openGIS/ MO_HEALTH_Covid_Tracking [email protected] chris-prener.github.io LEARN MORE THANKS FOR COMING! @chrisprener Visualization code available via GitHub github.com/slu-openGIS/ covid_daily_viz slu-opengis.github.io/ covid_daily_viz/ chrisprener.substack.com