Upgrade to Pro — share decks privately, control downloads, hide ads and more …

“Street Not Thru”: Street Closures, Neighborhood Geography, and Local Crime Rates in St. Louis, Missouri 

“Street Not Thru”: Street Closures, Neighborhood Geography, and Local Crime Rates in St. Louis, Missouri 

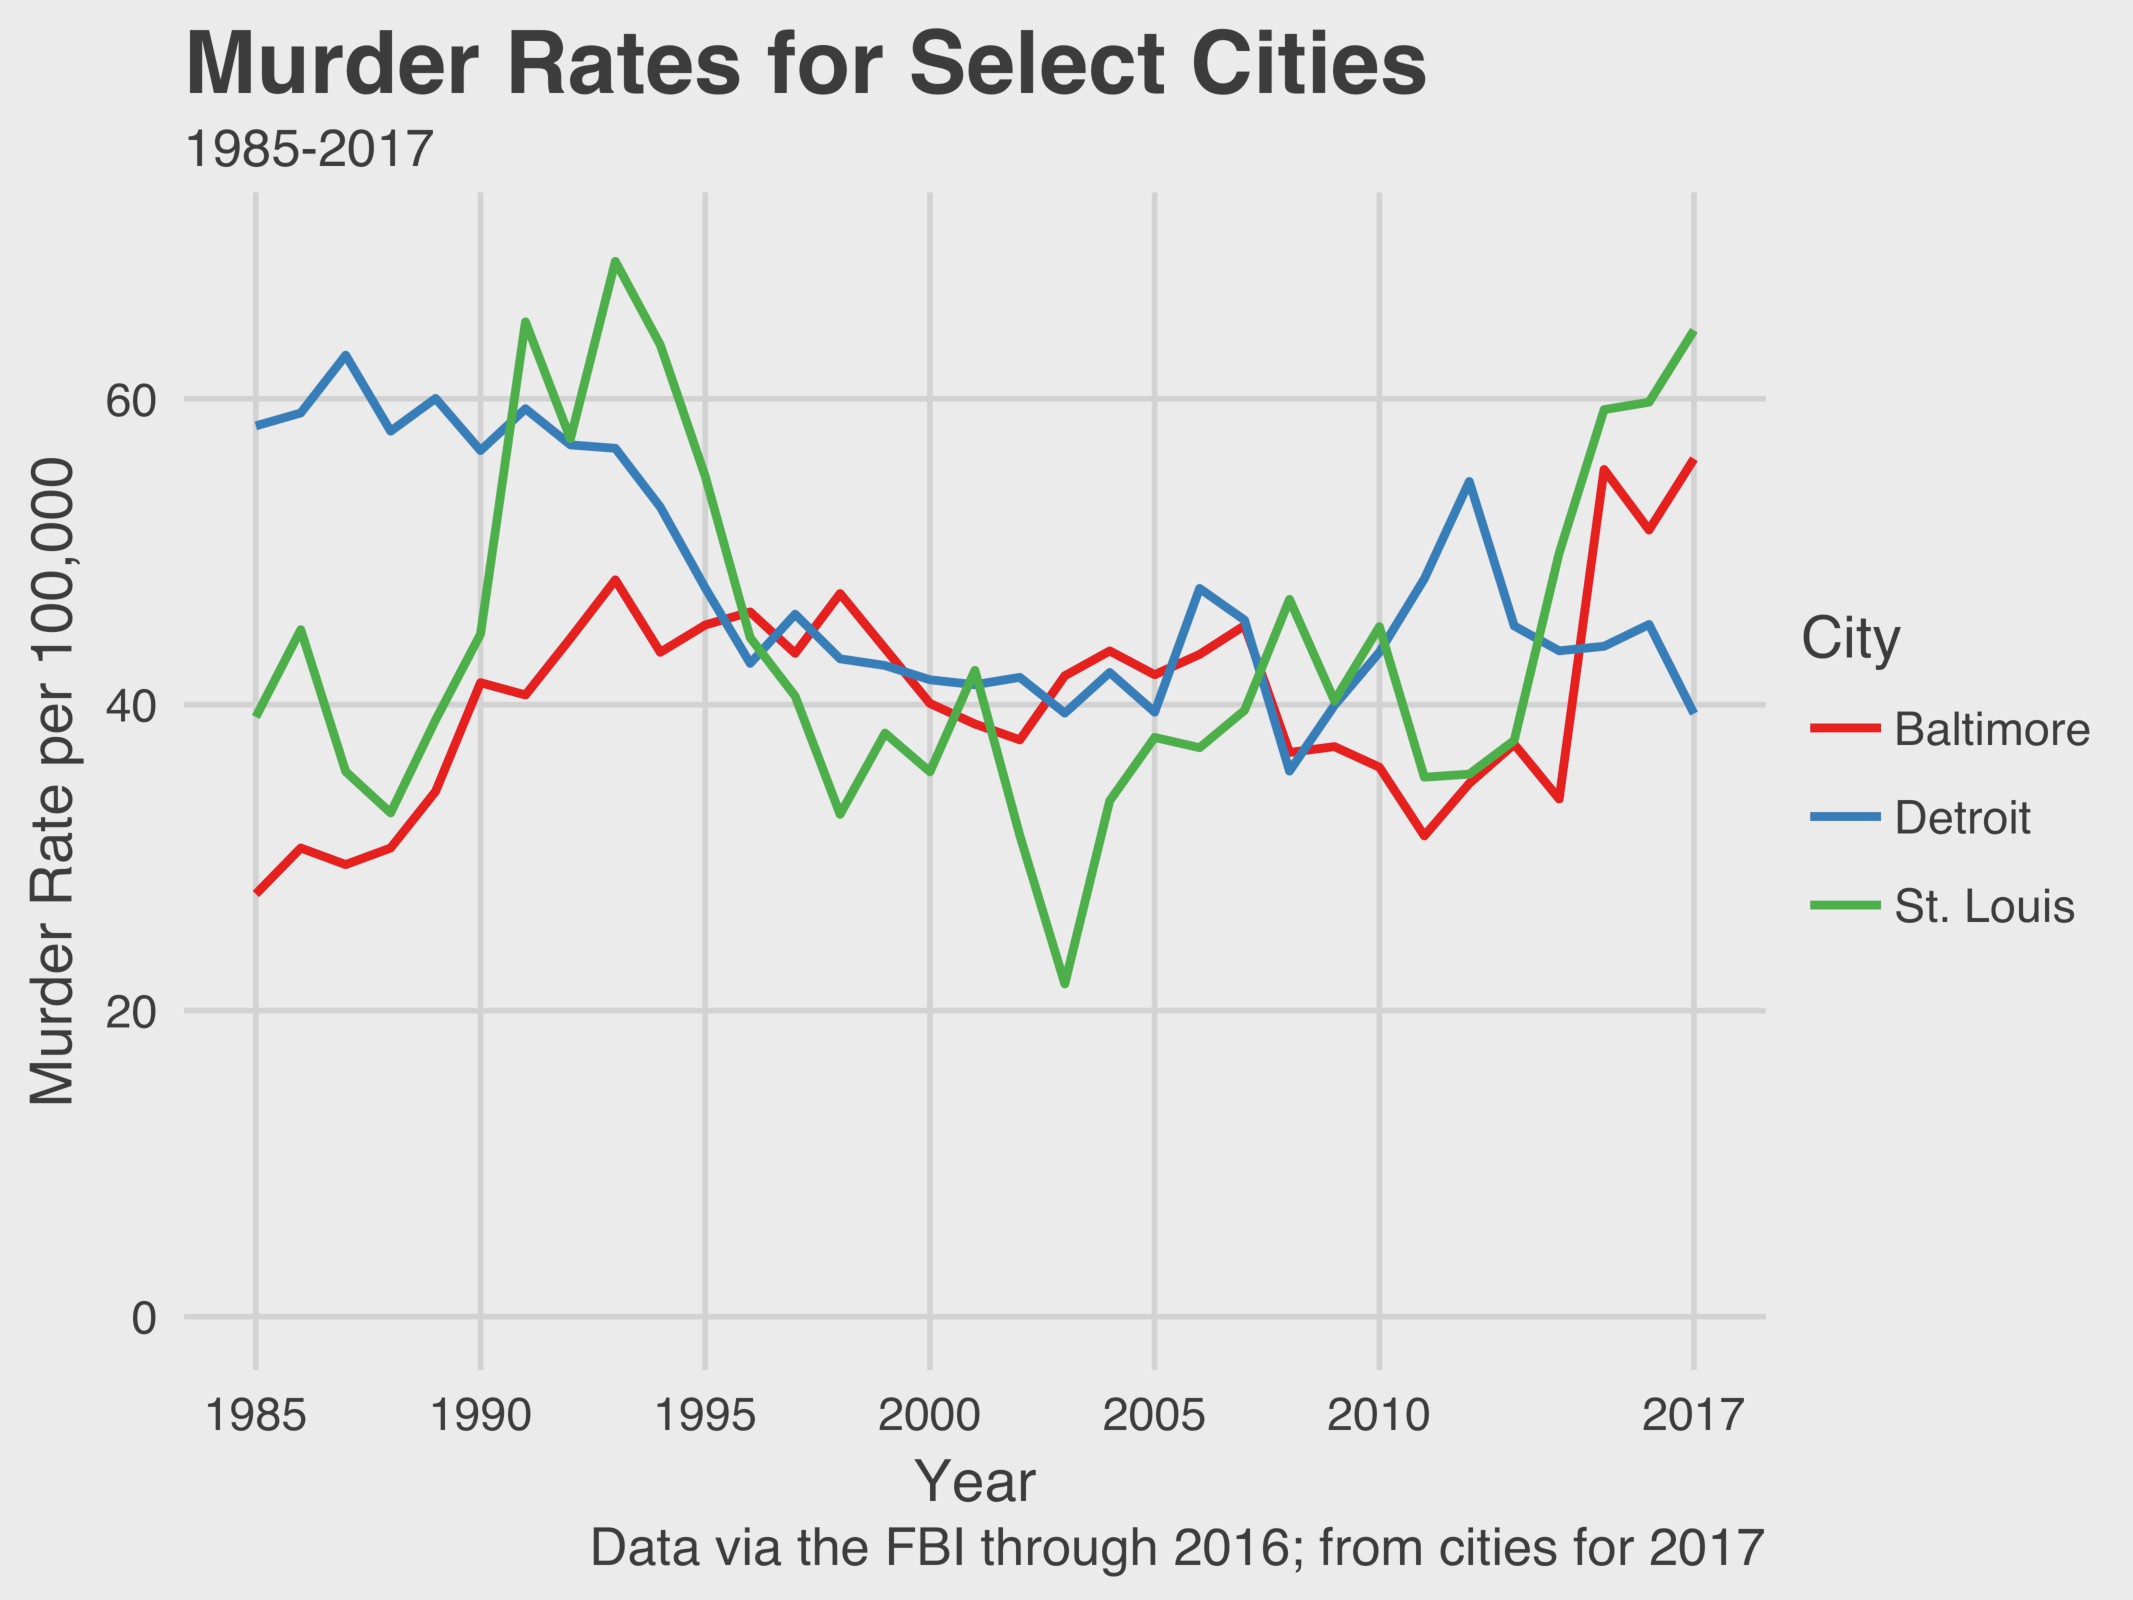
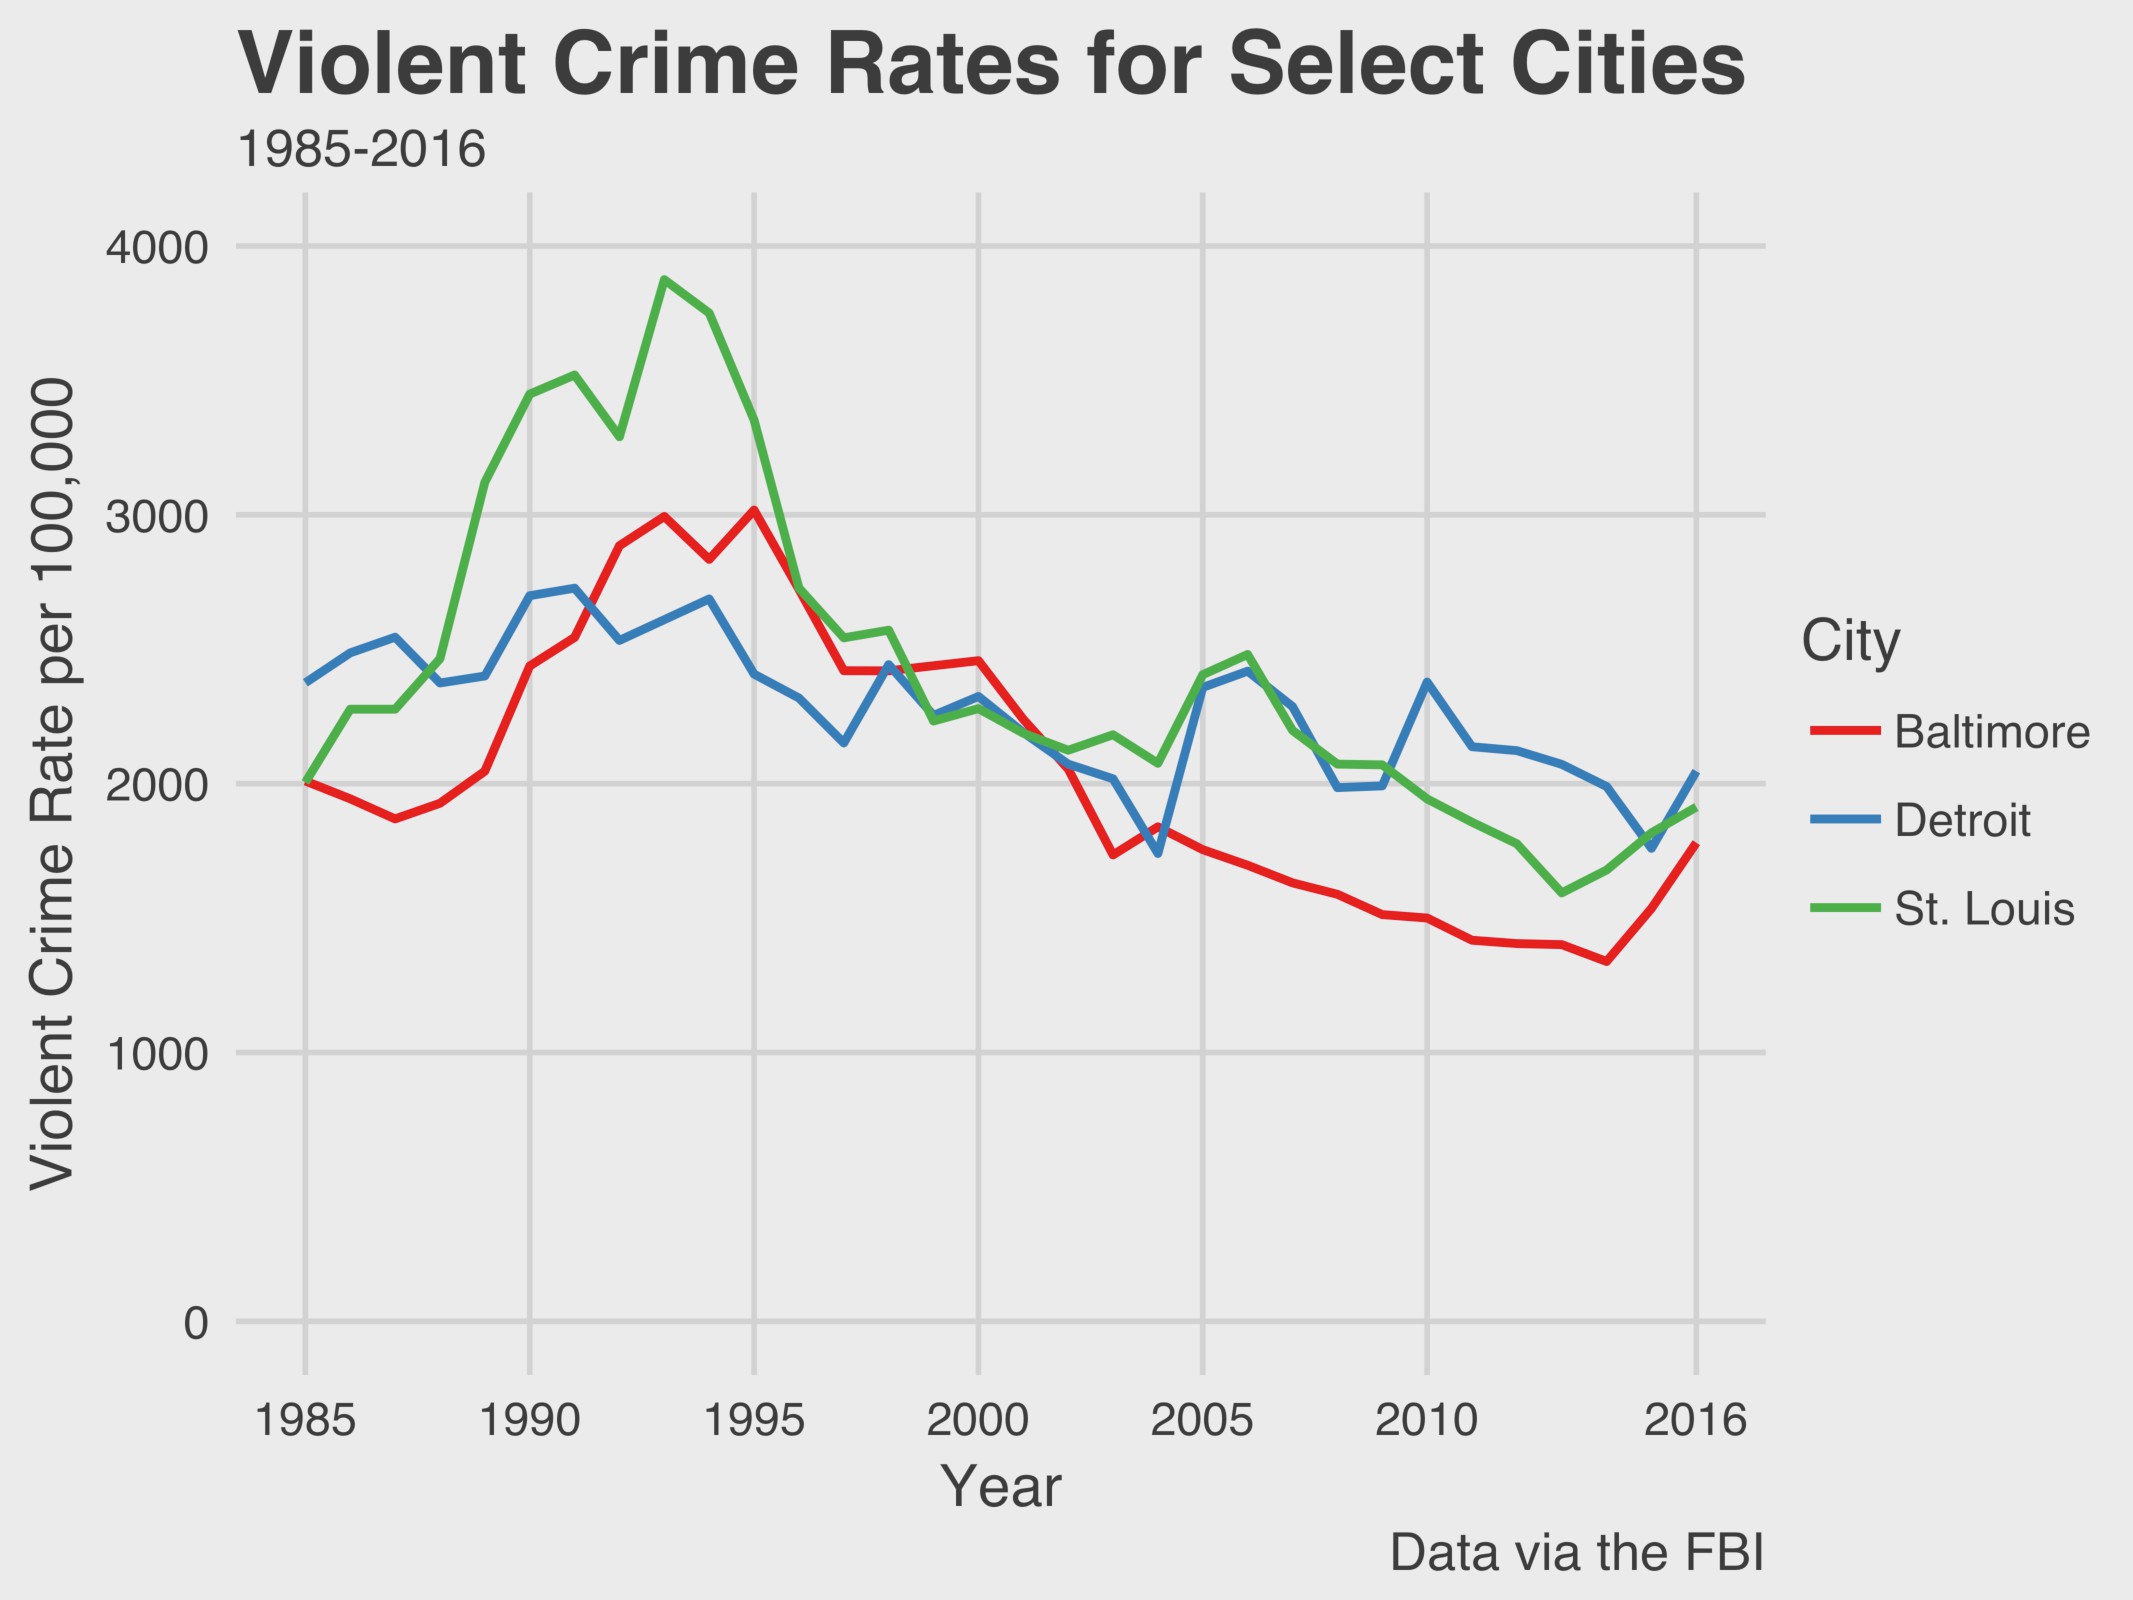
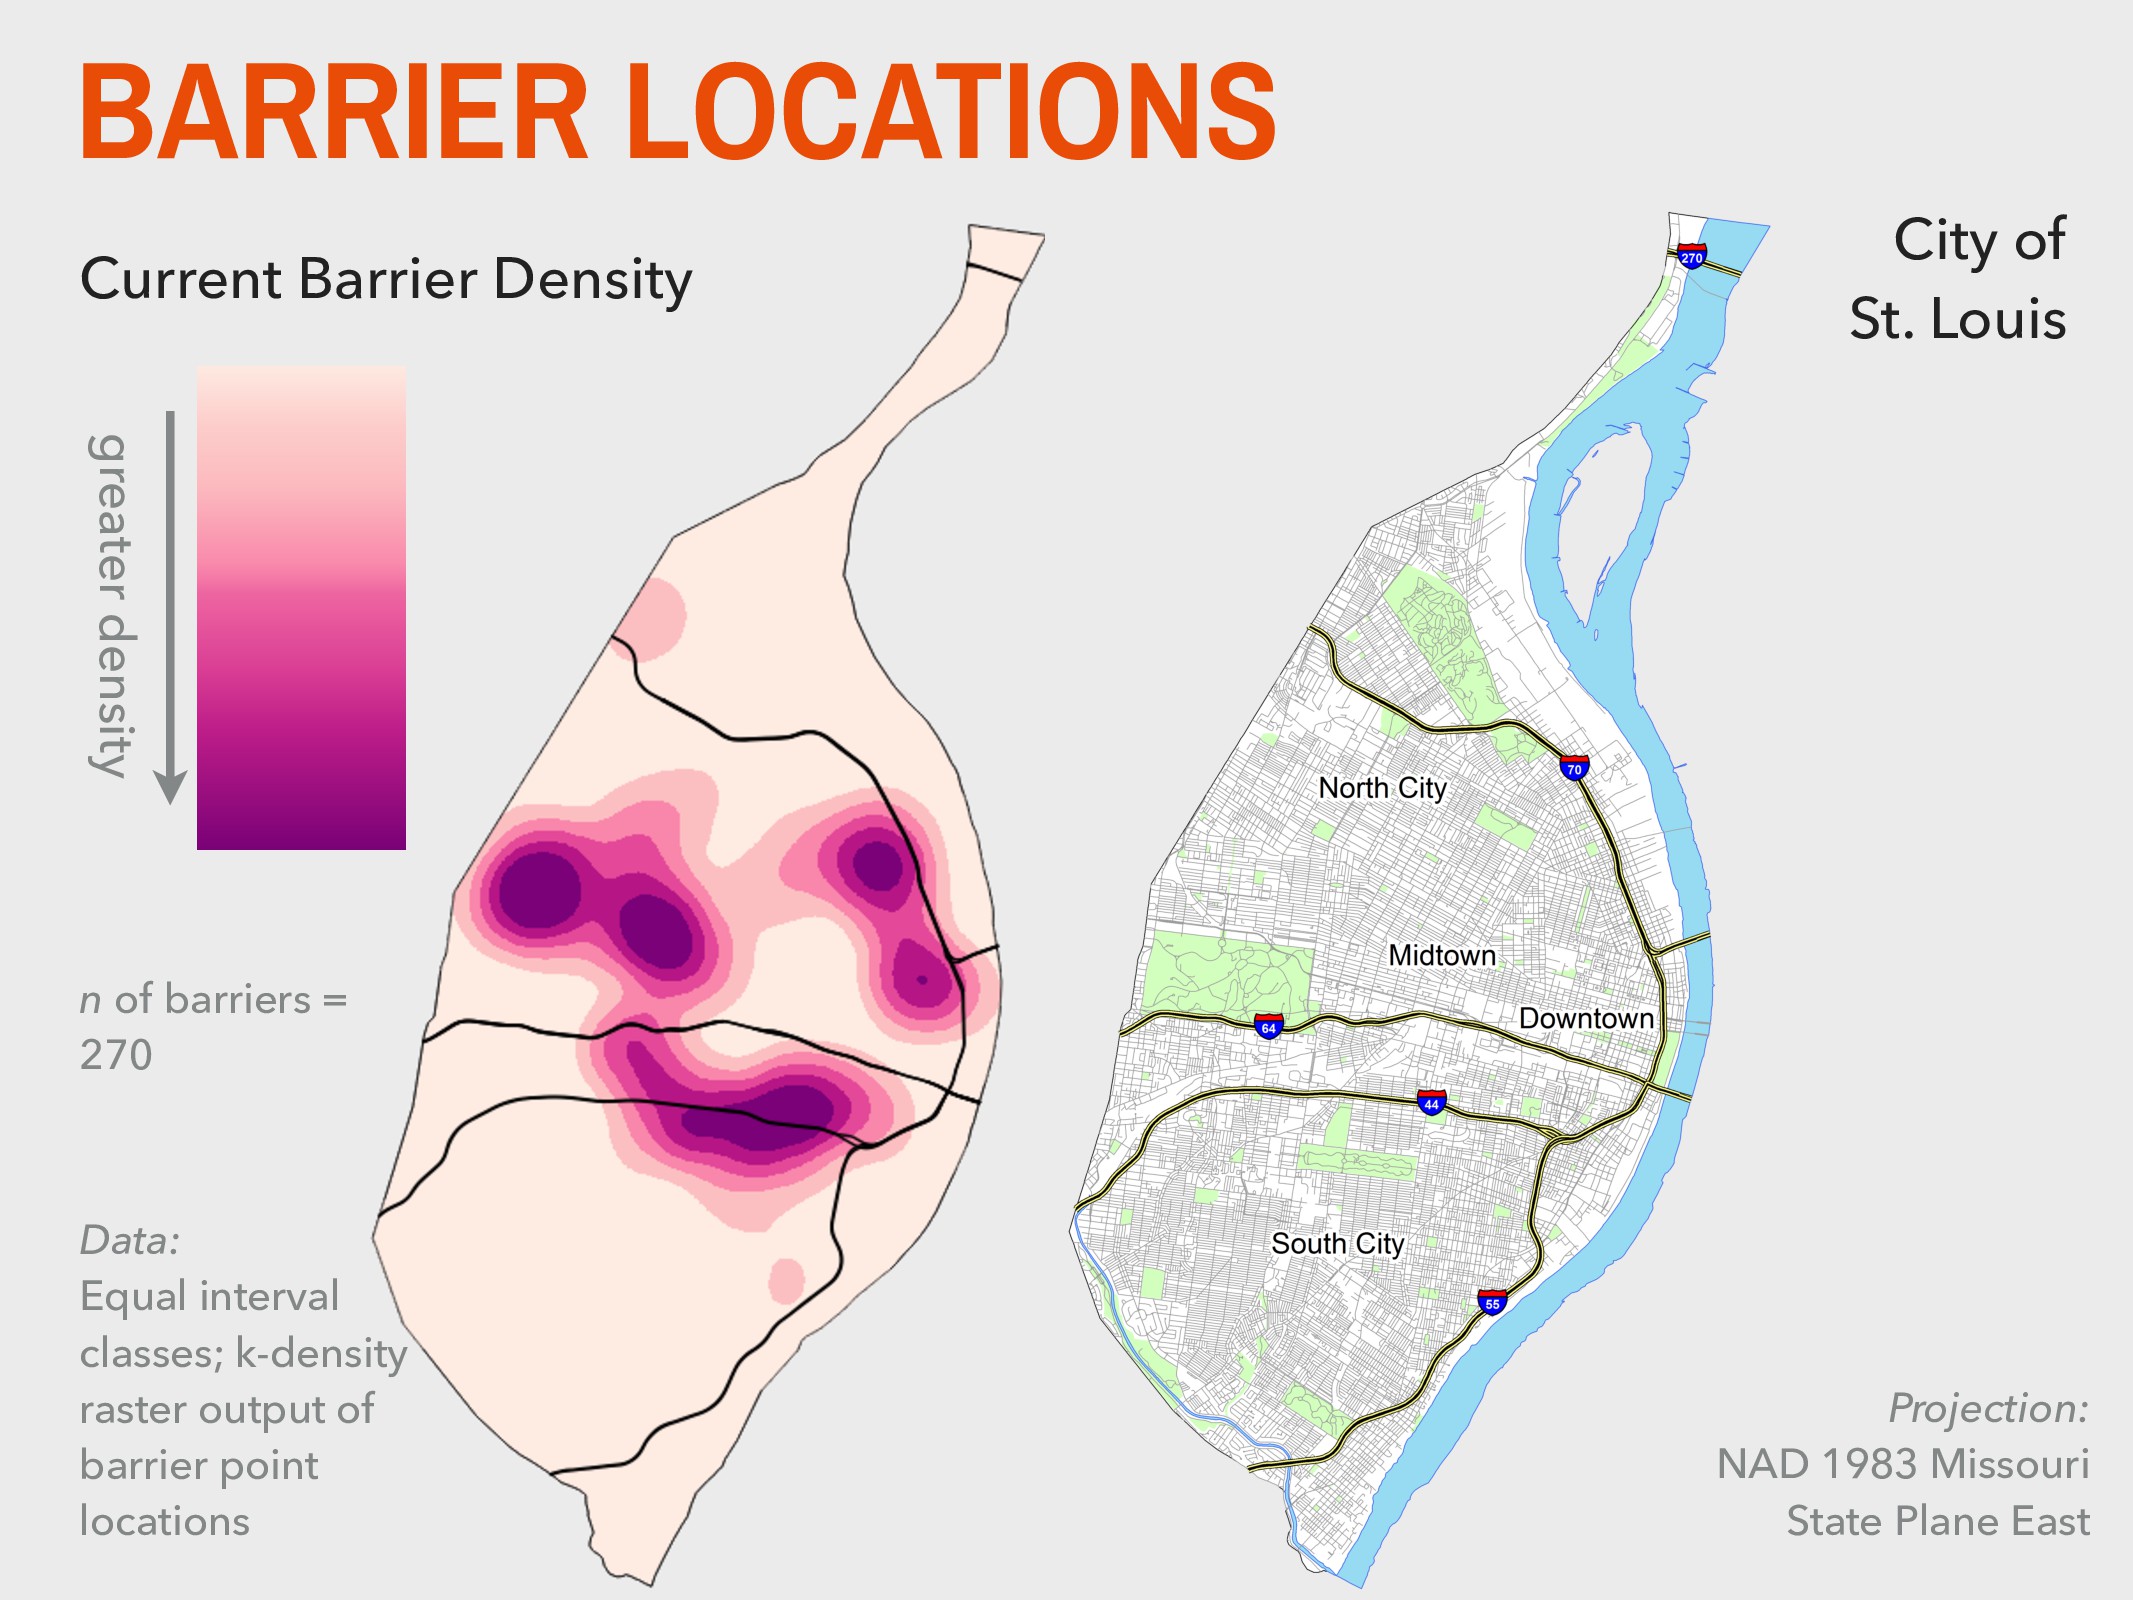
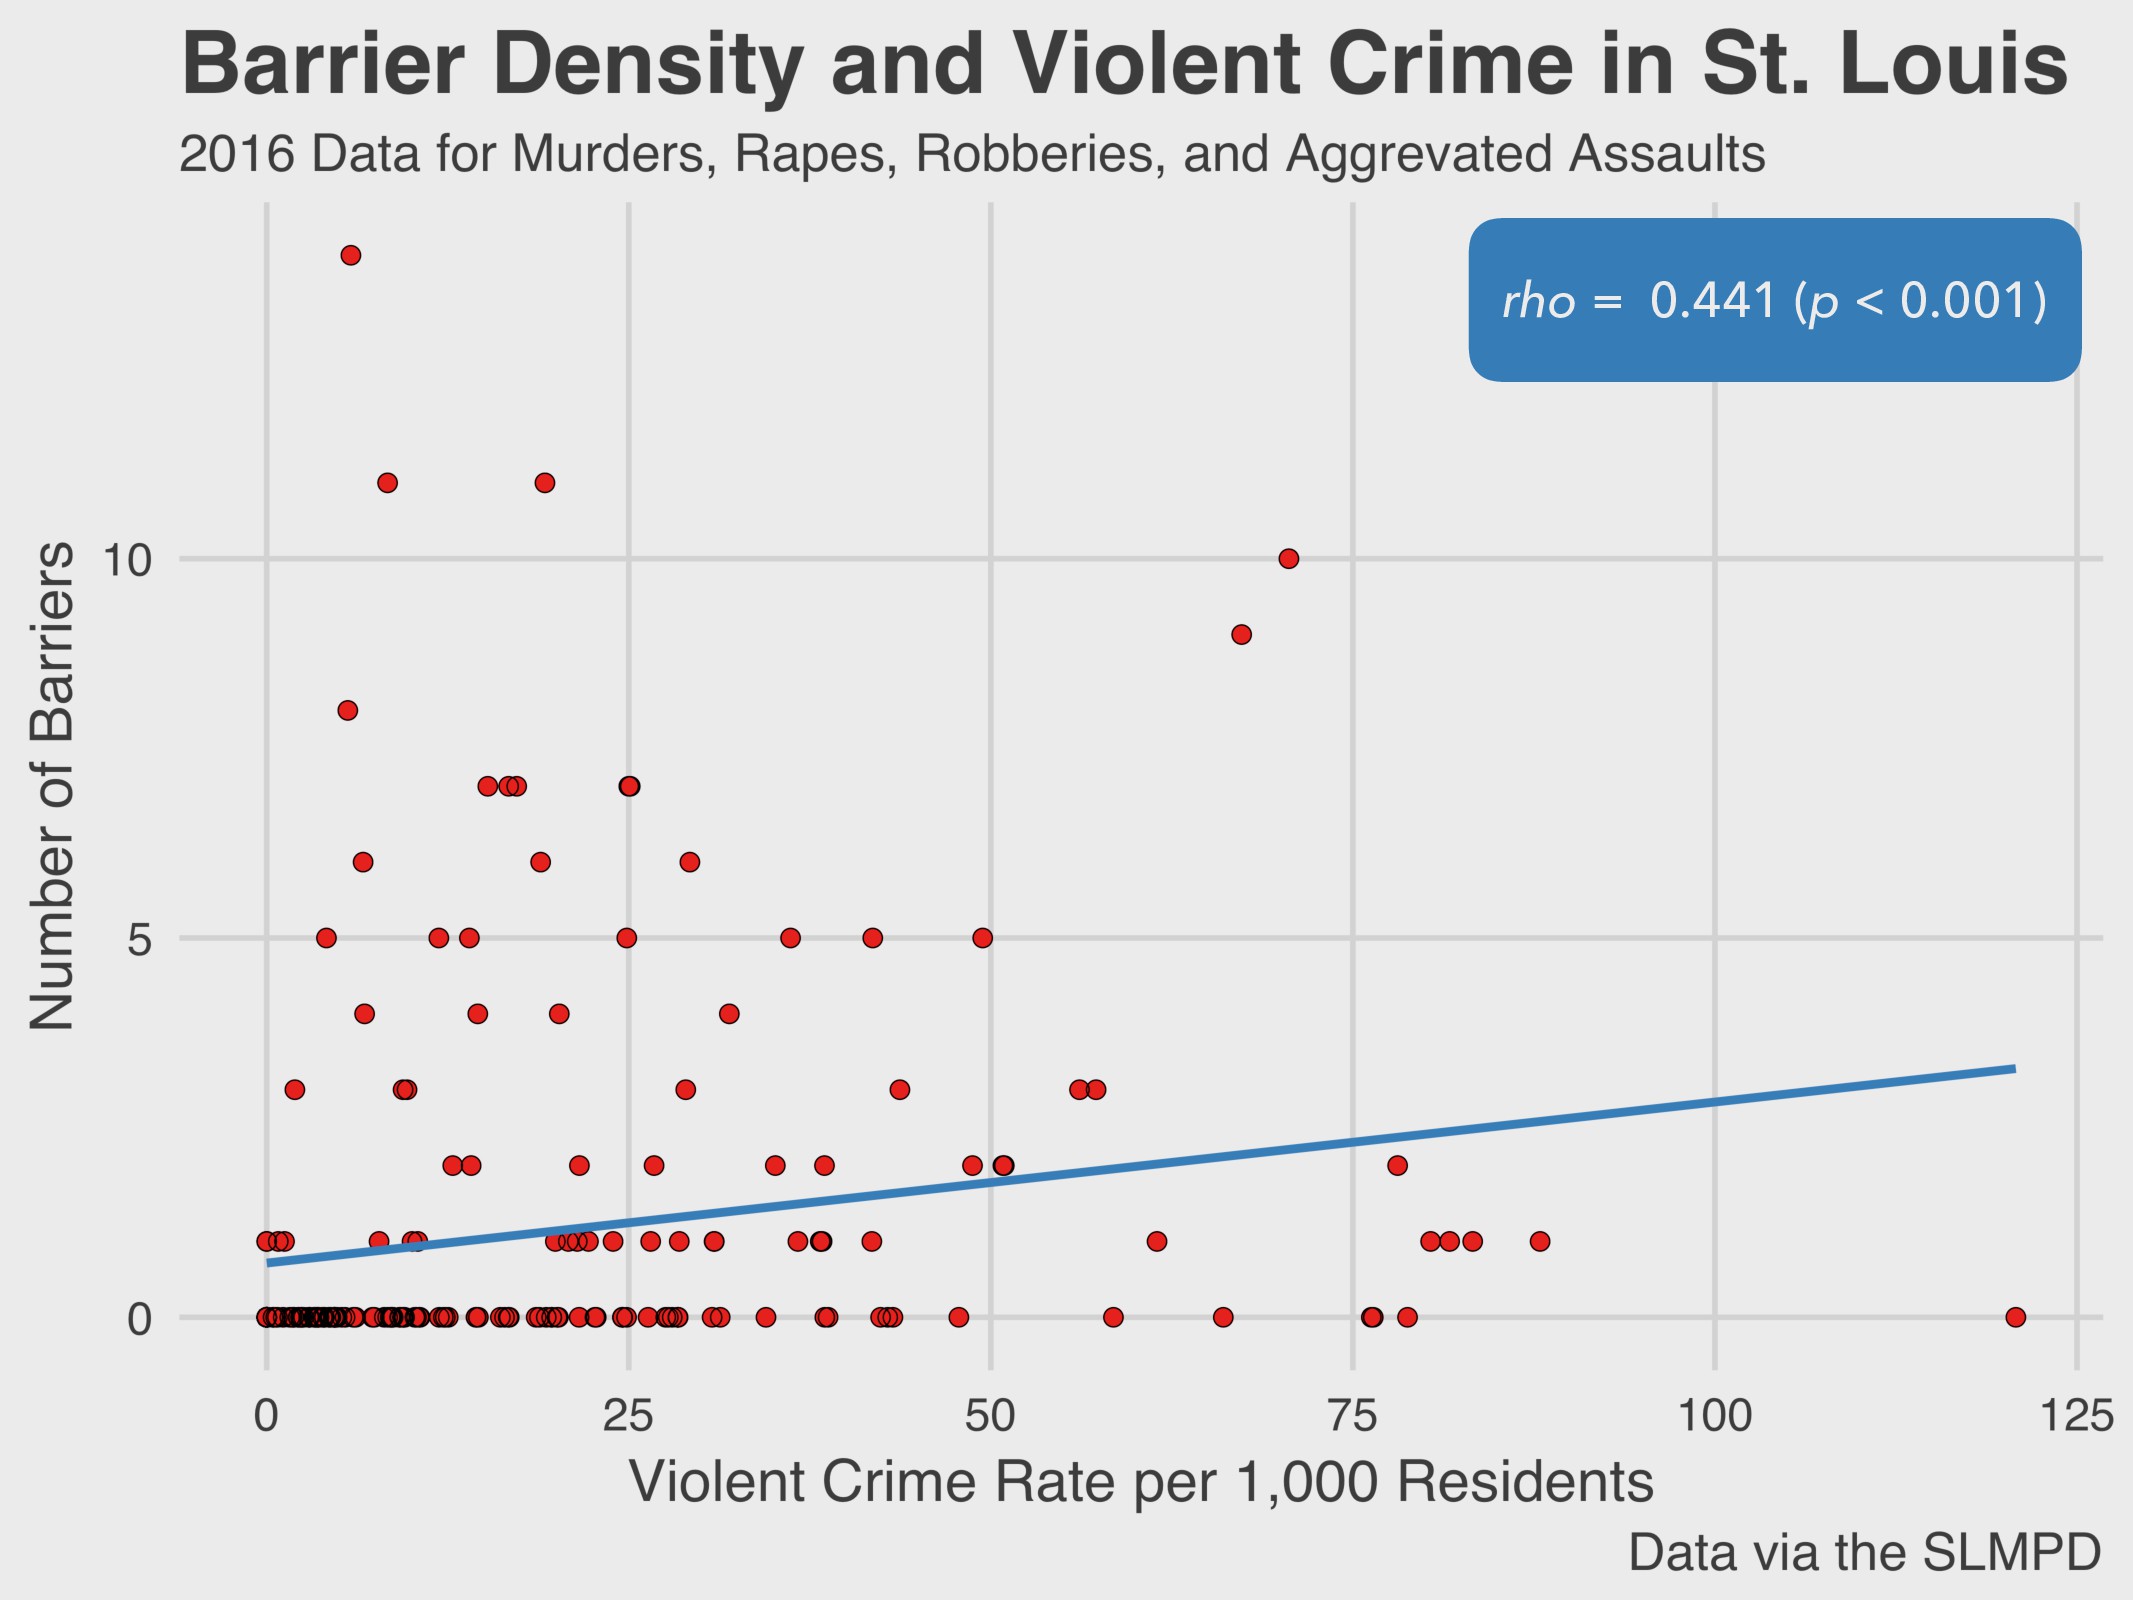
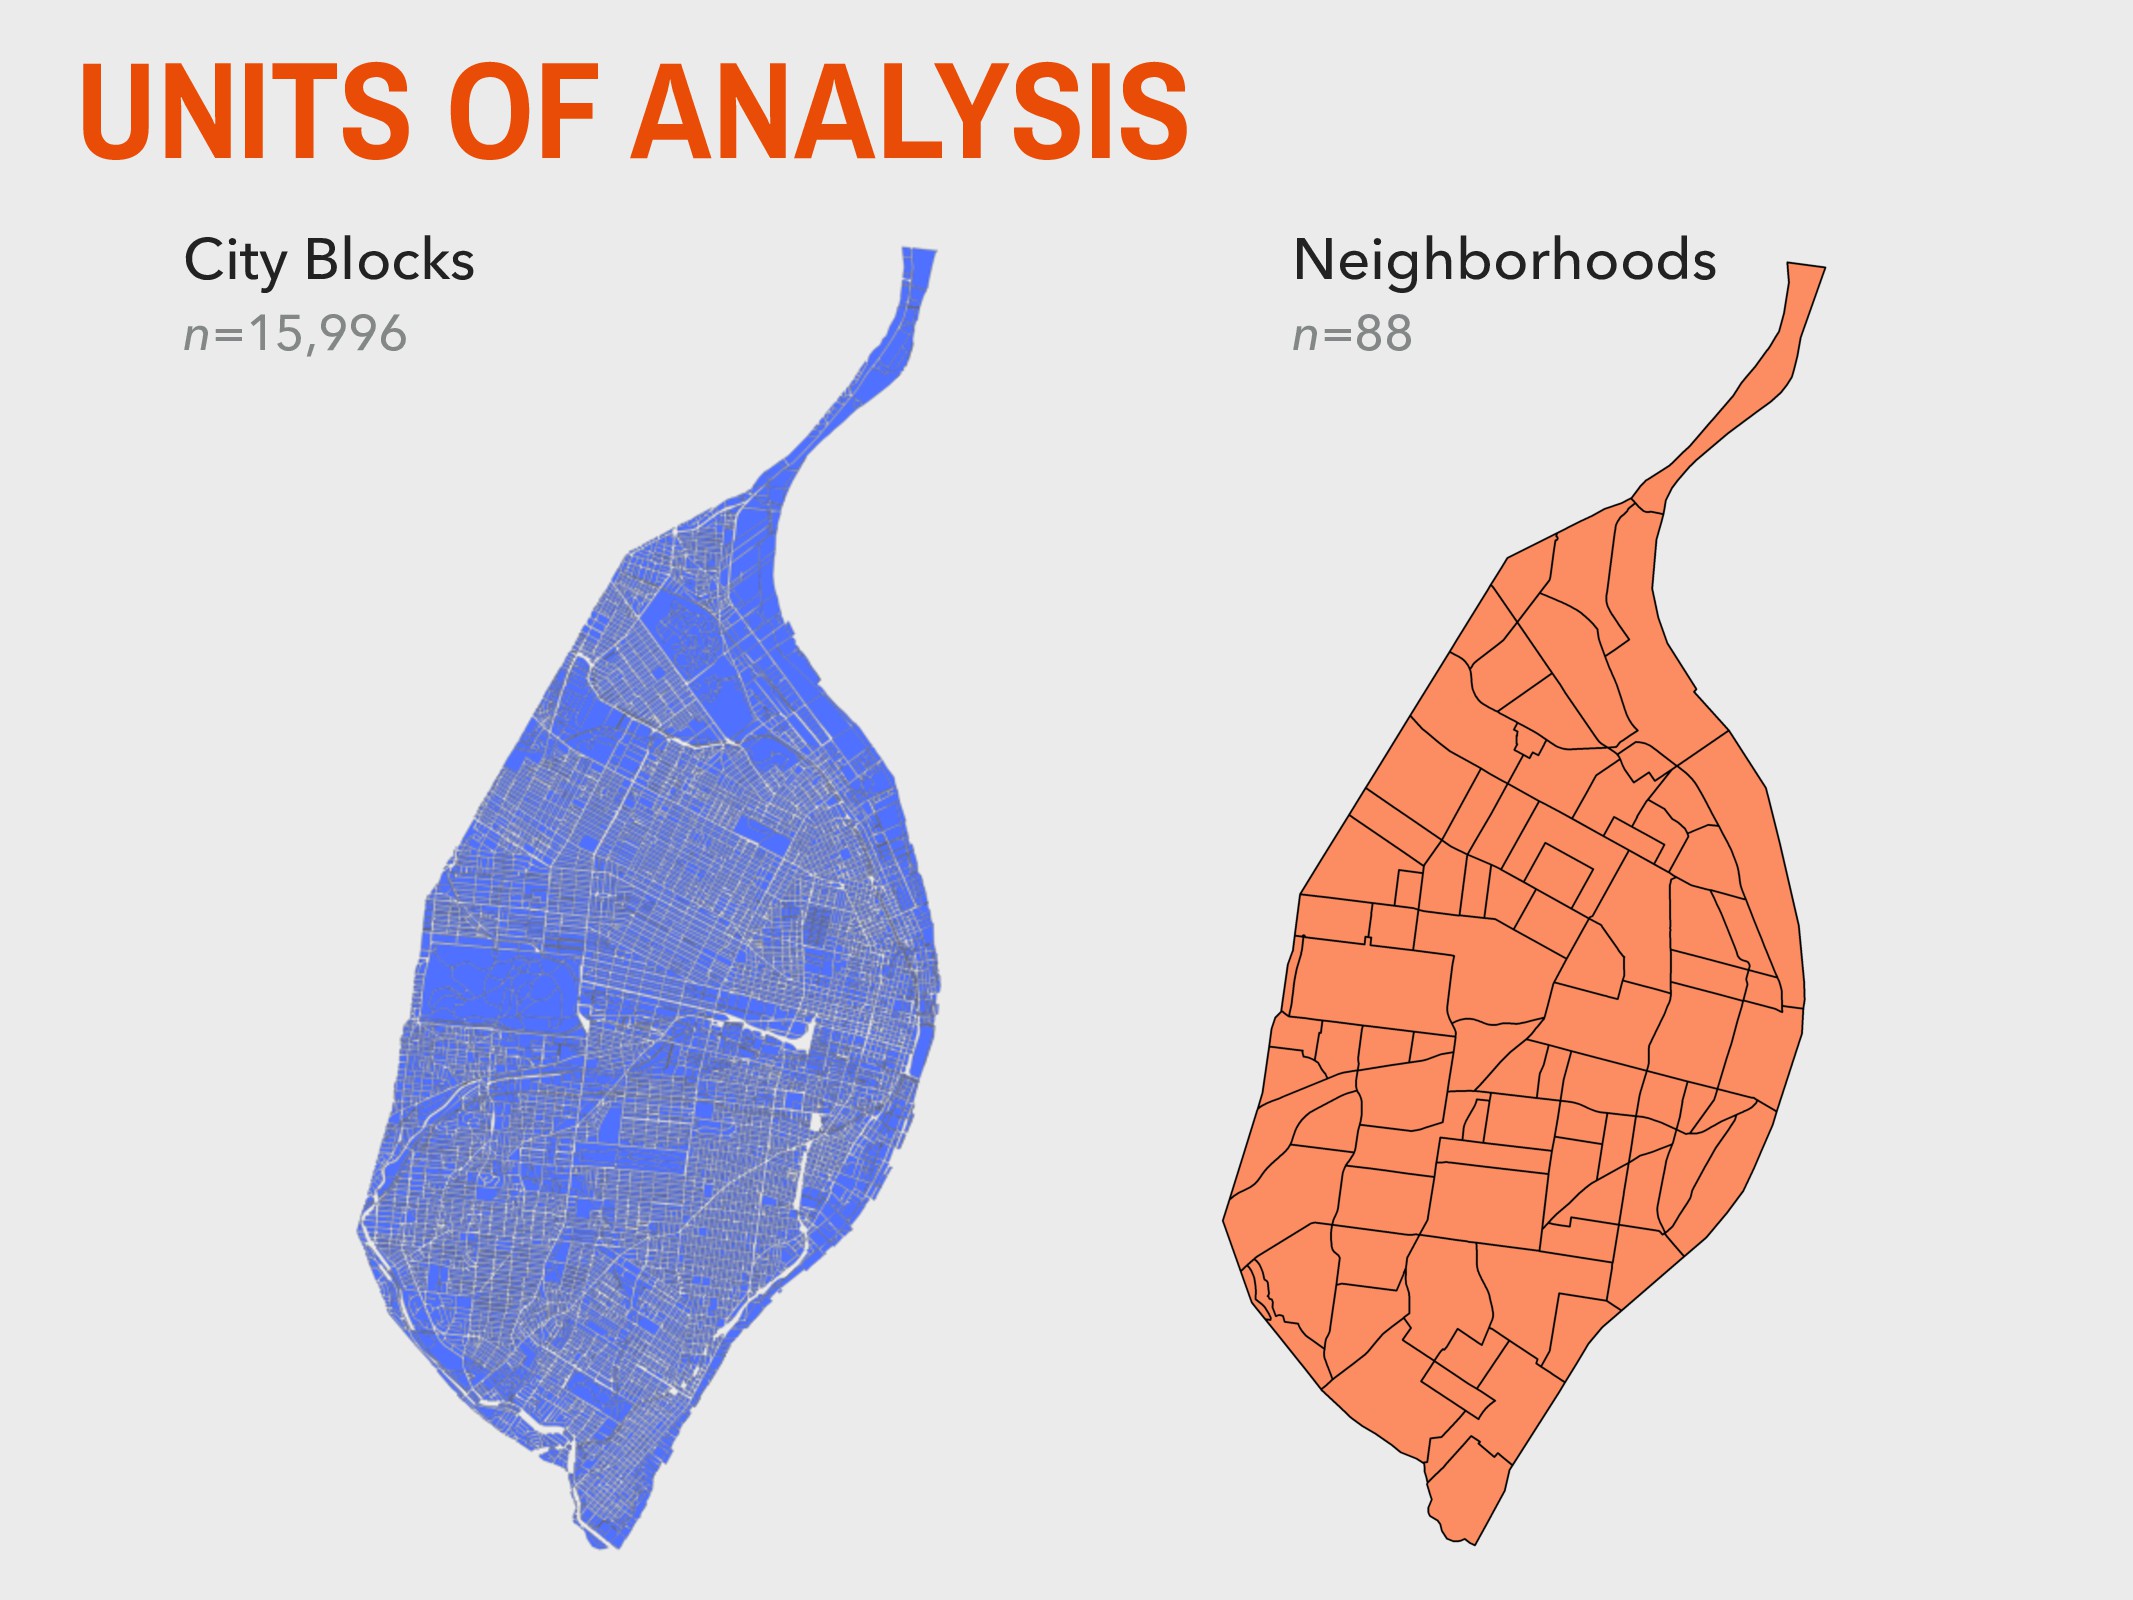
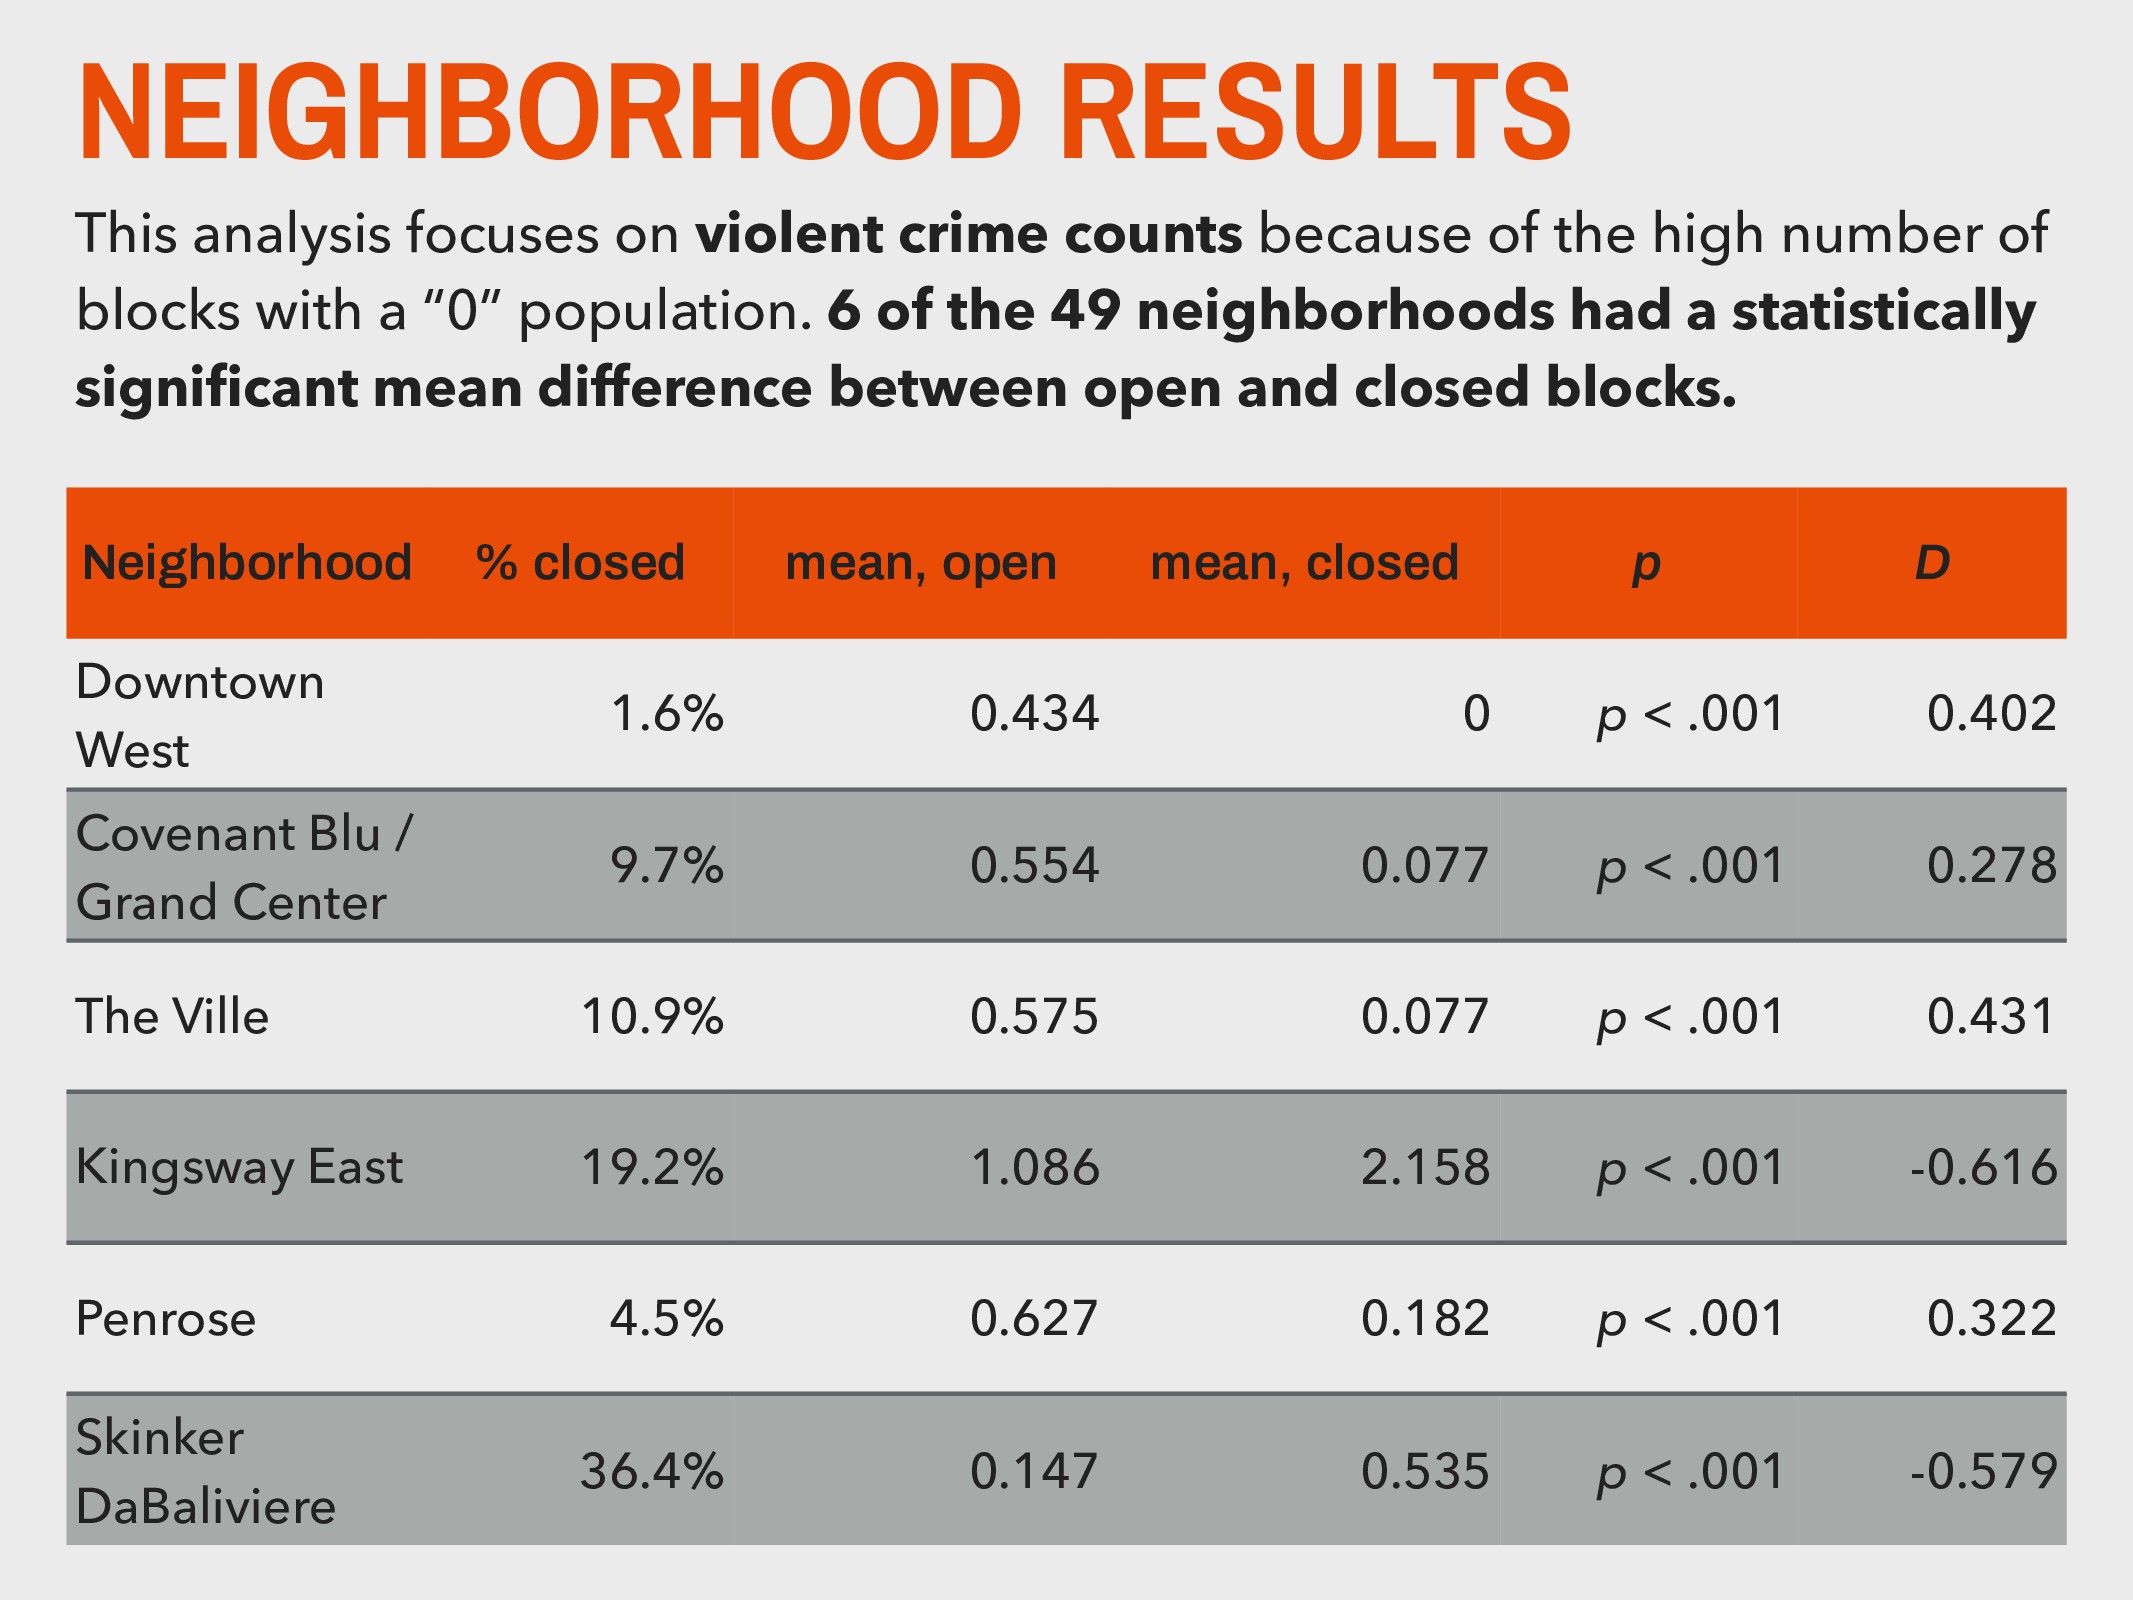
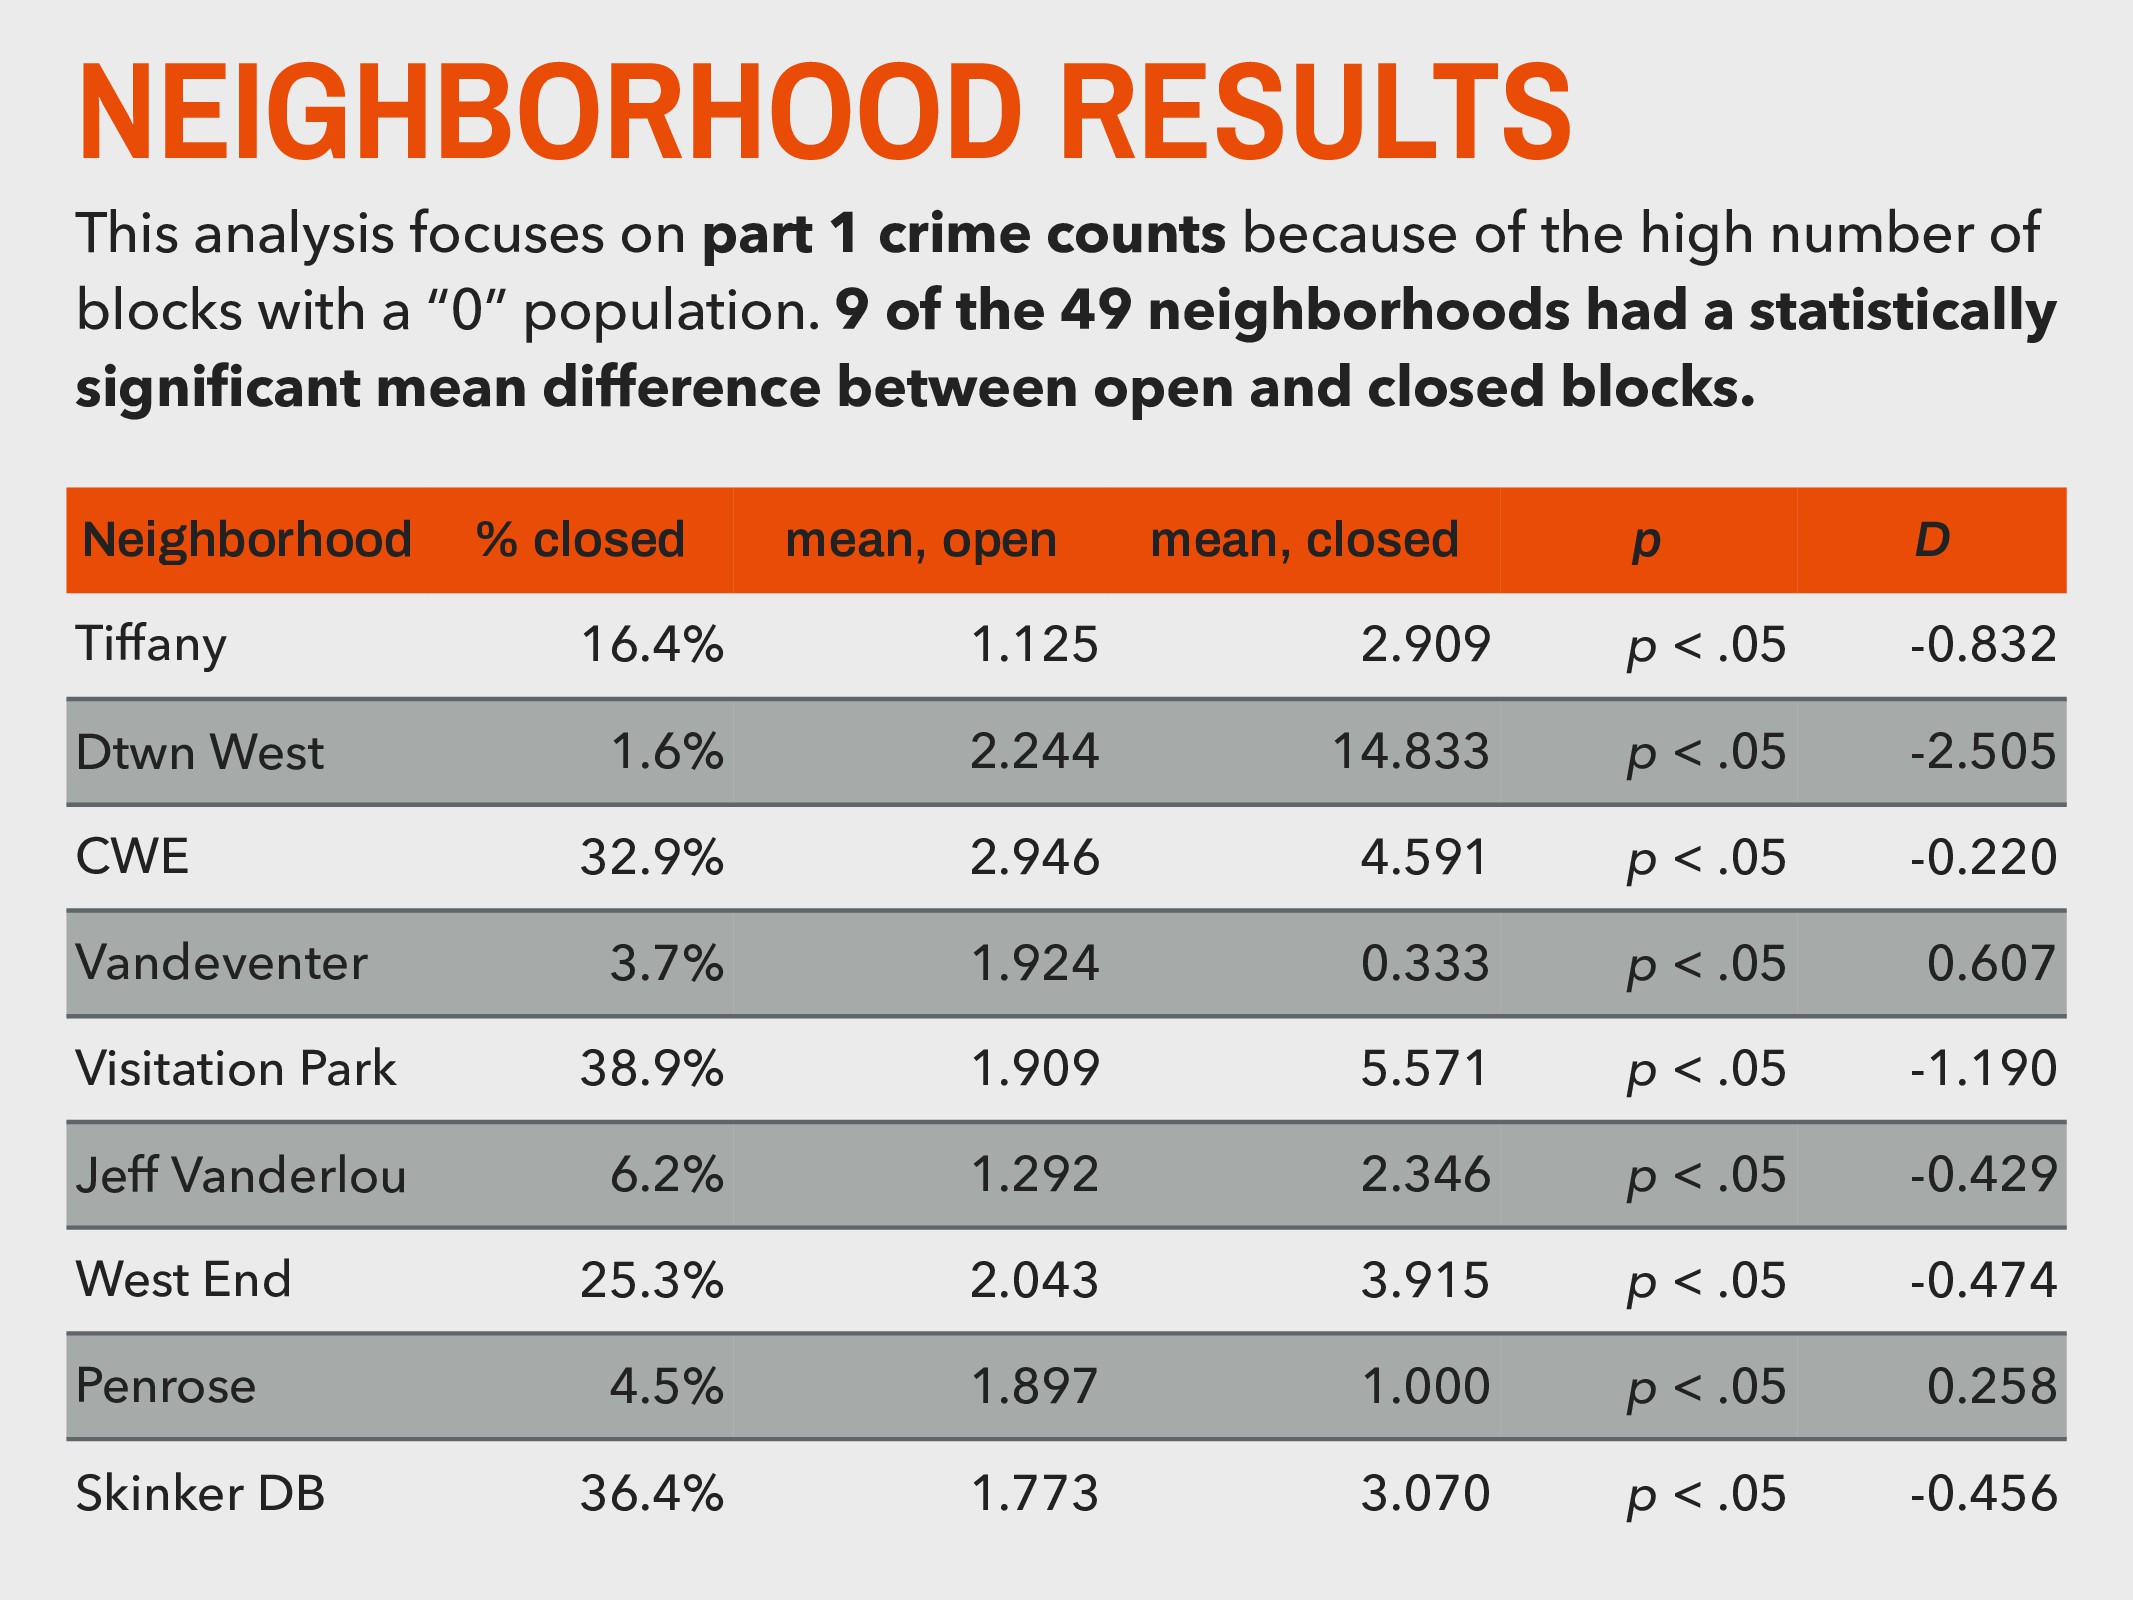
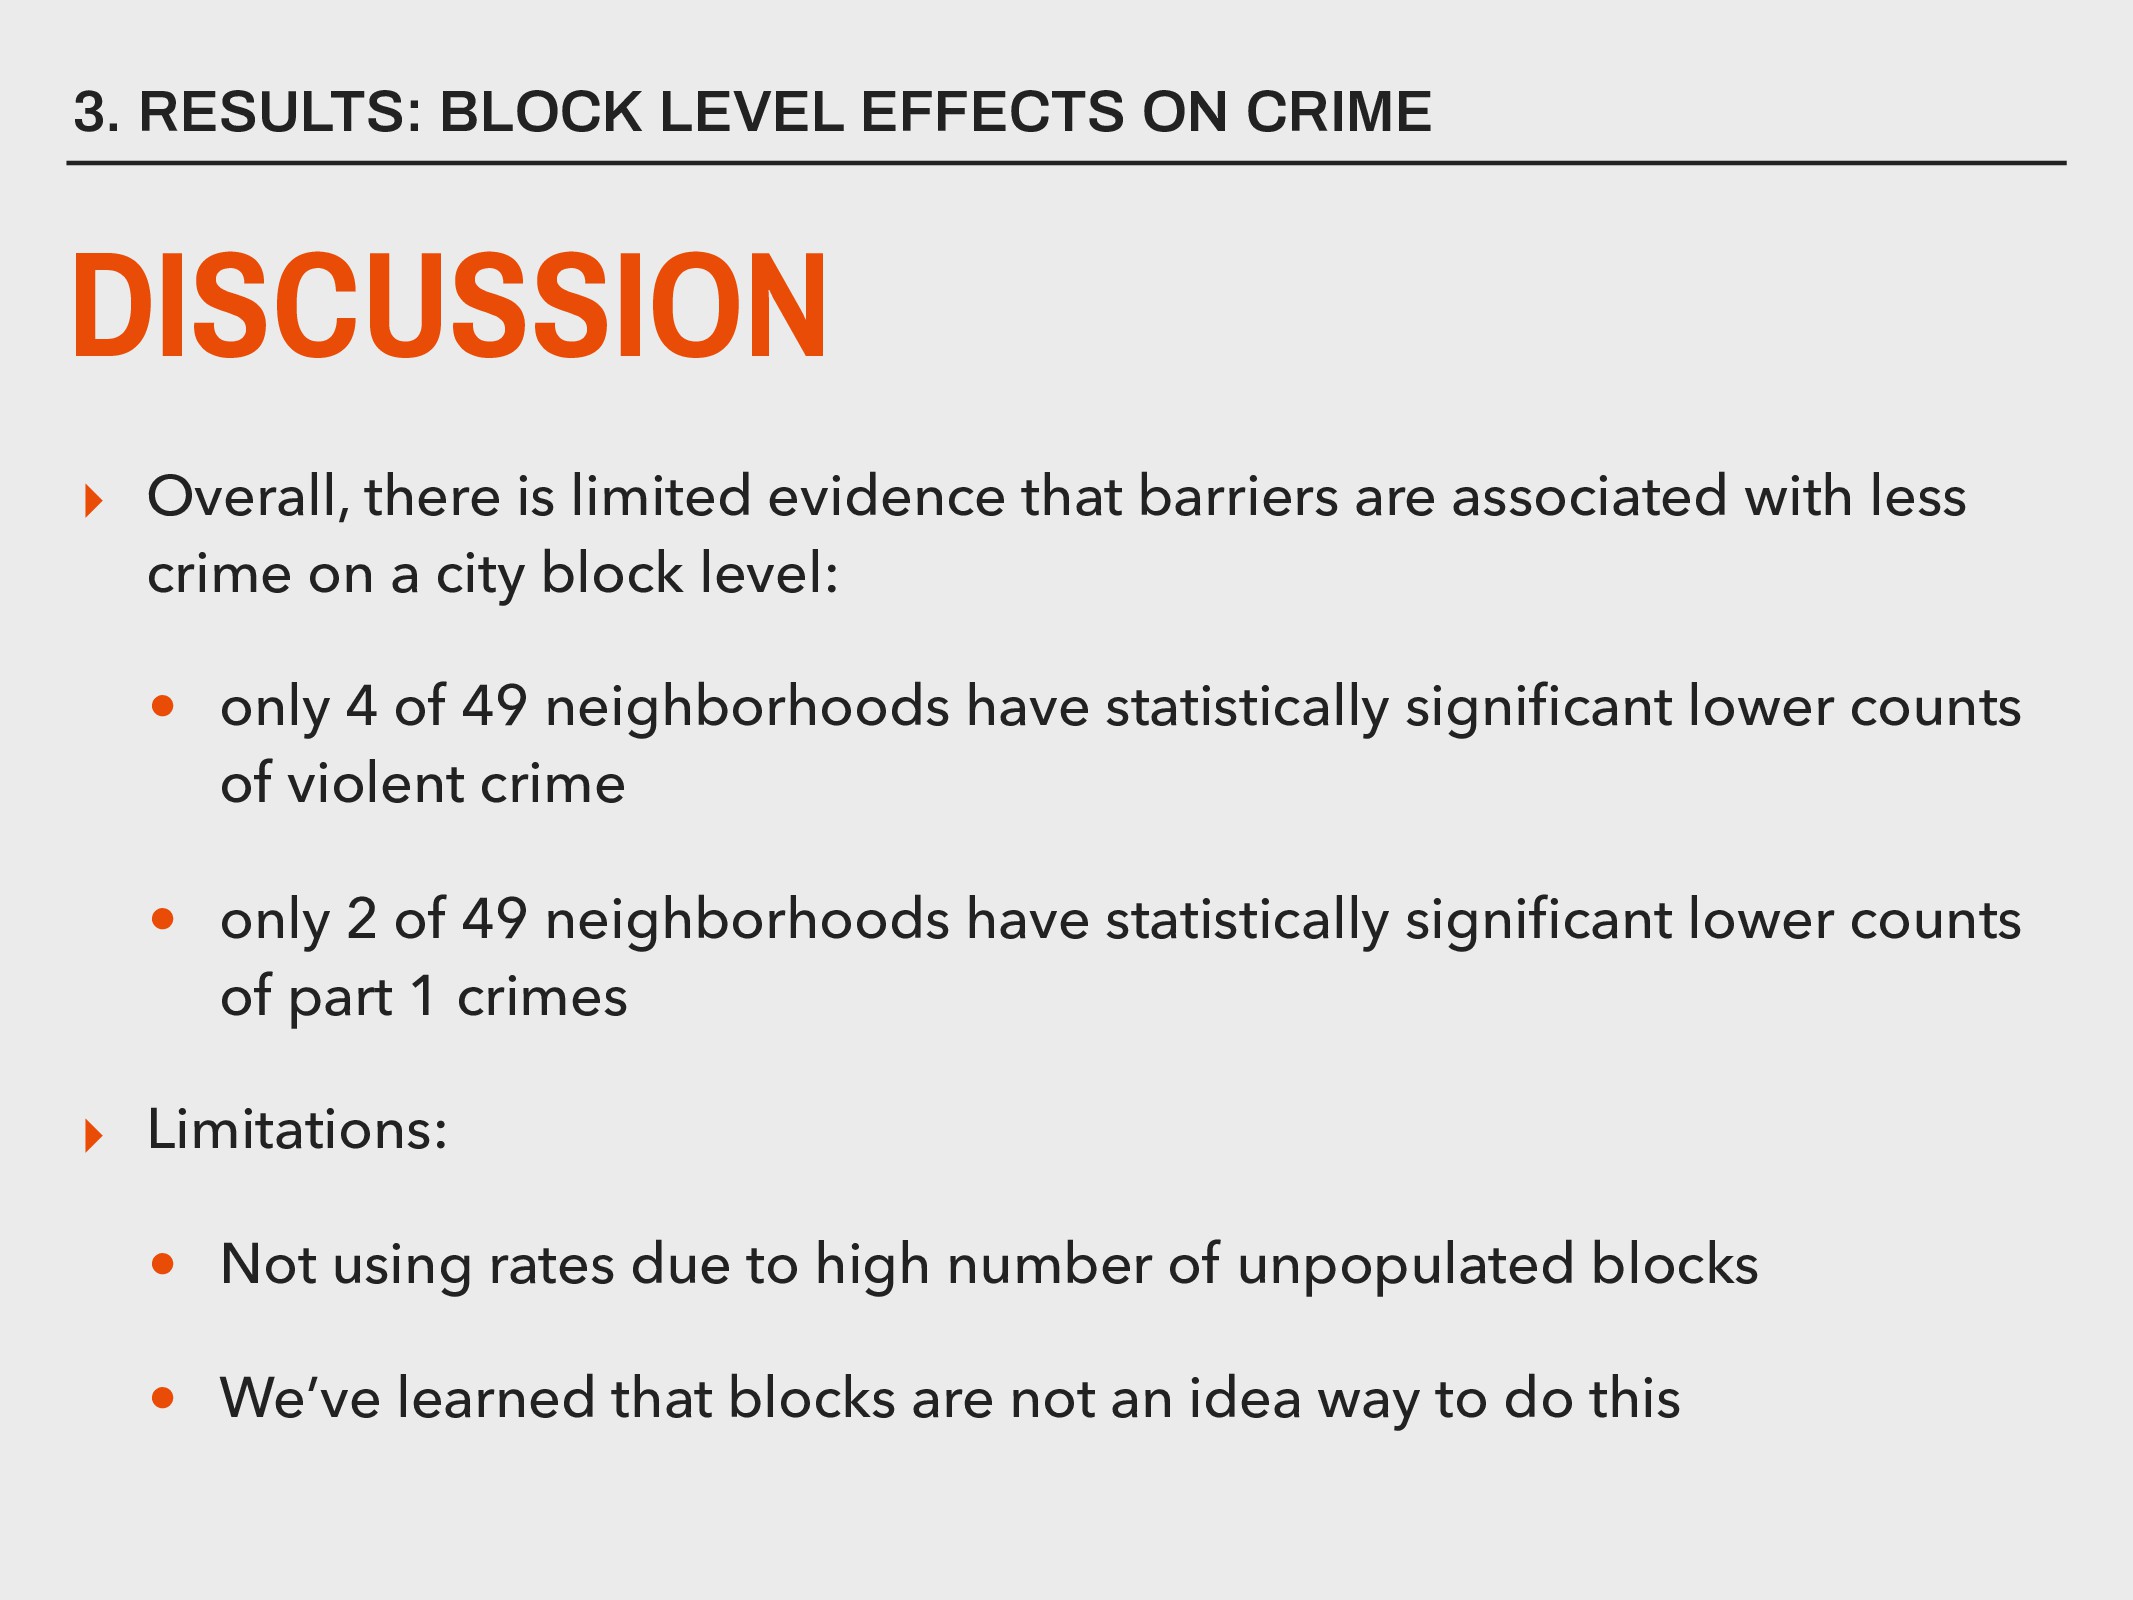
This presentation from the 2018 Urban Affairs Association annual meeting describes the systematic closure of streets in St. Louis, Missouri. We also present initial analyses showing that, at the city block level, higher numbers of closures are not associated with lower levels of crime.

Christopher Prener

April 05, 2018
Tweet

More Decks by Christopher Prener

Other Decks in Research

Transcript

  1. “STREET NOT THRU” STREET CLOSURES, NEIGHBORHOOD GEOGRAPHY, AND LOCAL CRIME

    RATES IN ST. LOUIS, MISSOURI CHRISTOPHER PRENER, PH.D. JOEL JENNINGS, PH.D. CREE FOELLER URBAN AFFAIRS ASSOCIATION TORONTO, ON APRIL 5, 2018
  2. AGENDA 1. What are street closures? 2. Data & Methods

    3. Results: Block-level Effects on Crime 4. Next Steps “STREET NOT THRU” / UAA 2018
  3. BARRIER LOCATIONS Current Barrier Density City of 
 St. Louis

    Projection:
 NAD 1983 Missouri State Plane East greater density n of barriers = 270 Data:
 Equal interval classes; k-density raster output of barrier point locations
  4. QUESTION If barrier density is 
 positively related to crime


    at the neighborhood level,
 are blocks that are closed safer than the surrounding neighborhood? ?
  5. DATA & METHODS Waldron Paper Barrier Location Data Locate Barriers

    Verify Barriers Mapping & Analysis Raw Crime Data Law Enforcement Cleaned Crime Data Block & Neighborhood Estimates
  6. 2. DATA & METHODS BLOCK-LEVEL CRIME This analysis focuses on

    crime counts because of the high number of blocks with a “0” population. Category min median mean max Violent Crimes 0.000 0.000 0.377 308.000 Part 1 Crimes 0.000 0.000 1.573 428.000
  7. 3. RESULTS: BLOCK LEVEL EFFECTS ON CRIME CITY-WIDE RESULTS This

    analysis focuses on violent crime counts because of the high number of blocks with a “0” population. Closed blocks have, on average, higher violent crime rates. Category n mean Not Blocked 15037 0.365 Blocked 959 0.556 W = 6397000, p < .001, d = .143
  8. 3. RESULTS: BLOCK LEVEL EFFECTS ON CRIME CITY-WIDE RESULTS This

    analysis focuses on part 1 crime counts because of the high number of blocks with a “0” population. Closed blocks have, on average, higher part 1 crime rates. Category n mean Not Blocked 15037 1.509 Blocked 959 2.578 W = 5401200, p < .001, d = .262
  9. LOCAL EFFECTS? Current Barrier Density greater density n of barriers

    = 270 Data:
 Equal interval classes; k-density raster output of barrier point locations
  10. LOCAL EFFECTS? n of barriers = 270 Segregation Current Barrier

    Density greater density Data:
 Equal interval classes; k-density raster output of barrier point locations
  11. LOCAL EFFECTS? n of barriers = 270 Current Barrier Density

    greater density Data:
 Equal interval classes; k-density raster output of barrier point locations 1 - 6 Barriers per
 Neighborhood 7 - 12 13 - 17 18 - 23 24 - 29 Data:
 Equal interval classes n of valid neighborhoods = 49
  12. NEIGHBORHOOD RESULTS This analysis focuses on violent crime counts because

    of the high number of blocks with a “0” population. 6 of the 49 neighborhoods had a statistically significant mean difference between open and closed blocks. Neighborhood % closed mean, open mean, closed p D Downtown West 1.6% 0.434 0 p < .001 0.402 Covenant Blu / Grand Center 9.7% 0.554 0.077 p < .001 0.278 The Ville 10.9% 0.575 0.077 p < .001 0.431 Kingsway East 19.2% 1.086 2.158 p < .001 -0.616 Penrose 4.5% 0.627 0.182 p < .001 0.322 Skinker DaBaliviere 36.4% 0.147 0.535 p < .001 -0.579
  13. NEIGHBORHOOD RESULTS This analysis focuses on part 1 crime counts

    because of the high number of blocks with a “0” population. 9 of the 49 neighborhoods had a statistically significant mean difference between open and closed blocks. Neighborhood % closed mean, open mean, closed p D Tiffany 16.4% 1.125 2.909 p < .05 -0.832 Dtwn West 1.6% 2.244 14.833 p < .05 -2.505 CWE 32.9% 2.946 4.591 p < .05 -0.220 Vandeventer 3.7% 1.924 0.333 p < .05 0.607 Visitation Park 38.9% 1.909 5.571 p < .05 -1.190 Jeff Vanderlou 6.2% 1.292 2.346 p < .05 -0.429 West End 25.3% 2.043 3.915 p < .05 -0.474 Penrose 4.5% 1.897 1.000 p < .05 0.258 Skinker DB 36.4% 1.773 3.070 p < .05 -0.456
  14. 3. RESULTS: BLOCK LEVEL EFFECTS ON CRIME DISCUSSION ▸ Overall,

    there is limited evidence that barriers are associated with less crime on a city block level: • only 4 of 49 neighborhoods have statistically significant lower counts of violent crime • only 2 of 49 neighborhoods have statistically significant lower counts of part 1 crimes ▸ Limitations: • Not using rates due to high number of unpopulated blocks • We’ve learned that blocks are not an idea way to do this
  15. 4. NEXT STEPS NEXT STEPS ▸ Multivariate modeling of the

    relationship between barrier density and crime - will allow us to account for variation in population ▸ Regardless of any crime effect, we are interested in: • the demographic processes that brought barriers into neighborhoods • the association between barrier type and neighborhood disorder • the legal process for installing barriers • how policymakers in St. Louis view closures
  16. Slides available via SpeakerDeck LEARN MORE THANKS FOR COMING! Caution

    Text You can find out more about our project and, soon, download our initial release of data at:
 https://chris-prener.github.io/barriers/ [email protected]
 https://chris-prener.github.io
 , :