$30 off During Our Annual Pro Sale. View Details »

How to write SQL queries | pgDay Paris 2019 | Dimitri Fontaine

How to write SQL queries | pgDay Paris 2019 | Dimitri Fontaine

Most of the time we see finished SQL queries, either in code repositories, blog posts of talk slides. This talk focus on the process of how to write an SQL query, from a problem statement expressed in English to code review and long term maintenance of SQL code.

Citus Data

March 12, 2019
Tweet

More Decks by Citus Data

Other Decks in Technology

Transcript

  1. How to write SQL queries?
    P G D A Y . P A R I S 2 0 1 9 , P A R I S | M A R C H 1 2 , 2 0 1 9
    Dimitri Fontaine
    Citus Data
    @tapoueh

    View Slide

  2. View Slide

  3. PostgreSQL
    P O S T G R E S Q L M A J O R C O N T R I B U T O R

    View Slide

  4. Citus Data
    C U R R E N T L Y W O R K I N G A T

    View Slide

  5. pgloader.io

    View Slide

  6. SQL Queries

    View Slide

  7. Monthly Report, WoW%, SQL
    with computed_data as
    (
    select cast(date as date) as date,
    to_char(date, 'Dy') as day,
    coalesce(dollars, 0) as dollars,
    lag(dollars, 1)
    over(
    partition by extract('isodow' from date)
    order by date
    )
    as last_week_dollars
    from /*
    * Generate the month calendar, plus a week
    * before so that we have values to compare
    * dollars against even for the first week
    * of the month.
    */
    generate_series(date :'start' - interval '1 week',
    date :'start' + interval '1 month'
    - interval '1 day',
    interval '1 day'
    )
    as calendar(date)
    left join factbook using(date)
    )
    select date, day,
    to_char(
    coalesce(dollars, 0),
    'L99G999G999G999'
    ) as dollars,
    case when dollars is not null
    and dollars <> 0
    then round( 100.0
    * (dollars - last_week_dollars)
    / dollars
    , 2)
    end
    as "WoW %"
    from computed_data
    where date >= date :'start'
    order by date;

    View Slide

  8. Monthly Report, Fixed, SQL
    select cast(calendar.entry as date) as date,
    coalesce(shares, 0) as shares,
    coalesce(trades, 0) as trades,
    to_char(
    coalesce(dollars, 0),
    'L99G999G999G999'
    ) as dollars
    from /*
    * Generate the target month's calendar then LEFT JOIN
    * each day against the factbook dataset, so as to have
    * every day in the result set, whether or not we have a
    * book entry for the day.
    */
    generate_series(date :'start',
    date :'start' + interval '1 month'
    - interval '1 day',
    interval '1 day'
    )
    as calendar(entry)
    left join factbook
    on factbook.date = calendar.entry
    order by date;

    View Slide

  9. Monthly Report, SQL
    \set start '2017-02-01'
    select date,
    to_char(shares, '99G999G999G999') as shares,
    to_char(trades, '99G999G999') as trades,
    to_char(dollars, 'L99G999G999G999') as dollars
    from factbook
    where date >= date :'start'
    and date < date :'start' + interval '1 month'
    order by date;

    View Slide

  10. Monthly Report, SQL
    date │ shares │ trades │ dollars
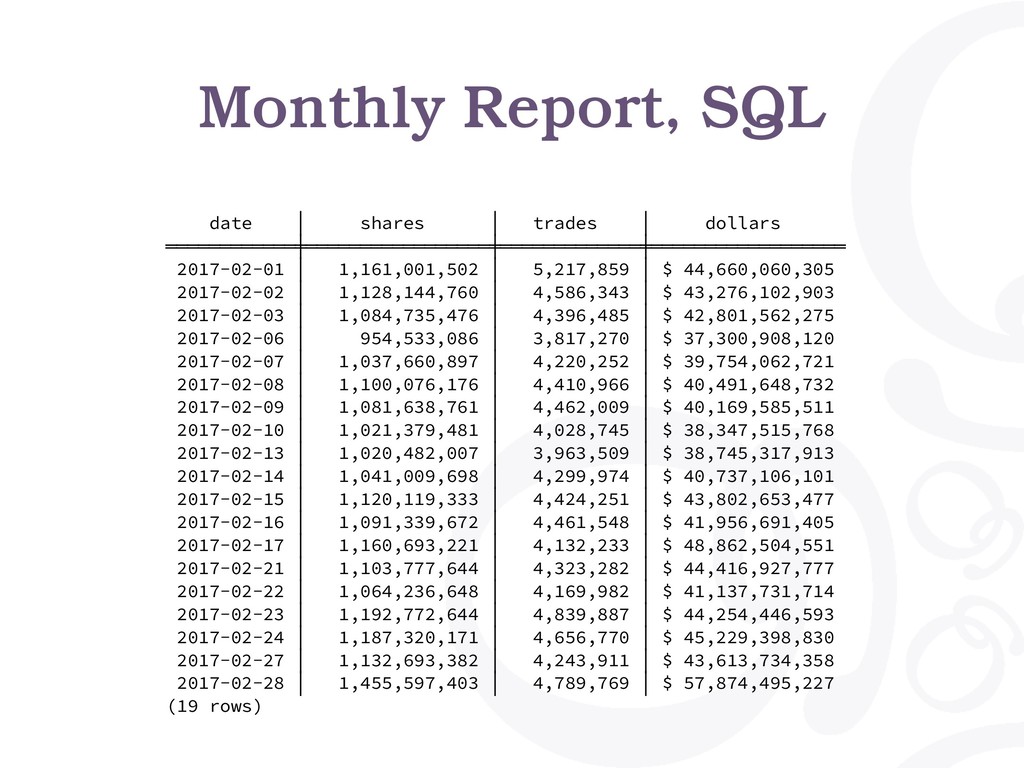
    ════════════╪═════════════════╪═════════════╪══════════════════
    2017-02-01 │ 1,161,001,502 │ 5,217,859 │ $ 44,660,060,305
    2017-02-02 │ 1,128,144,760 │ 4,586,343 │ $ 43,276,102,903
    2017-02-03 │ 1,084,735,476 │ 4,396,485 │ $ 42,801,562,275
    2017-02-06 │ 954,533,086 │ 3,817,270 │ $ 37,300,908,120
    2017-02-07 │ 1,037,660,897 │ 4,220,252 │ $ 39,754,062,721
    2017-02-08 │ 1,100,076,176 │ 4,410,966 │ $ 40,491,648,732
    2017-02-09 │ 1,081,638,761 │ 4,462,009 │ $ 40,169,585,511
    2017-02-10 │ 1,021,379,481 │ 4,028,745 │ $ 38,347,515,768
    2017-02-13 │ 1,020,482,007 │ 3,963,509 │ $ 38,745,317,913
    2017-02-14 │ 1,041,009,698 │ 4,299,974 │ $ 40,737,106,101
    2017-02-15 │ 1,120,119,333 │ 4,424,251 │ $ 43,802,653,477
    2017-02-16 │ 1,091,339,672 │ 4,461,548 │ $ 41,956,691,405
    2017-02-17 │ 1,160,693,221 │ 4,132,233 │ $ 48,862,504,551
    2017-02-21 │ 1,103,777,644 │ 4,323,282 │ $ 44,416,927,777
    2017-02-22 │ 1,064,236,648 │ 4,169,982 │ $ 41,137,731,714
    2017-02-23 │ 1,192,772,644 │ 4,839,887 │ $ 44,254,446,593
    2017-02-24 │ 1,187,320,171 │ 4,656,770 │ $ 45,229,398,830
    2017-02-27 │ 1,132,693,382 │ 4,243,911 │ $ 43,613,734,358
    2017-02-28 │ 1,455,597,403 │ 4,789,769 │ $ 57,874,495,227
    (19 rows)

    View Slide

  11. The data model

    View Slide

  12. Races, drivers, results
    appdev> \dt f1db.
    List of relations
    Schema │ Name │ Type │ Owner
    ════════╪══════════════════════╪═══════╪════════
    f1db │ circuits │ table │ appdev
    f1db │ constructorresults │ table │ appdev
    f1db │ constructors │ table │ appdev
    f1db │ constructorstandings │ table │ appdev
    f1db │ drivers │ table │ appdev
    f1db │ driverstandings │ table │ appdev
    f1db │ laptimes │ table │ appdev
    f1db │ pitstops │ table │ appdev
    f1db │ qualifying │ table │ appdev
    f1db │ races │ table │ appdev
    f1db │ results │ table │ appdev
    f1db │ seasons │ table │ appdev
    f1db │ status │ table │ appdev
    (13 rows)

    View Slide

  13. Races
    select * from races limit 1;

    ─[ RECORD 1 ]──────────────────────────────────────────────────────
    raceid │ 1
    year │ 2009
    round │ 1
    circuitid │ 1
    name │ Australian Grand Prix
    date │ 2009-03-29
    time │ 06:00:00
    url │ http://en.wikipedia.org/wiki/2009_Australian_Grand_Prix

    View Slide

  14. Drivers
    select code,
    format('%s %s', forename, surname) as fullname,
    forename,
    surname
    from drivers;
    code │ fullname │ forename │ surname
    ══════╪════════════════╪══════════╪══════════
    HAM │ Lewis Hamilton │ Lewis │ Hamilton
    HEI │ Nick Heidfeld │ Nick │ Heidfeld
    ROS │ Nico Rosberg │ Nico │ Rosberg
    (3 rows)

    View Slide

  15. Results
    select code, forename, surname,
    count(*) as wins
    from drivers
    join results using(driverid)
    where position = 1
    group by driverid
    order by wins desc
    limit 3;
    code │ forename │ surname │ wins
    ══════╪══════════╪════════════╪══════
    MSC │ Michael │ Schumacher │ 91
    HAM │ Lewis │ Hamilton │ 56
    ¤ │ Alain │ Prost │ 51
    (3 rows)

    View Slide

  16. How to write SQL

    View Slide

  17. Inquiries
    • Business Cases
    • User Stories
    • Marketing dept.
    • Dashboards
    • Practice

    View Slide

  18. display all the races from a
    quarter with their winner
    \set beginning '2017-04-01'
    \set months 3

    View Slide

  19. display all the races from a
    quarter with their winner
    select date, name, drivers.surname as winner
    from races
    left join results
    on results.raceid = races.raceid
    and results.position = 1
    left join drivers using(driverid)
    where date >= date :'beginning'
    and date < date :'beginning'
    + :months * interval '1 month';

    View Slide

  20. select date, name, drivers.surname as winner
    from races
    left join
    ( select raceid, driverid
    from results
    where position = 1
    )
    as winners using(raceid)
    left join drivers using(driverid)
    where date >= date :'beginning'
    and date < date :'beginning'
    + :months * interval '1 month';
    display all the races from a
    quarter with their winner

    View Slide

  21. Top-3 drivers by decade

    View Slide

  22. Top-3 drivers by decade
    with decades as (
    select extract('year' from date_trunc('decade', date))::int as decade
    from races
    group by decade
    )
    select decade,
    rank() over (partition by decade order by points desc) as rank,
    surname,
    points
    from decades
    left join lateral
    (
    select surname, sum(points) as points
    from races
    join results using(raceid)
    join drivers using(driverid)
    where extract('year' from date_trunc('decade', races.date))::int
    = decades.decade
    group by surname
    order by sum(points) desc
    limit 3
    )
    as winners on true
    order by decade, points desc;

    View Slide

  23. Compute cumulated constructor
    and drivers points in a season

    View Slide

  24. Compute cumulated constructor
    and drivers points in a season
    select drivers.surname as driver,
    constructors.name as constructor,
    sum(points) as points
    from results
    join races using(raceid)
    join drivers using(driverid)
    join constructors using(constructorid)
    where date >= :season
    and date < :season + interval '1 year'
    group by grouping sets((drivers.surname),
    (constructors.name))
    having sum(points) > 20
    order by constructors.name is not null,
    drivers.surname is not null,
    points desc;

    View Slide

  25. PostgreSQL Extensions

    View Slide

  26. Geolocation: ip4r
    select *
    from geolite.blocks
    join geolite.location
    using(locid)
    where iprange
    >>=
    '74.125.195.147';

    View Slide

  27. Constraint Exclusion
    create table geolite.blocks
    (
    iprange ip4r,
    locid integer,
    exclude using gist (iprange with &&)
    );

    View Slide

  28. Geolocation & earthdistance
    with geoloc as
    (
    select location as l
    from location
    join blocks using(locid)
    where iprange
    >>=
    '212.58.251.195'
    )
    select name,
    pos <@> l miles
    from pubnames, geoloc
    order by pos <-> l
    limit 10;
    name │ miles
    ═════════════════════╪═══════════════════
    The Windmill │ 0.238820308117723
    County Hall Arms │ 0.343235607674773
    St Stephen's Tavern │ 0.355548630092567
    The Red Lion │ 0.417746499125936
    Zeitgeist │ 0.395340599421532
    The Rose │ 0.462805636194762
    The Black Dog │ 0.536202634581979
    All Bar One │ 0.489581827372222
    Slug and Lettuce │ 0.49081531378207
    Westminster Arms │ 0.42400619117691
    (10 rows)

    View Slide

  29. NBA Games Statistics
    “An interesting factoid: the team that recorded the
    fewest defensive rebounds in a win was the
    1995-96 Toronto Raptors, who beat the
    Milwaukee Bucks 93-87 on 12/26/1995 despite
    recording only 14 defensive rebounds.”

    View Slide

  30. with stats(game, team, drb, min) as (
    select ts.game, ts.team, drb, min(drb) over ()
    from team_stats ts
    join winners w on w.id = ts.game
    and w.winner = ts.team
    )
    select game.date::date,
    host.name || ' -- ' || host_score as host,
    guest.name || ' -- ' || guest_score as guest,
    stats.drb as winner_drb
    from stats
    join game on game.id = stats.game
    join team host on host.id = game.host
    join team guest on guest.id = game.guest
    where drb = min;
    NBA Games Statistics

    View Slide

  31. -[ RECORD 1 ]----------------------------
    date | 1995-12-26
    host | Toronto Raptors -- 93
    guest | Milwaukee Bucks -- 87
    winner_drb | 14
    -[ RECORD 2 ]----------------------------
    date | 1996-02-02
    host | Golden State Warriors -- 114
    guest | Toronto Raptors -- 111
    winner_drb | 14
    -[ RECORD 3 ]----------------------------
    date | 1998-03-31
    host | Vancouver Grizzlies -- 101
    guest | Dallas Mavericks -- 104
    winner_drb | 14
    -[ RECORD 4 ]----------------------------
    date | 2009-01-14
    host | New York Knicks -- 128
    guest | Washington Wizards -- 122
    winner_drb | 14
    Time: 126.276 ms
    NBA Games Statistics

    View Slide

  32. Pure SQL Histograms
    with drb_stats as (
    select min(drb) as min,
    max(drb) as max
    from team_stats
    ),
    histogram as (
    select width_bucket(drb, min, max, 9) as bucket,
    int4range(min(drb), max(drb), '[]') as range,
    count(*) as freq
    from team_stats, drb_stats
    group by bucket
    order by bucket
    )
    select bucket, range, freq,
    repeat('■',
    ( freq::float
    / max(freq) over()
    * 30
    )::int
    ) as bar
    from histogram;

    View Slide

  33. Pure SQL Histograms
    bucket | range | freq | bar
    --------+---------+-------+--------------------------------
    1 | [10,15) | 52 |
    2 | [15,20) | 1363 | ■■
    3 | [20,25) | 8832 | ■■■■■■■■■■■■■
    4 | [25,30) | 20917 | ■■■■■■■■■■■■■■■■■■■■■■■■■■■■■■
    5 | [30,35) | 20681 | ■■■■■■■■■■■■■■■■■■■■■■■■■■■■■■
    6 | [35,40) | 9166 | ■■■■■■■■■■■■■
    7 | [40,45) | 2093 | ■■■
    8 | [45,50) | 247 |
    9 | [50,54) | 20 |
    10 | [54,55) | 1 |
    (10 rows)

    View Slide

  34. Mastering PostgreSQL in
    Application Development

    View Slide

  35. Mastering
    PostgreSQL
    In Application
    Development
    https://masteringpostgresql.com

    View Slide

  36. Mastering
    PostgreSQL
    In Application
    Development
    -15%
    “pgdayparis”
    https://masteringpostgresql.com

    View Slide

  37. Ask Me Two Questions!
    Dimitri Fontaine
    Citus Data
    @tapoueh
    P O S T G R E S Q L E S P A Ñ A , M A D R I D | N O V E M B E R 2 8 , 2 0 1 8

    View Slide

  38. View Slide