A brief overview of the many features of browser developer tools, with an emphasis on Chrome's web inspector. Learn about how to browse the source code, make on-the-fly edits, and discover optimization strategies right from the browser!
available in every current browser (yes, even IE!) that allows you to navigate through the components that go into rendering the web page you see. It also has a bunch of nifty features to help achieve better performance, find bugs, check mobile views, and more!
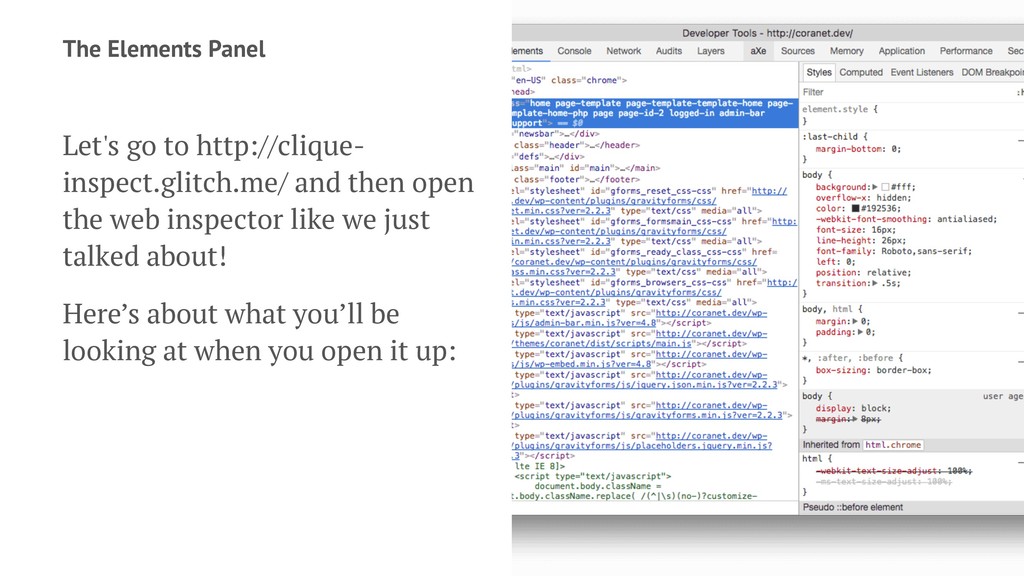
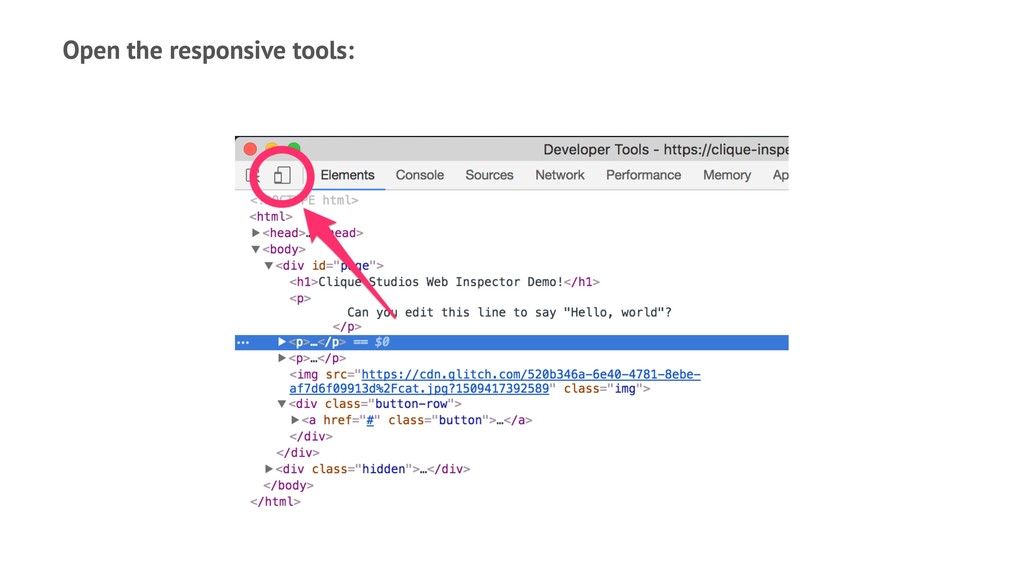
+ Opt + I — Safari: Cmd + Opt + I — Firefox: Cmd + Opt + C — Internet Explorer/Edge: F12 Alternately, you can almost always open it via right- clicking and selecting “Inspect Element” from the context menu.
page and select "inspect element" to get to that element directly in the "Elements" panel — Double click on text or an an attribute to edit its contents — Right click on a section and select "Edit as HTML"
list of style rules that apply to the selected element — Click on properties to edit them — The "+" at the top allows you to create new style rules — ":hov" allows you to force hover/active/focus states — ".cls" allows you to add new style classes easily on the fly to keep track of a set of related properties
also view non-HTML files, such as javascript, raw CSS code, images included in page — Can set "breakpoints" in script files that tell it to pause at a certain point — Lists all files requested as part of loading the page Can you find the hidden cat photo in the sources list?
— Can also print messages from scripts being run to output debug info — You can also type javascript directly into the console Try the command the console message suggests to you and see what happens!
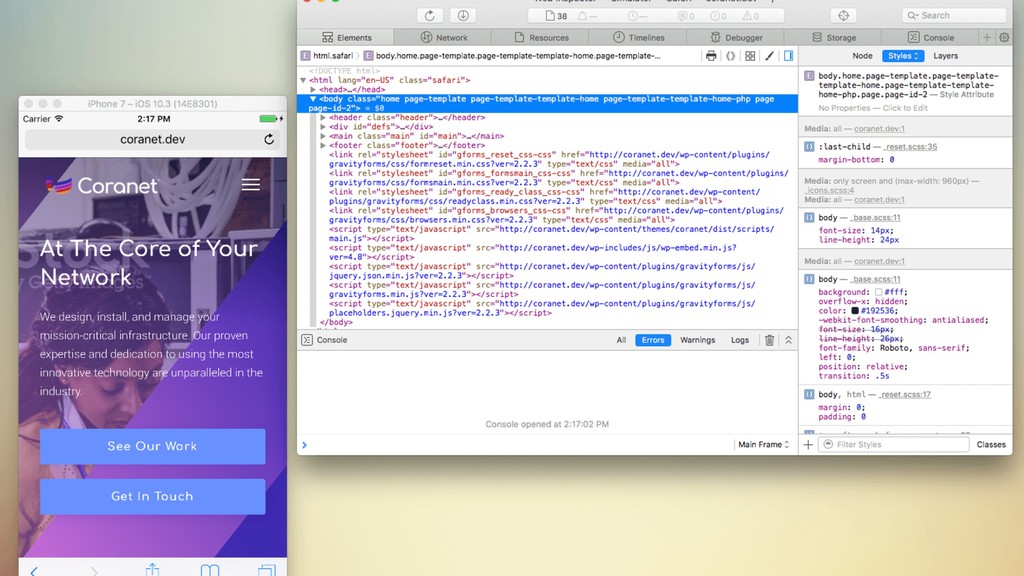
unique tools Safari is an Apple product, which means that it gets some special tools for working with iOS! When an iPhone/iPod Touch/iPad is connected via Bluetooth or USB to your computer, you can use the web inspector to look at the content of the browser on your phone.
device testing, which are under the "Emulation" tab. Internet Explorer/Edge can imitate other previous versions of IE, as well as emulate Windows phones.
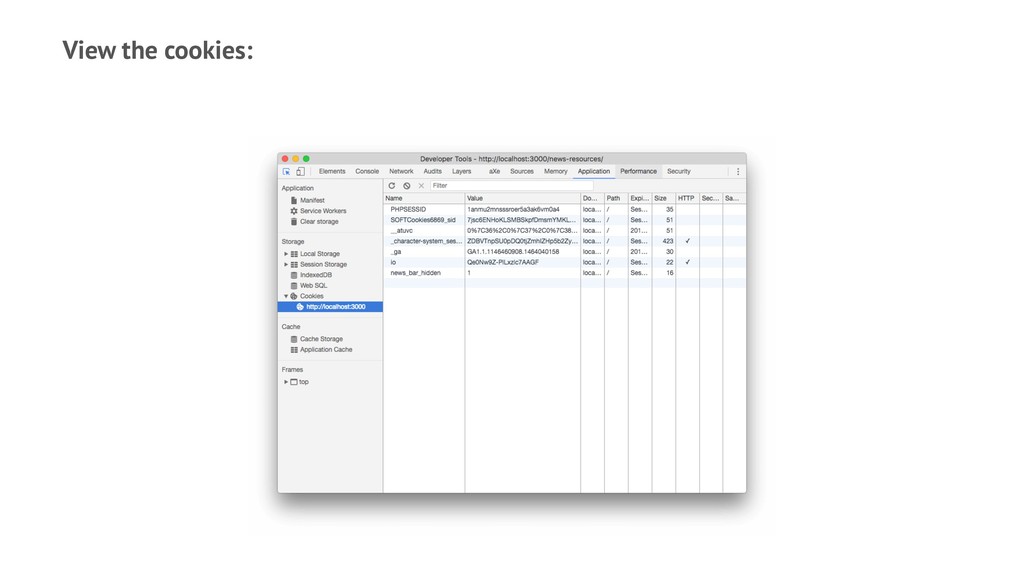
deal with cookies. Cookies are the way that sites temporarily store data about you and your choices in the browser. If you're in Safari or Firefox, you'll find this under the "Storage" tab.
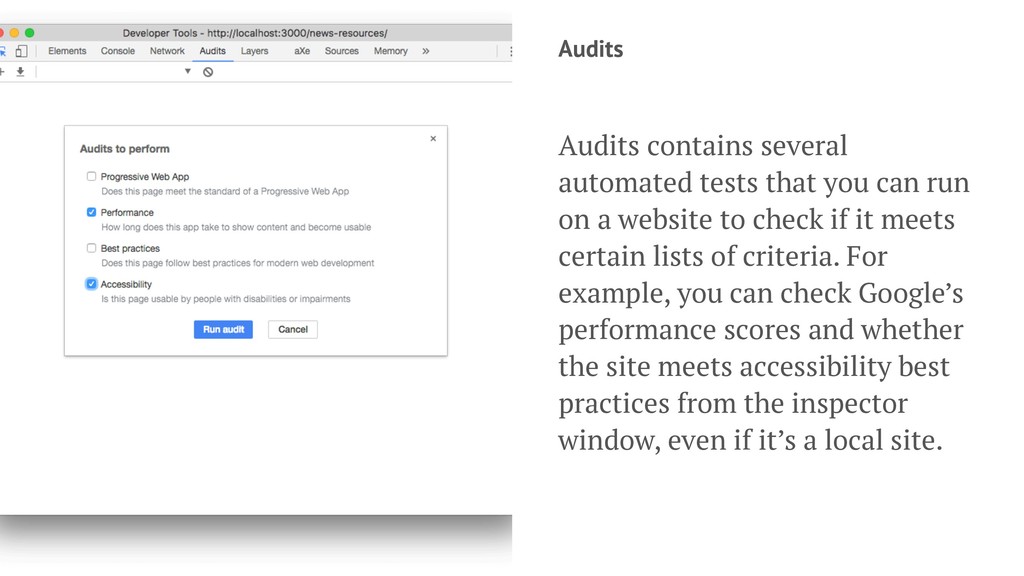
on a website to check if it meets certain lists of criteria. For example, you can check Google’s performance scores and whether the site meets accessibility best practices from the inspector window, even if it’s a local site.
the same website—it’s not doing too bad, but there’s some items we could tidy up. Has limitations (you still need a human audit!) but good to point out obvious problems
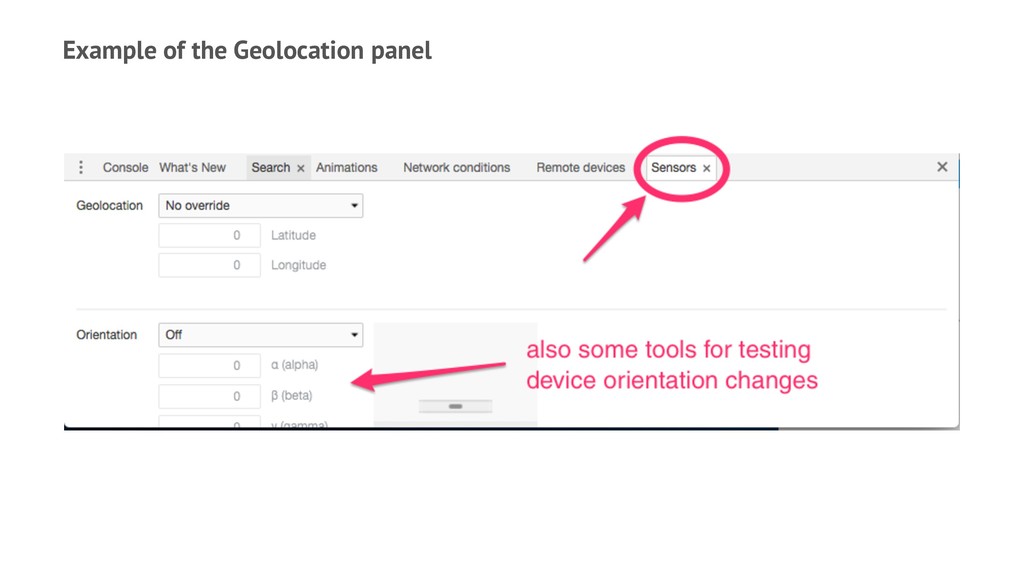
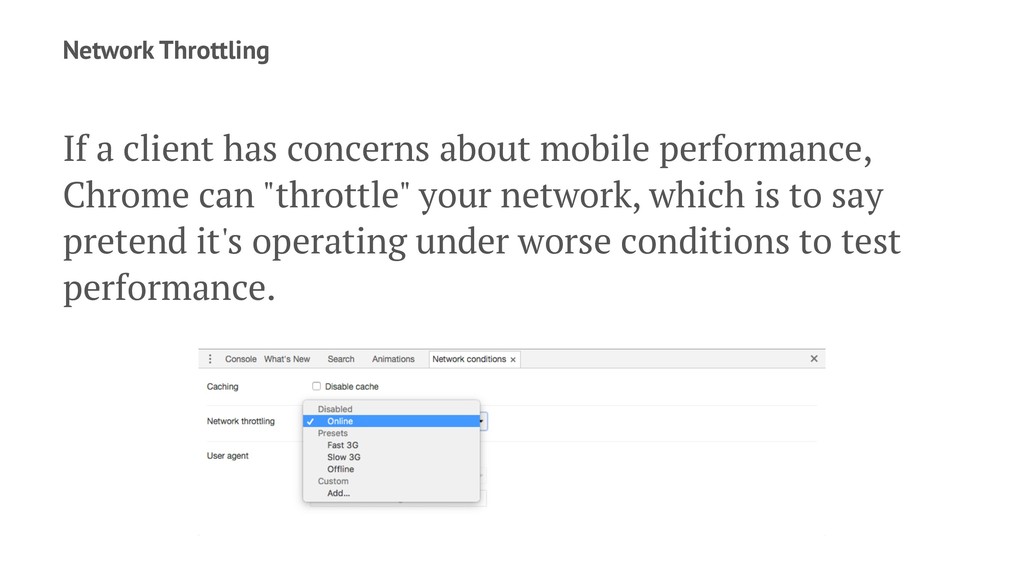
to test how your site would look with different geolocation data, but you can spoof it with the tools in Chrome. Interesting note: Safari and Firefox don't have this feature, but IE does (under the bottom tab, "Emulation")
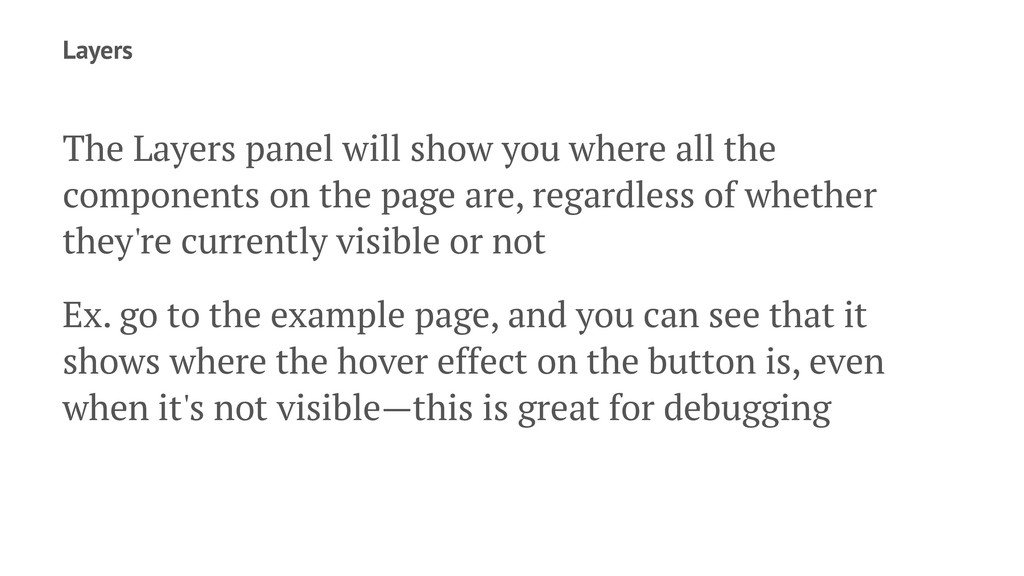
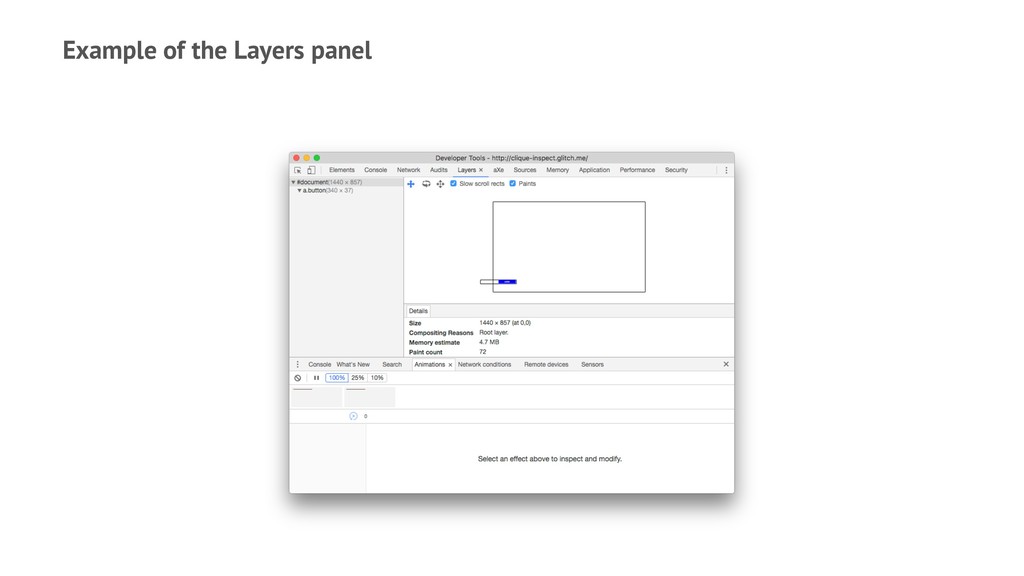
components on the page are, regardless of whether they're currently visible or not Ex. go to the example page, and you can see that it shows where the hover effect on the button is, even when it's not visible—this is great for debugging
in Chrome — Firefox just rolled Firebug into its native suite of tools, pointing to more ahead — Try the Safari Technology Preview for cutting-edge Safari tools