Upgrade to Pro — share decks privately, control downloads, hide ads and more …

CodeFest 2019. Леонид Кулигин (Google) — Основные ошибки при проведении экспериментов

CodeFest
April 05, 2019

CodeFest 2019. Леонид Кулигин (Google) — Основные ошибки при проведении экспериментов

Про онлайн-эксперименты и А/Б-тесты не рассказывал только ленивый. Тем не менее, снова поговорим про то, как правильно организовать А/Б-тестирование, чтобы получать статистически значимые результаты.

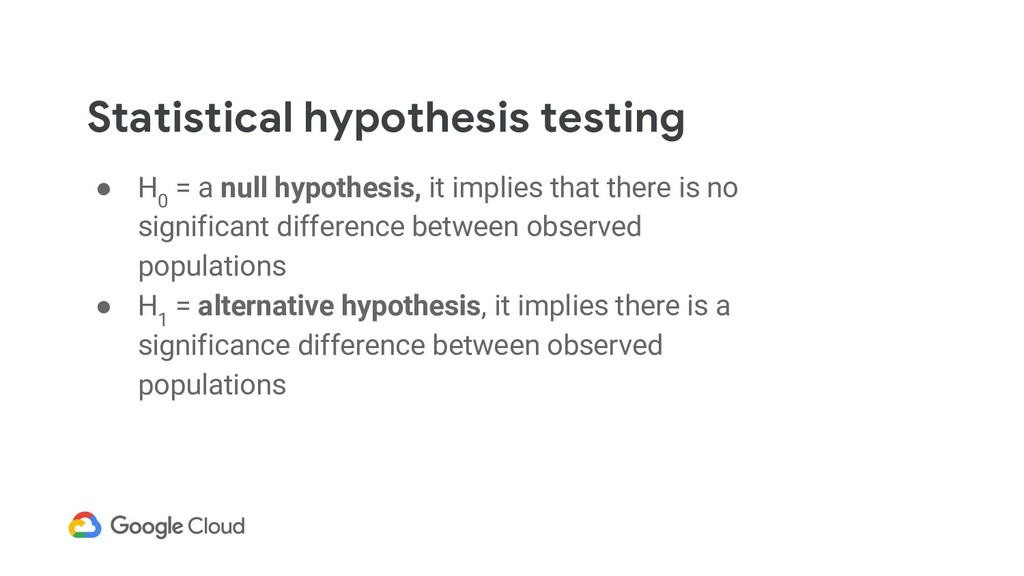
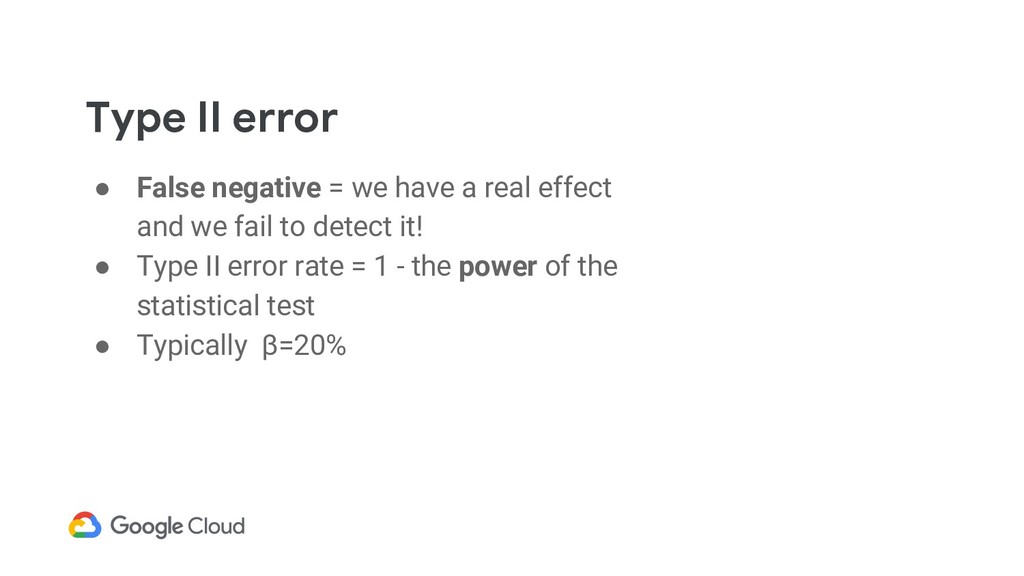
Коротко вспомним, что представляет собой процедура тестирования статистических гипотез. Вооружившись этими знаниями, мы разберем 7 основных ошибок при проведении А/Б-тестов. Посмотрим практические примеры того, к каким парадоксальным результатам может приводить плохо организованный процесс сбора данных и неверная интерпретация результатов.

CodeFest

April 05, 2019
Tweet

More Decks by CodeFest

Other Decks in Technology

Transcript

  1. Quarterly review ▬ Let’s discuss our achievements of our DS

    team. ▬ We’ve worked so hard and we have great results! ▬ I’m curious… ▬ We’ve trained a better classification model for our []. ▬ I’m so glad to hear that. Can you share any results please? ▬ We’ve improved AUC. It has increased from 0.789 to 0.791. ▬ Hm-m-m… OK, it’s great we are an AI company now.
  2. Quarterly review … ▬ We’ve improved AUC. It has increased

    from 0.789 to 0.791. ▬ Hm-m-m… OK, it’s great we are an AI company now. ▬ We’d like to buy a new GPU and visit a conference. Therefore we need a small budget for the next quarter. ▬ How much money did you guys cost us last quarter? ▬ And how profitable is your department in general?
  3. Is a business impact there? Error@5 Speed (ms) ResNet18 10.76%

    31.5 ResNet34 8.74% 51.6 ResNet50 7.02% 103.6 ResNet101 6.21% 156.4 ResNet152 6.16% 217.2 ResNet200 5.79% 296.5 Source github: fb.resnet.tourch
  4. Main challenges • Changes are typically pretty small • We

    often optimize for internal offline metrics
  5. Online experiments • We need good metrics and validated procedures

    for online evaluation: ◦ Robust = it shows nothing when there is no change ◦ Sensitive = it reports a difference when there is an actual change
  6. ... in order to get those [better] results, we need

    to have optimized approaches, appropriate metrics and rapid experimentation. Netflix Recommendations: Beyond 5 stars
  7. Leonid Kuligin • Moscow Institute of Physics & Technique •

    2017 - … Google Cloud, PSO, ML engineer • 2016-2017 Scout GmbH, Senior Software Engineer • 2015-2016 HH.RU, Senior Product Manager (Search/ML) • 2013-2015 Yandex, Team Lead (Data production for Local search) https://www.linkedin.com/in/leonid-kuligin-53569544/
  8. Simple example We report the average price paid during the

    A/B test: 1€ vs. 2€ Which option wins?
  9. Simple example The average price paid during the A/B test:

    1€ vs. 2€. What about confidence intervals? • 20 users paid 1€ each, average = 20/20 = 1€ • 19 users paid 0 and 1 user paid 40€, average = 40/20 = 2€
  10. Tossing an unbiased coin Let’s simulate 10 tosses a lot

    of times • THTTHHTHTH - 5/10 • HTHTTHTTHT - 6/10 … • HHTHHTHTTH - 4/10
  11. Is there a real effect? We estimate a probability to

    observe an effect of such a size by random chance.
  12. Statistical hypothesis testing • H 0 = a null hypothesis,

    it implies that there is no significant difference between observed populations • H 1 = alternative hypothesis, it implies there is a significance difference between observed populations
  13. Type I error • False positive = we detect an

    effect that is not present! ◦ H 0 is true, but we’ve rejected during the test • Type I error rate = the significance level of the statistical test • Typically α=5%
  14. Type II error • False negative = we have a

    real effect and we fail to detect it! • Type II error rate = 1 - the power of the statistical test • Typically β=20%
  15. Our setup • Randomly split the traffic to versions A

    (control) and B (treatment) • There are true stationary CR p A and p B for every group ◦ Ө=p A -p B ◦ H 0 : Ө=0 ◦ H 1 : Ө≠0 • Compute p-value: ◦ p v =P(data_at_least_as_extreme_as_we’ve_observed|H 0 ) ◦ We reject H 0 if p v ≤α
  16. Takeaways • Always remember about underlying assumptions when you use

    a test • State your hypothesis properly, a statistical testing is always a process of modelling a real world and eliminating the noise • Keep in mind implicit Type I/II errors’ when making a decision
  17. Caveat I • Common statistical tests work pretty badly for

    web experiments ◦ An empirical variance is typically higher than expected • Both your metrics as well as the statistical test you’re going to use requires validation
  18. Caveat II • Assume that we run a lot of

    tests and: ◦ Only 1 out of 10 tests has a significant business impact, p 0 =0.1 ◦ Our test has α=0.05 and 1-β=80% • We can apply the Bayes’ theorem
  19. There is ... an actual difference … no actual difference

    H 0 not rejected βp 0 (1-α)(1-p 0 ) H 0 rejected (i.e, effect detected!) (1-β)p 0 α(1-p 0 ) α - probability of Type I error (we reject when it’s true) β - probability of Type II error (we don’t reject when we should)
  20. Bayes’ theorem applied • p act =0.1, α=0.05 and 1-β=80%

    • α=0.05, β=0.8 (most commonly used settings) • p=0.64 - probability that there is an actual difference given that a statistically significant difference has been detected
  21. Caveat III • Make a clear bet before an experiment

    ◦ Or add adjustment for multiple testing to your test (e.g., Holm-Bonferroni method) • Don’t pick any metric that has changed • If we have 10 different metrics: ◦ The probability* to observe at least 1 false positive is 1-(1-α)10=0.40 instead of 0.05
  22. Caveat IV • Don’t tolerate early-stopping ◦ Imagine we like

    the change we’ve made ◦ So we check results every day for last 3 months until we occasionally see the difference… ◦ With infinite horizons Type I errors are guaranteed • The probability is higher to end up with detecting a fake change
  23. Caveat V • Remember about users’ segments ◦ Results might

    go in different directions for segments ◦ Simpson’s paradox: a trend appears in a different groups of data but disappears when these groups are combined • Again, make your bets in advance Source: Aibnb technoblog
  24. Takeaways • Remember about implicit Type I and Type II

    errors rates • You make “data-driven” decision based on statistical procedures - get familiar with the basics! • Invest your team’s efforts in metrics’ development and validation • Setup (and follow!) clear policies how to run experiments • Test your models in online experiments
  25. Further reading • Sangho Yoon Designing A/B tests in a

    collaboration network - 2018 • P. Dmitriev et. al A dirty dozen: 12 Common Metric Interpretation Pitfalls in Online Controlled Experiments - 2017 • H. Hohnhold Focusing on the Long-term: It’s good for Users and Business - 2015 • R. Johari et. al Always Valid Inference: Bringing Sequential Analysis to A/B testing - 2015 • R. Kohavi et.al Seven Rules of Thumb for Web Site Experiments - 2014 • D. Reiley et. al Here, There, and Everywhere: Correlated Online Behaviors Can Lead to Overestimates of the Effects of Advertising - 2011 • Diane Tang, Ashish Agarwal, et. all - Overlapping Experiment Infrastructure: More, Better, Faster Experimentation - 2010