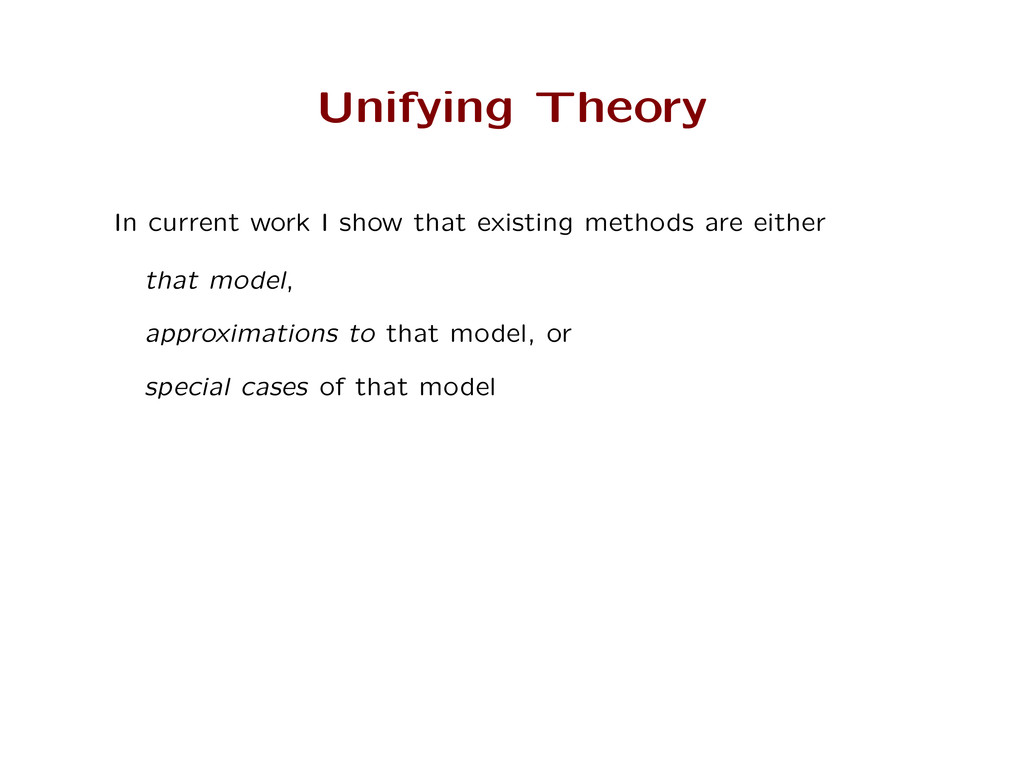
The role of a methodologist is to clarify the substantive assumptions and technical limitations of research methods prevent social scientists worrying about di erences and choices that will not matter
The role of a methodologist is to clarify the substantive assumptions and technical limitations of research methods prevent social scientists worrying about di erences and choices that will not matter o er general solutions to general problems
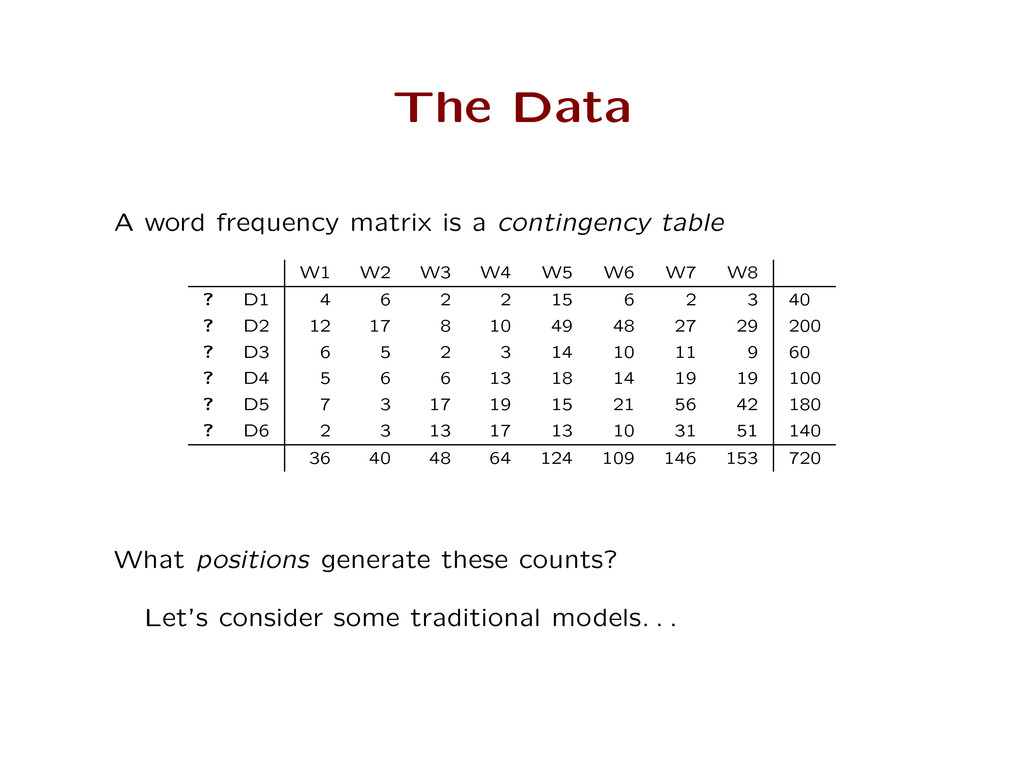
points’ for political actors, from: Judgements from experts, or voters Legislative votes Raw and pre-coded texts, e.g. manifestos, media, speeches Let me start by telling you something about scaling text . . .
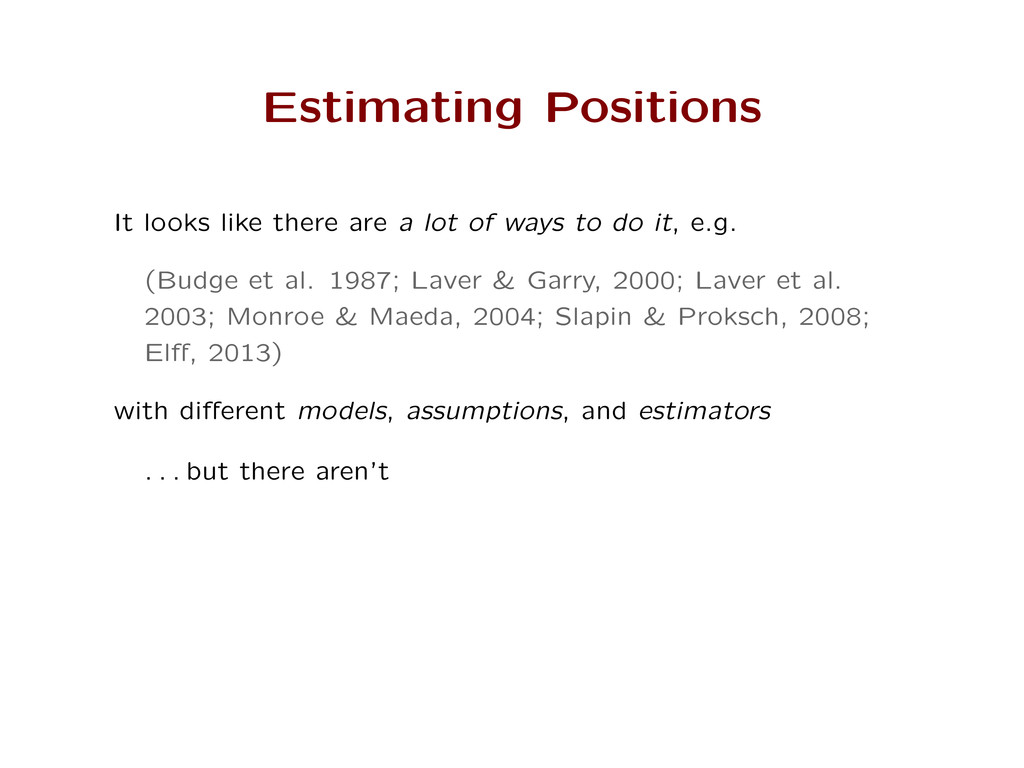
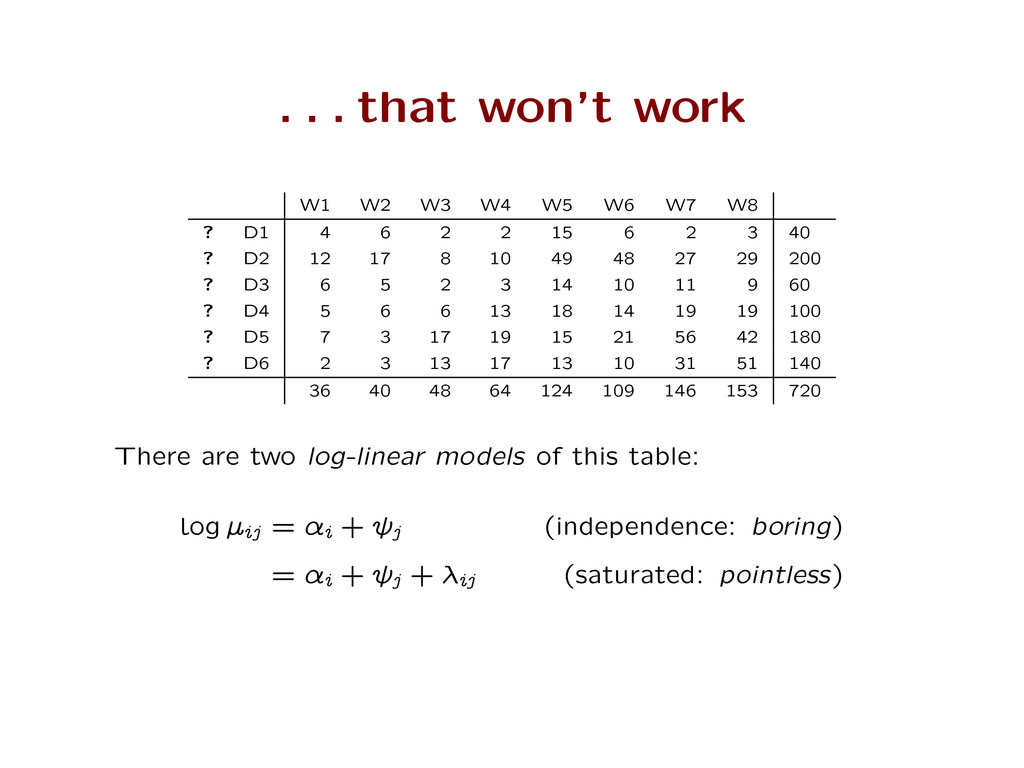
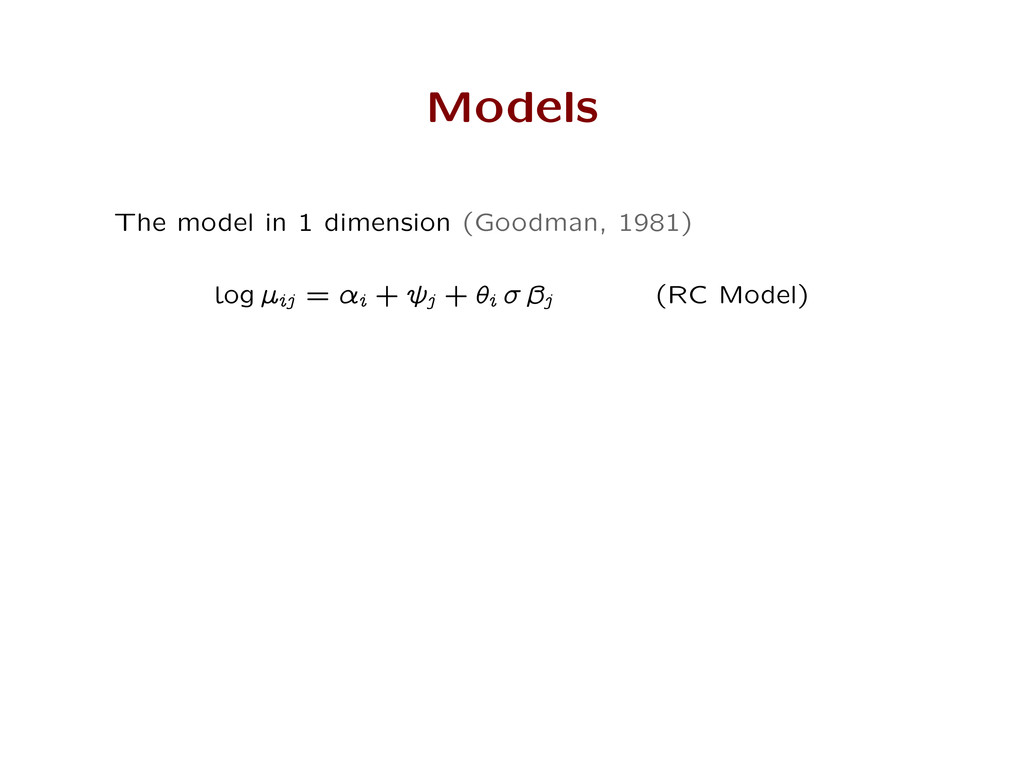
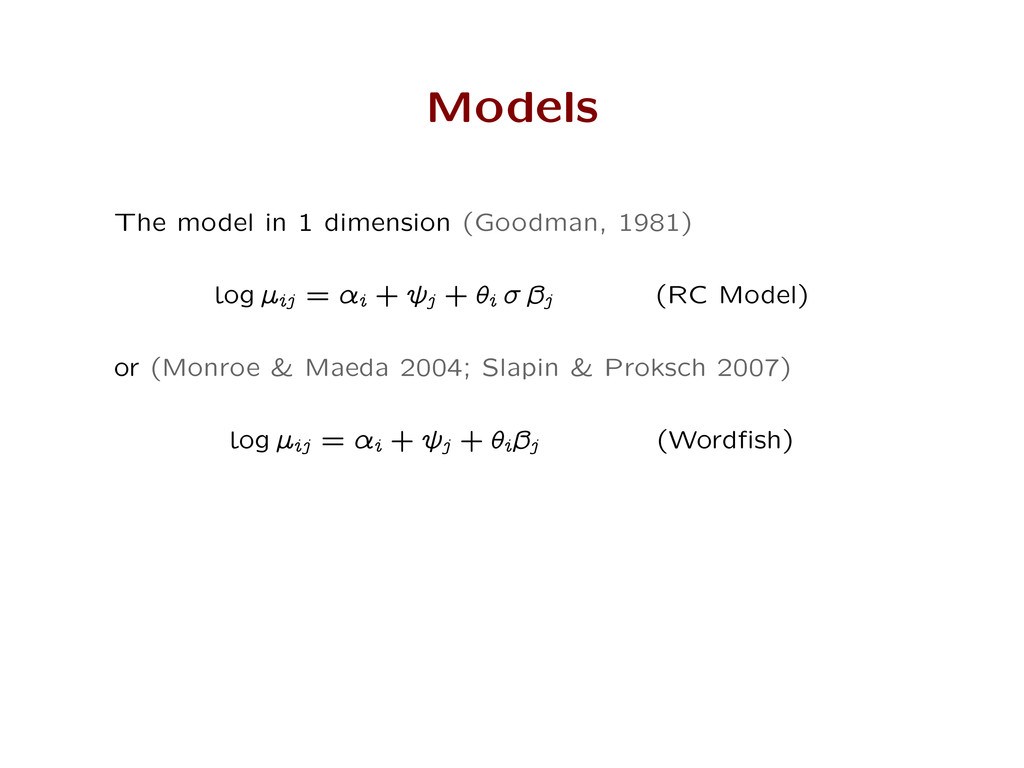
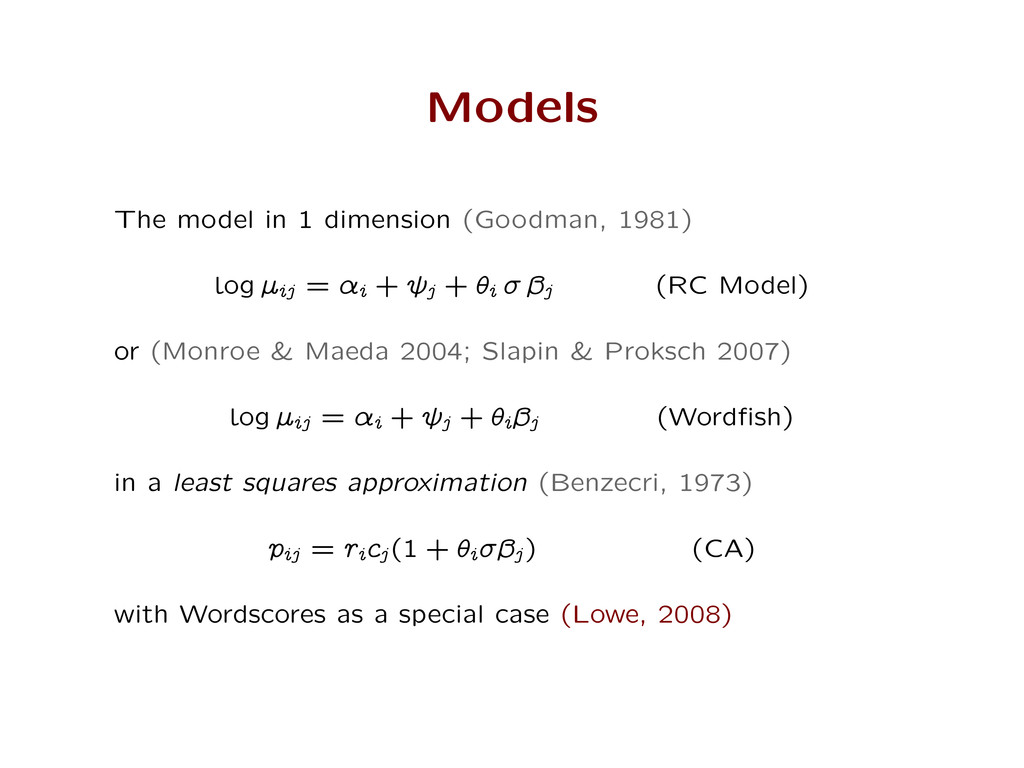
ways to do it , e.g. (Budge et al. 1987; Laver & Garry, 2000; Laver et al. 2003; Monroe & Maeda, 2004; Slapin & Proksch, 2008; El , 2013) with di erent models , assumptions , and estimators
ways to do it , e.g. (Budge et al. 1987; Laver & Garry, 2000; Laver et al. 2003; Monroe & Maeda, 2004; Slapin & Proksch, 2008; El , 2013) with di erent models , assumptions , and estimators . . . but there aren’t
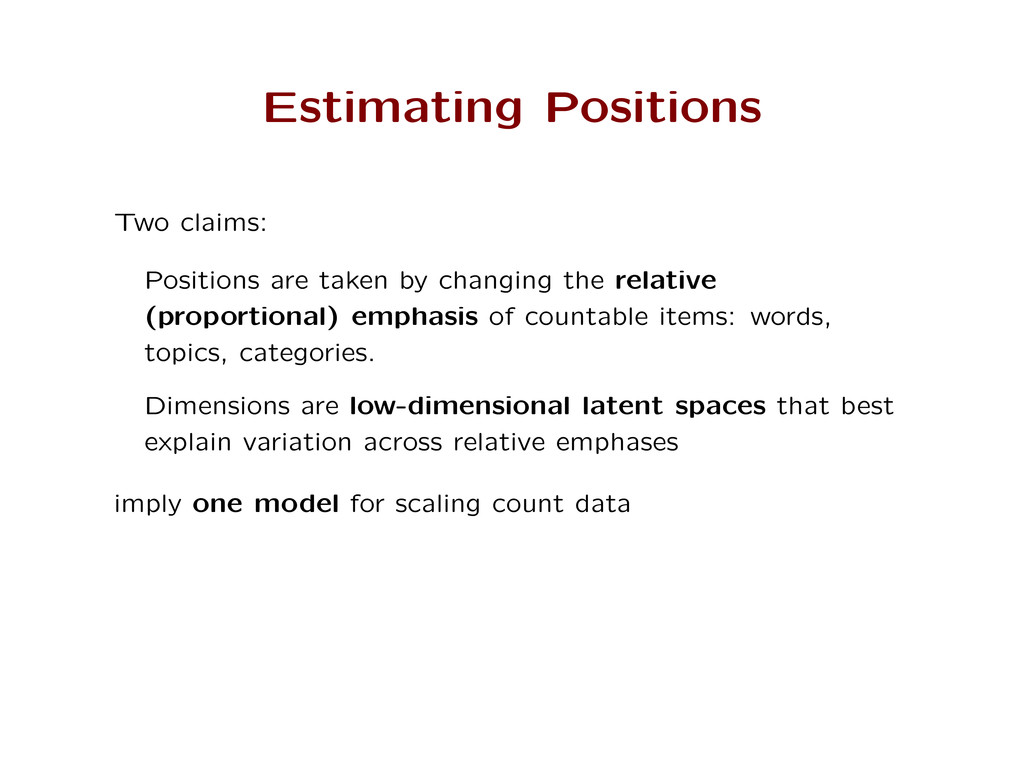
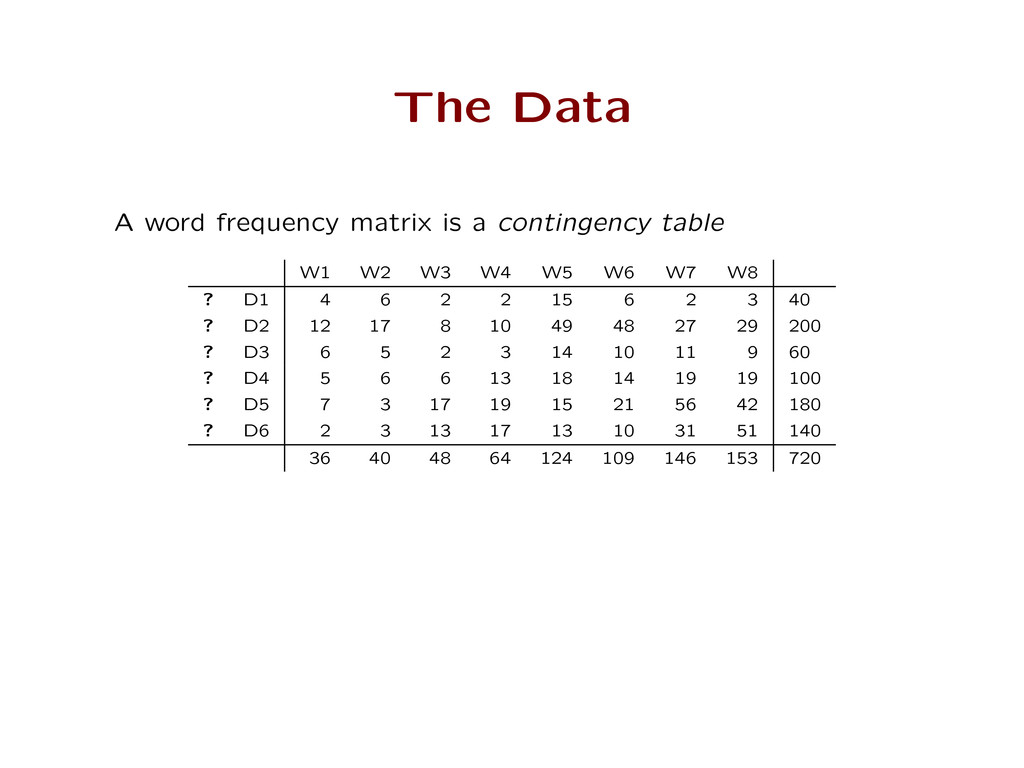
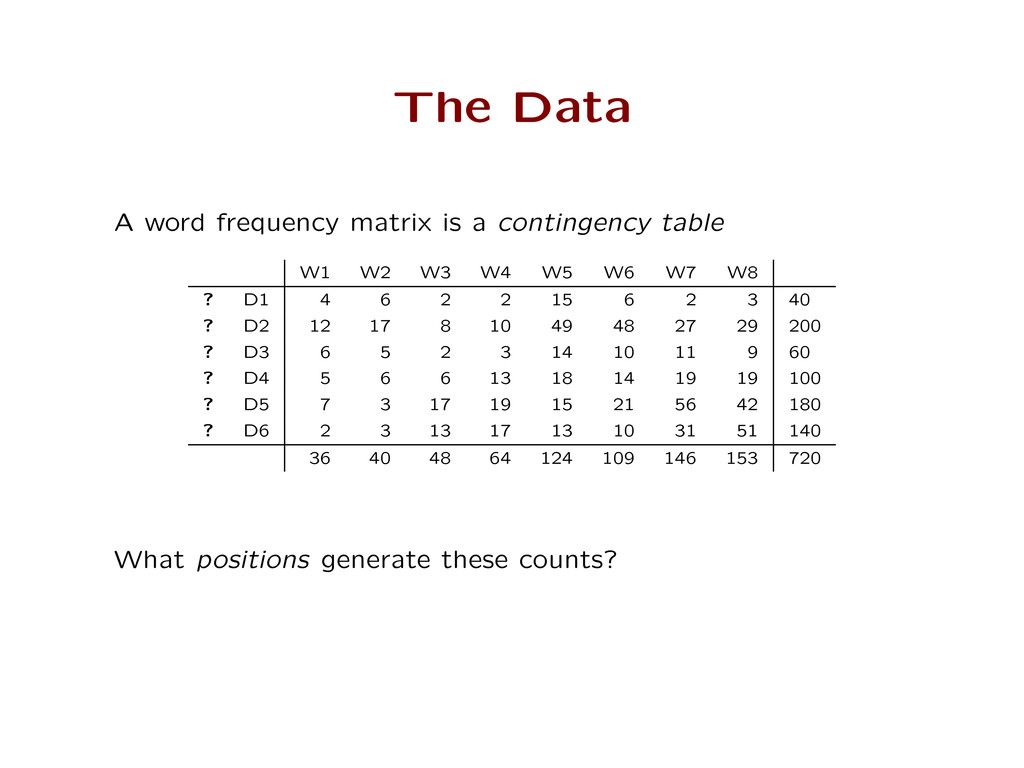
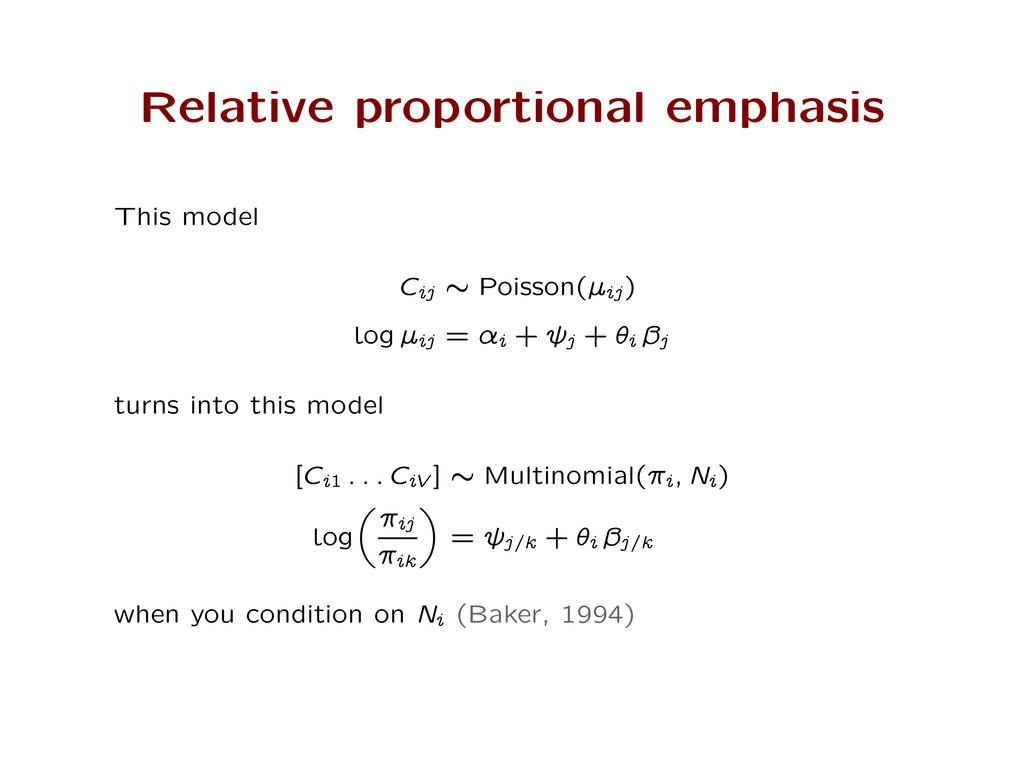
relative (proportional) emphasis of countable items: words, topics, categories. Dimensions are low-dimensional latent spaces that best explain variation across relative emphases
relative (proportional) emphasis of countable items: words, topics, categories. Dimensions are low-dimensional latent spaces that best explain variation across relative emphases imply one model for scaling count data
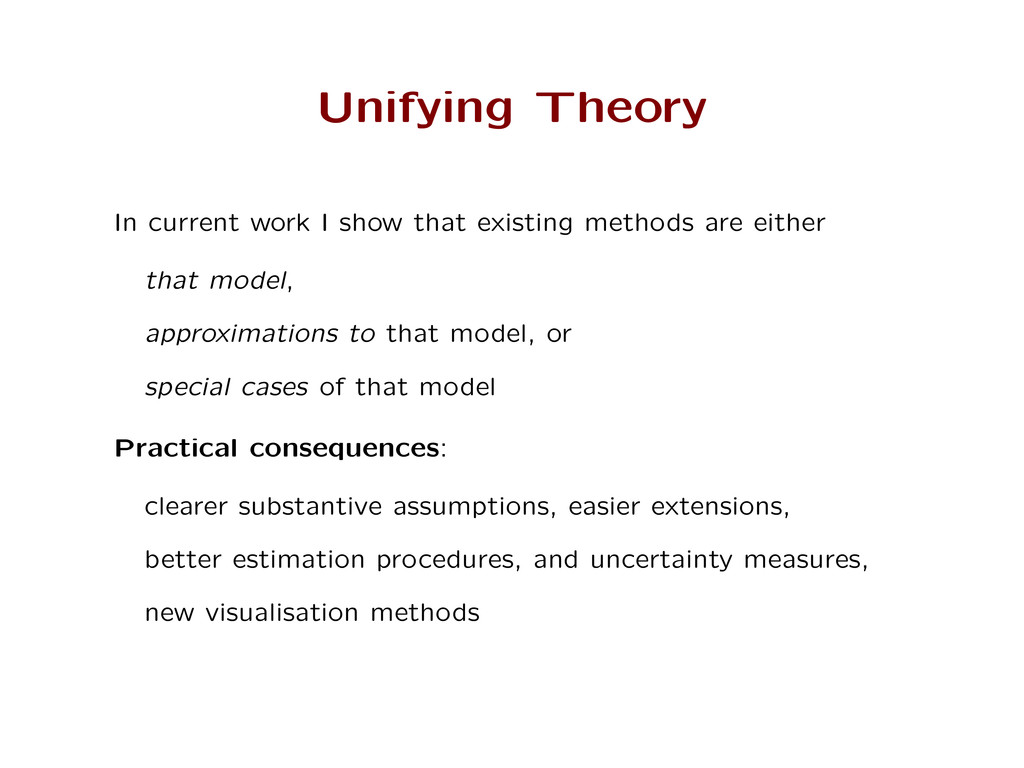
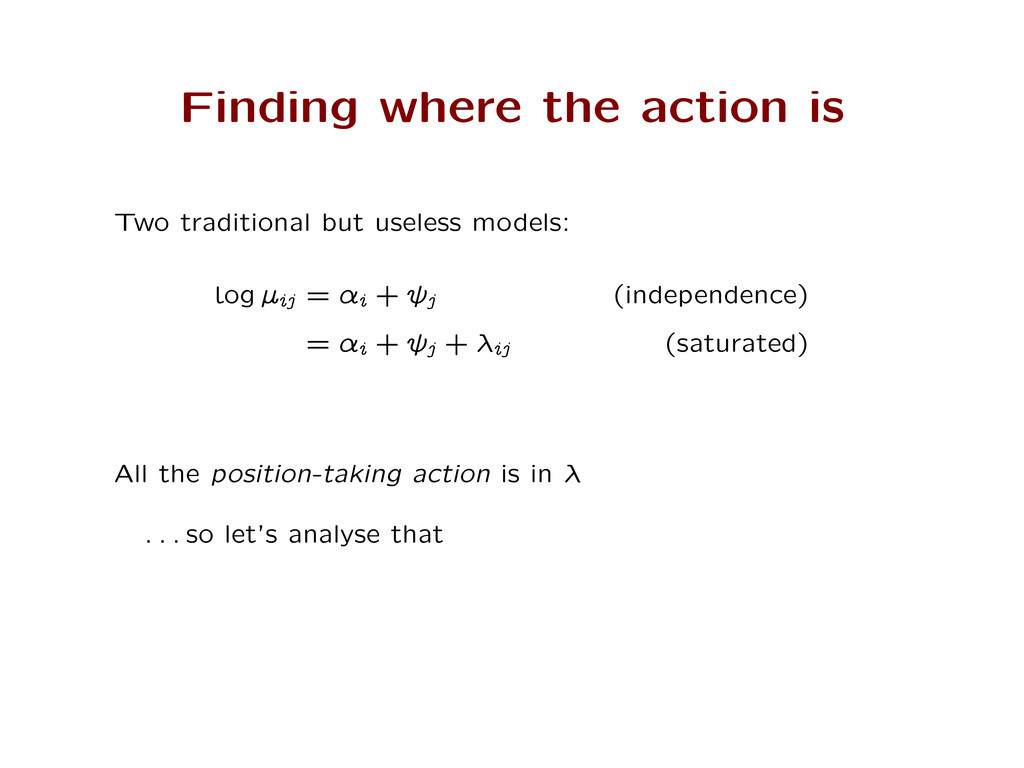
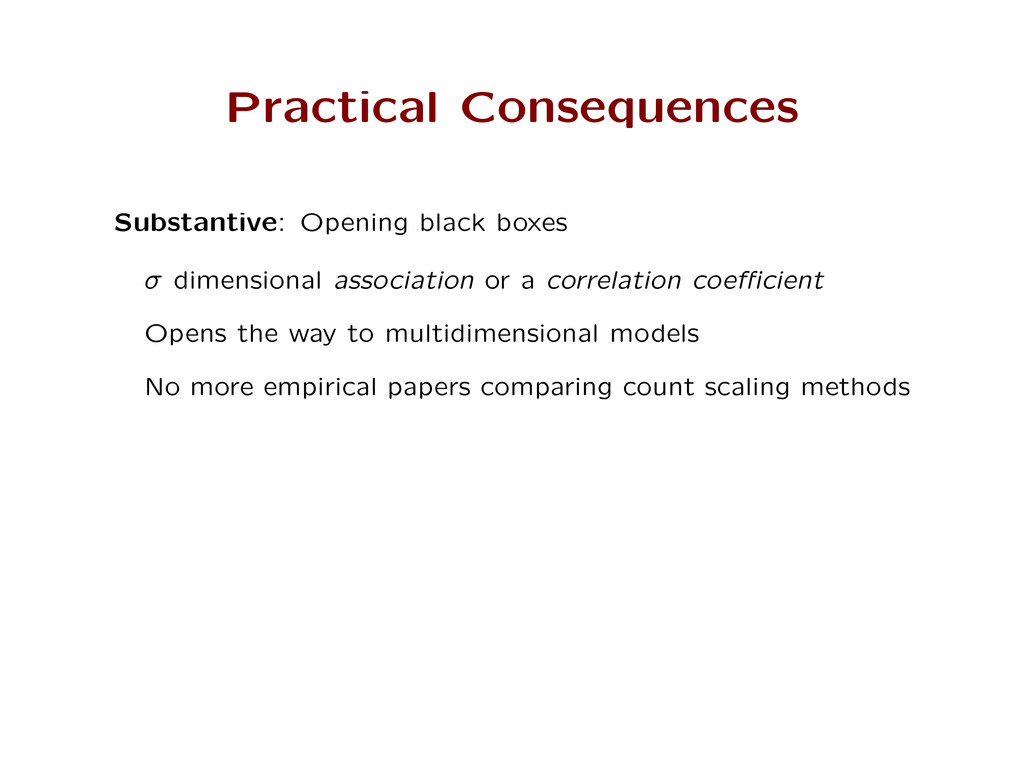
are either that model , approximations to that model, or special cases of that model Practical consequences: clearer substantive assumptions, easier extensions, better estimation procedures, and uncertainty measures, new visualisation methods
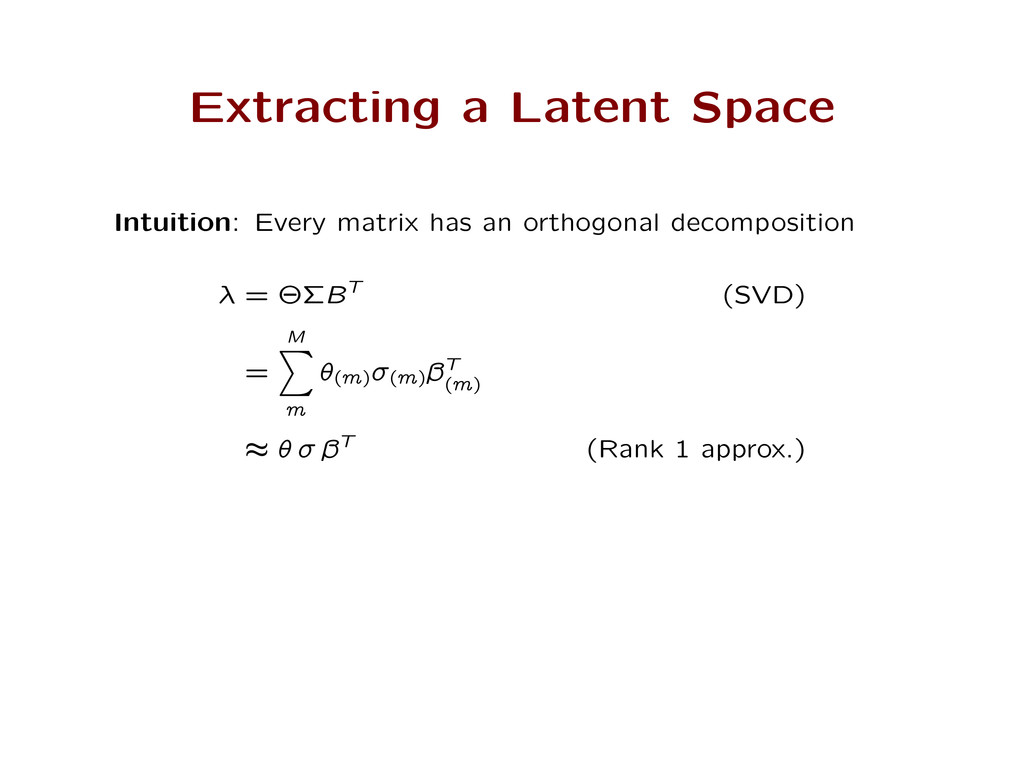
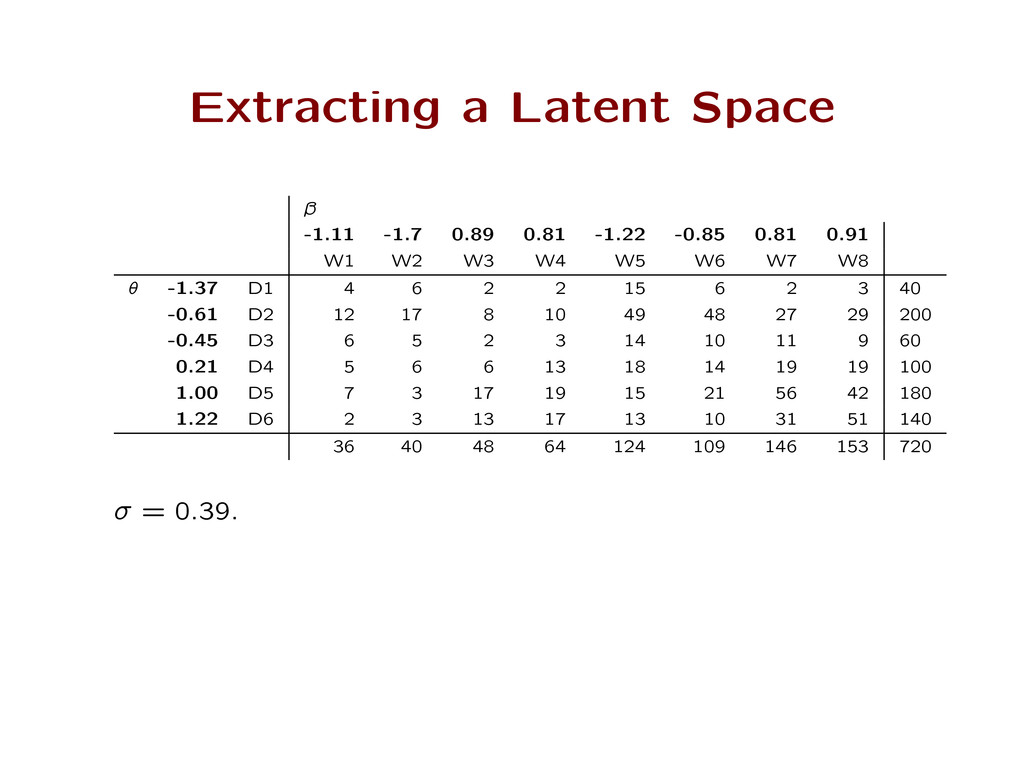
decomposition – = ˆ˚ BT (SVD) = M X m „ ( m ) ( m ) ˛T ( m ) ı „ ˛T (Rank 1 approx.) „ are document positions , ˛ are word positions says how much positioning action is in this dimension
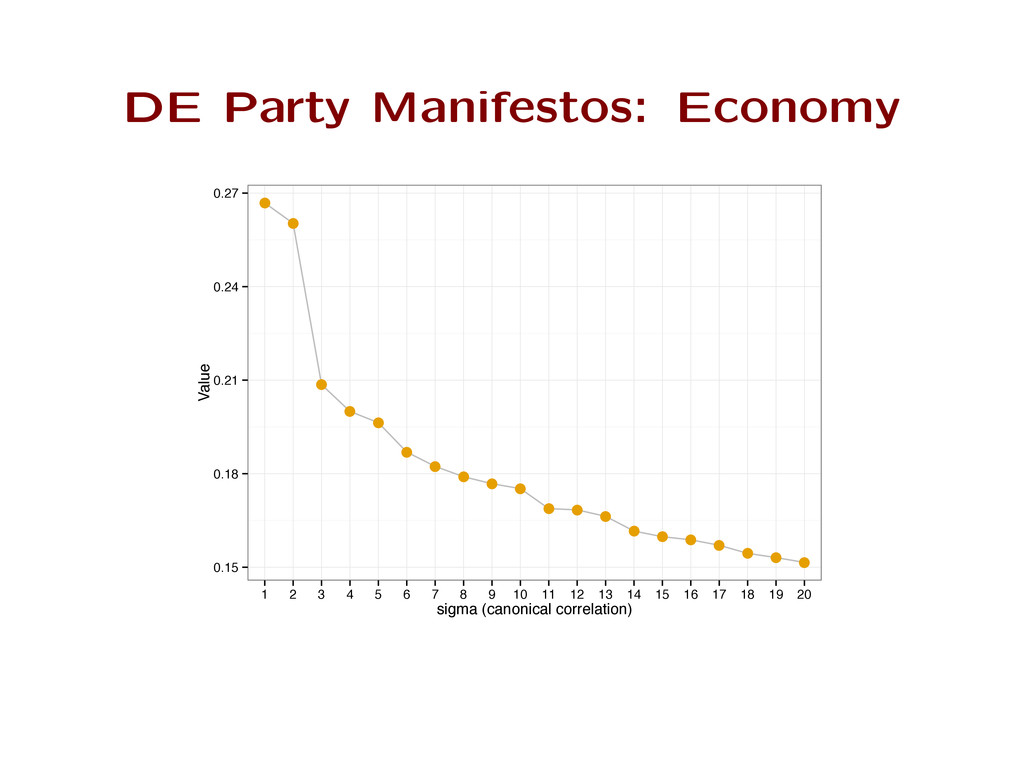
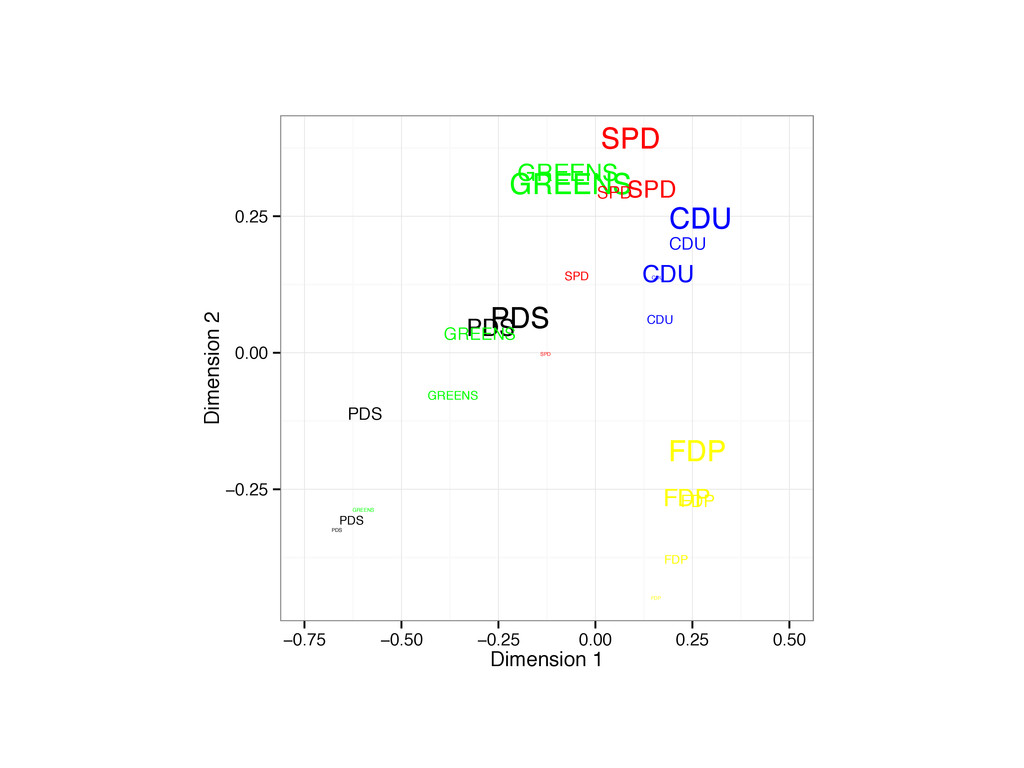
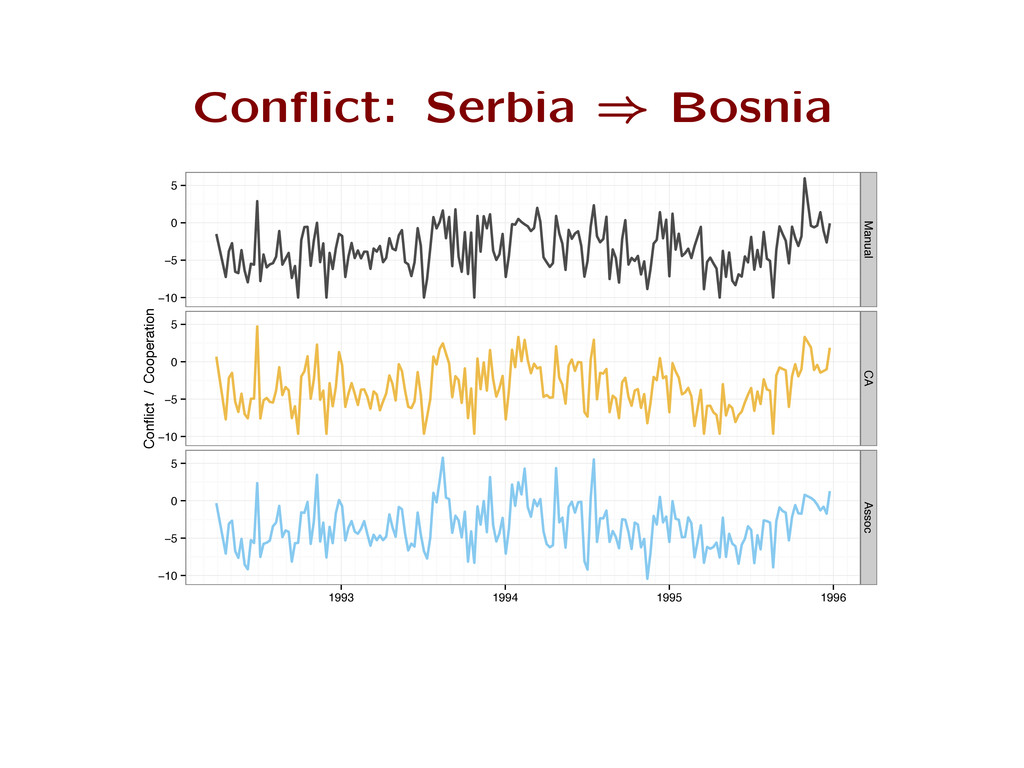
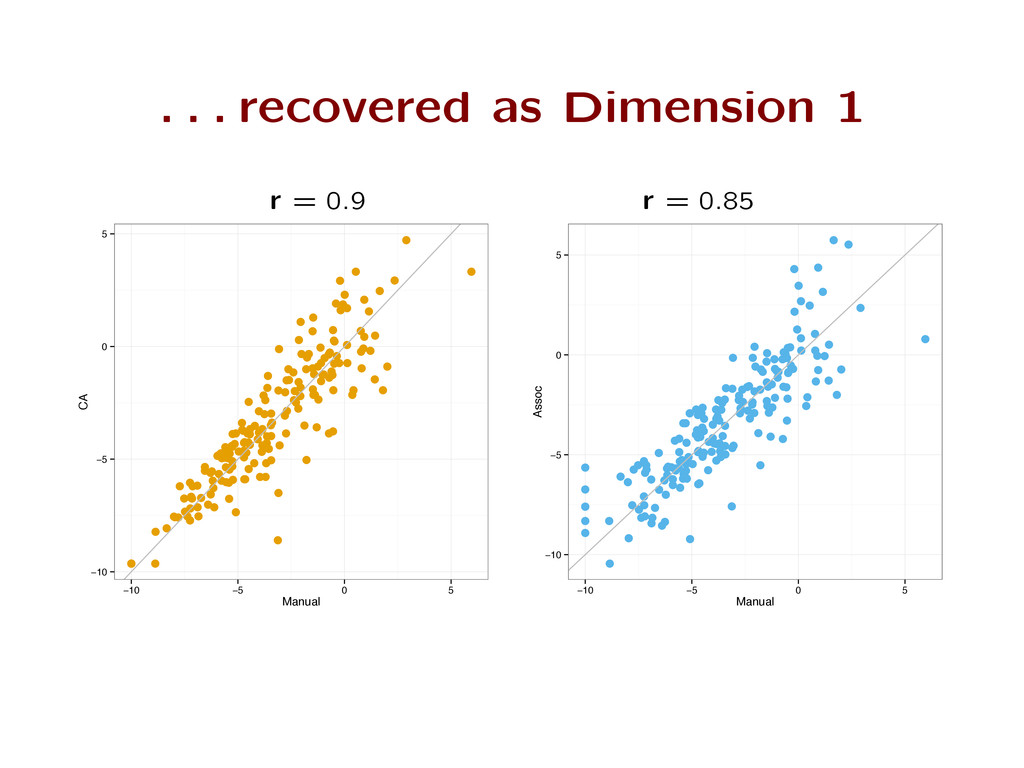
correlation coe cient Opens the way to multidimensional models No more empirical papers comparing count scaling methods Statistical: RC model estimates Germany party positions in ı 30 mins, CA in ı 1 second Statistical theory now available for both (e.g. Becker, Gilula, Lowe and Benoit, 2012)
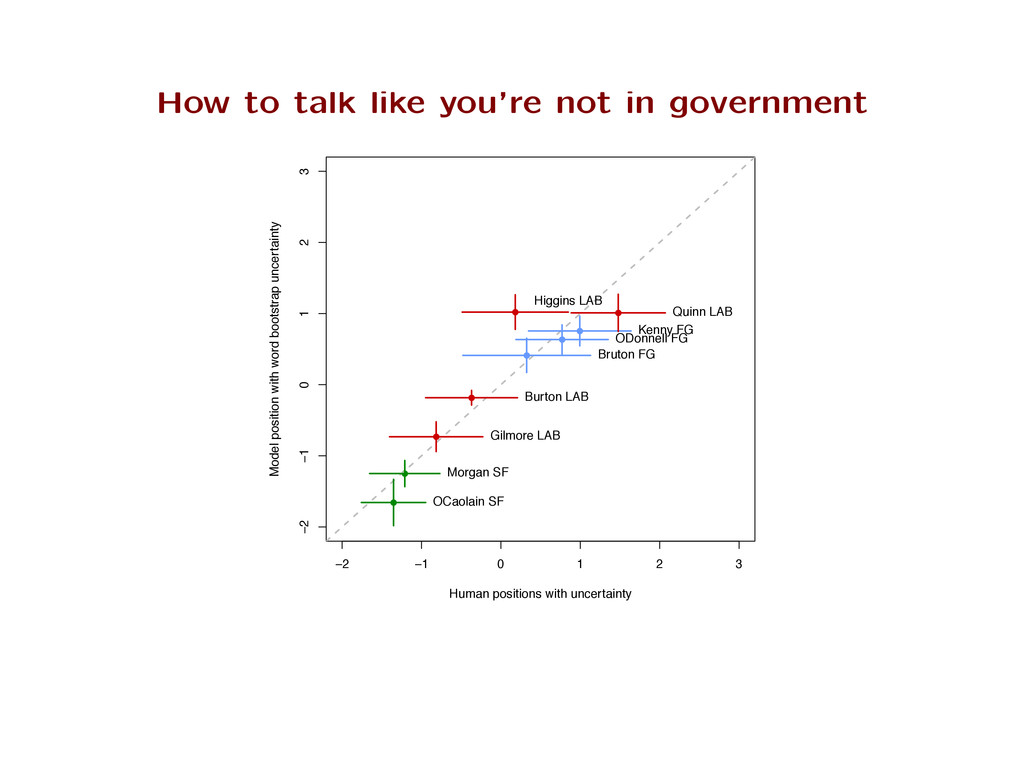
categorised sentences (Lowe et al. 2011, Benoit et al. 2012) legislative speeches (Lowe & Benoit 2011, 2012, forthcoming) The match is good, but not perfect : Multiple dimensions, drifting language and topics Extra -dimensional structure, e.g. gov. and opposition These are the topics of current work
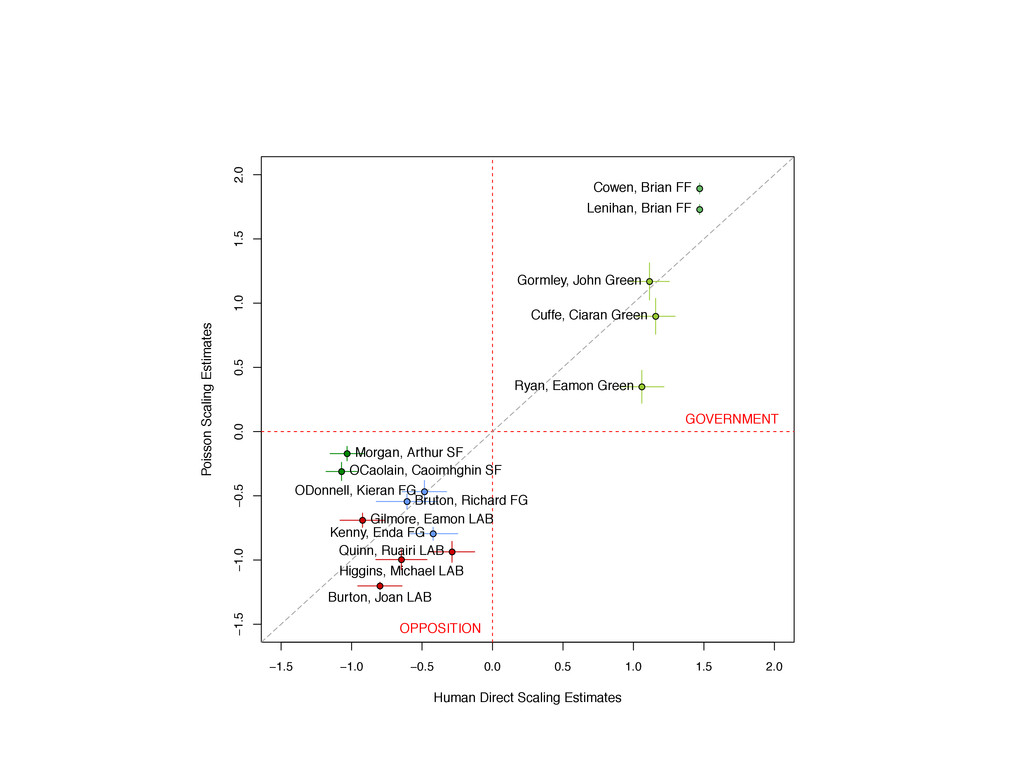
−0.5 0.0 0.5 1.0 1.5 2.0 Human Direct Scaling Estimates Poisson Scaling Estimates Lenihan, Brian FF Cowen, Brian FF Gilmore, Eamon LAB Kenny, Enda FG Bruton, Richard FG Quinn, Ruairi LAB Higgins, Michael LAB Burton, Joan LAB ODonnell, Kieran FG Morgan, Arthur SF OCaolain, Caoimhghin SF Gormley, John Green Cuffe, Ciaran Green Ryan, Eamon Green GOVERNMENT OPPOSITION • • • • • • • • • • • • • •
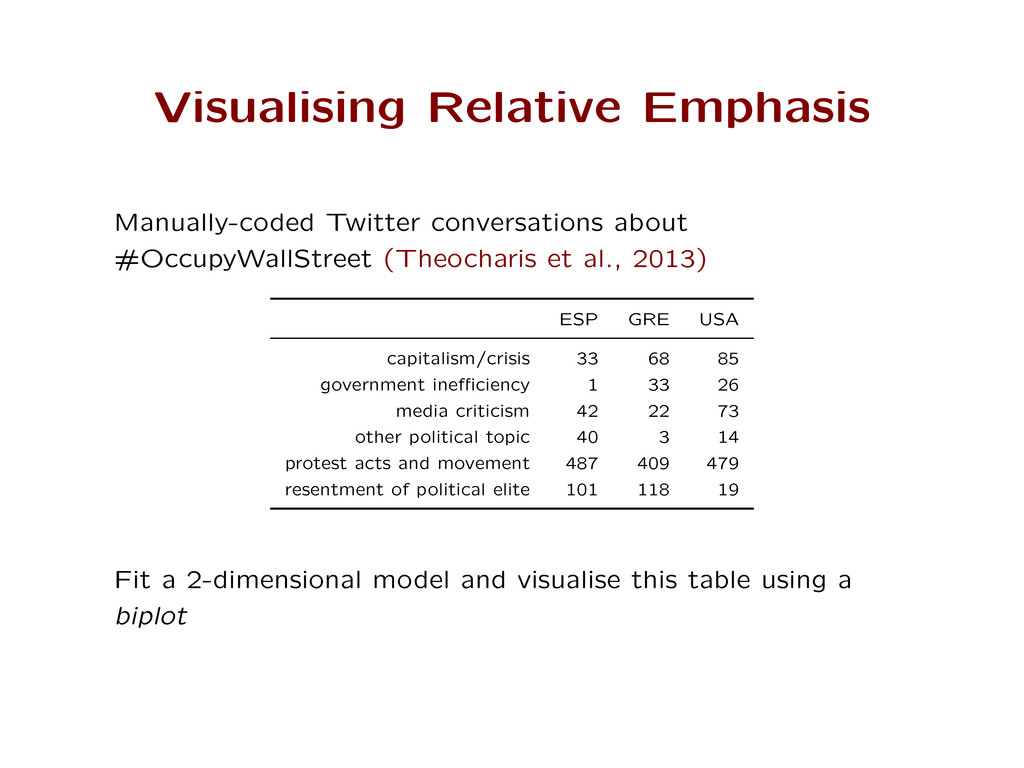
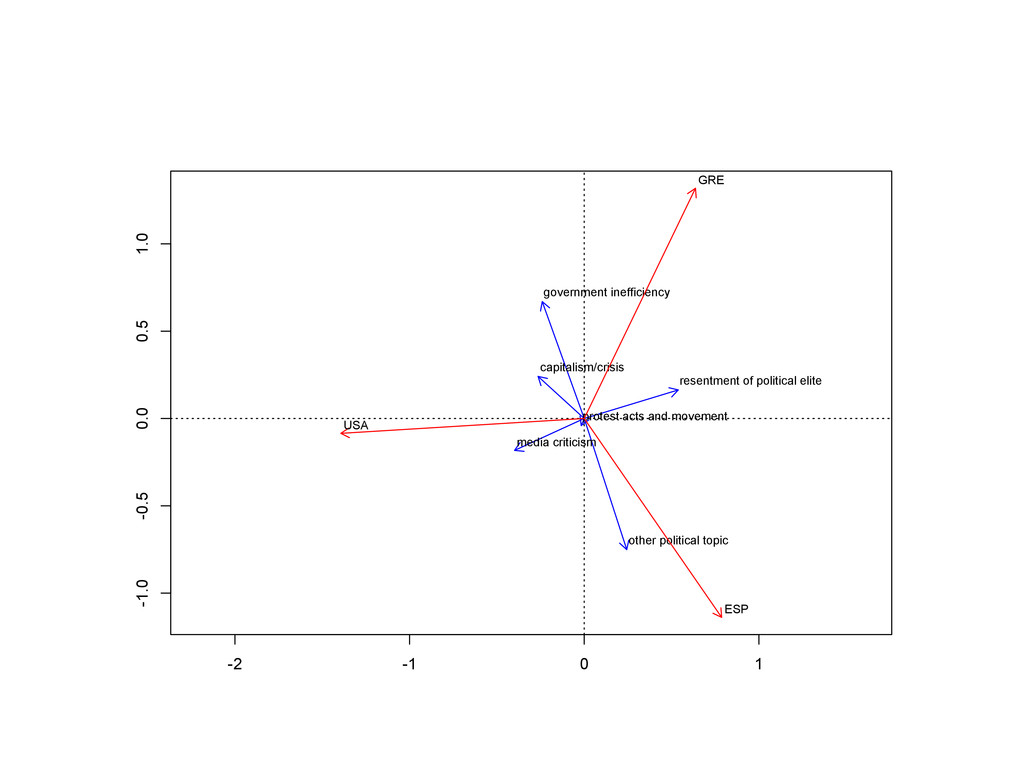
al., 2013) ESP GRE USA capitalism/crisis 33 68 85 government ine ciency 1 33 26 media criticism 42 22 73 other political topic 40 3 14 protest acts and movement 487 409 479 resentment of political elite 101 118 19 Fit a 2-dimensional model and visualise this table using a biplot
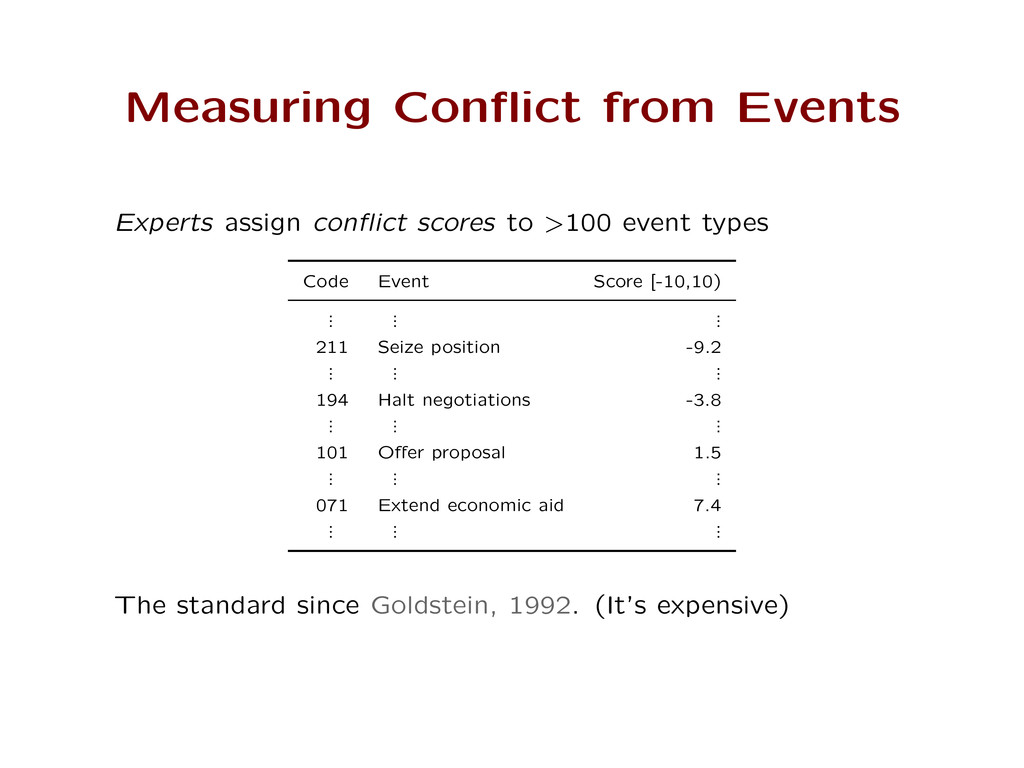
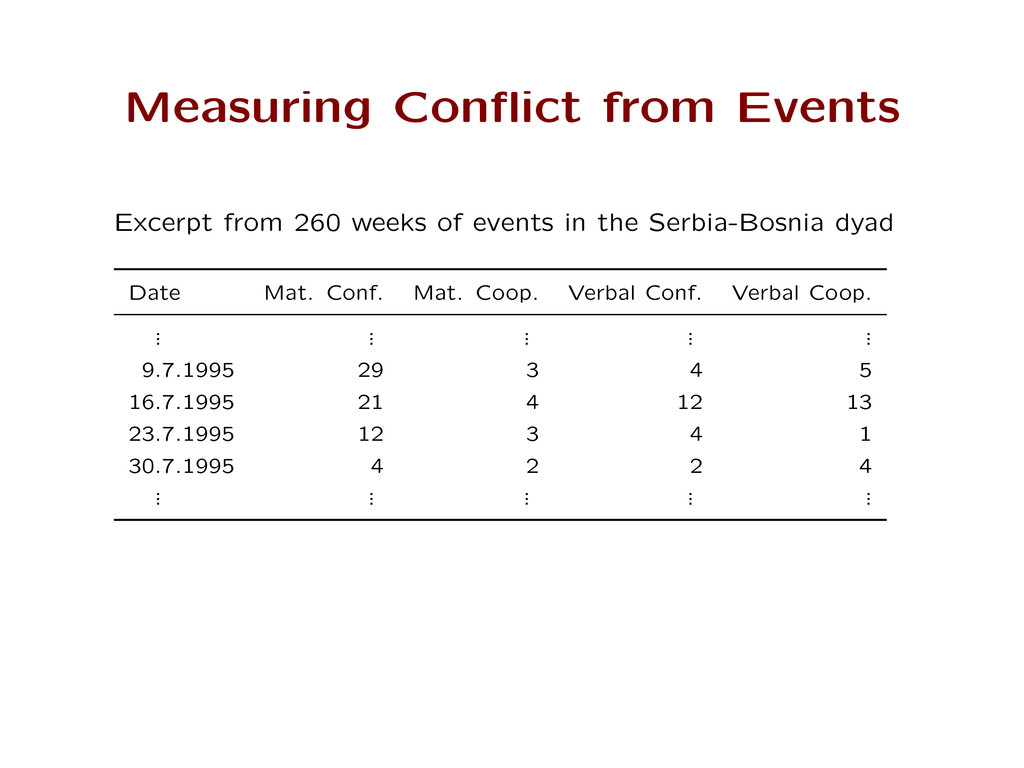
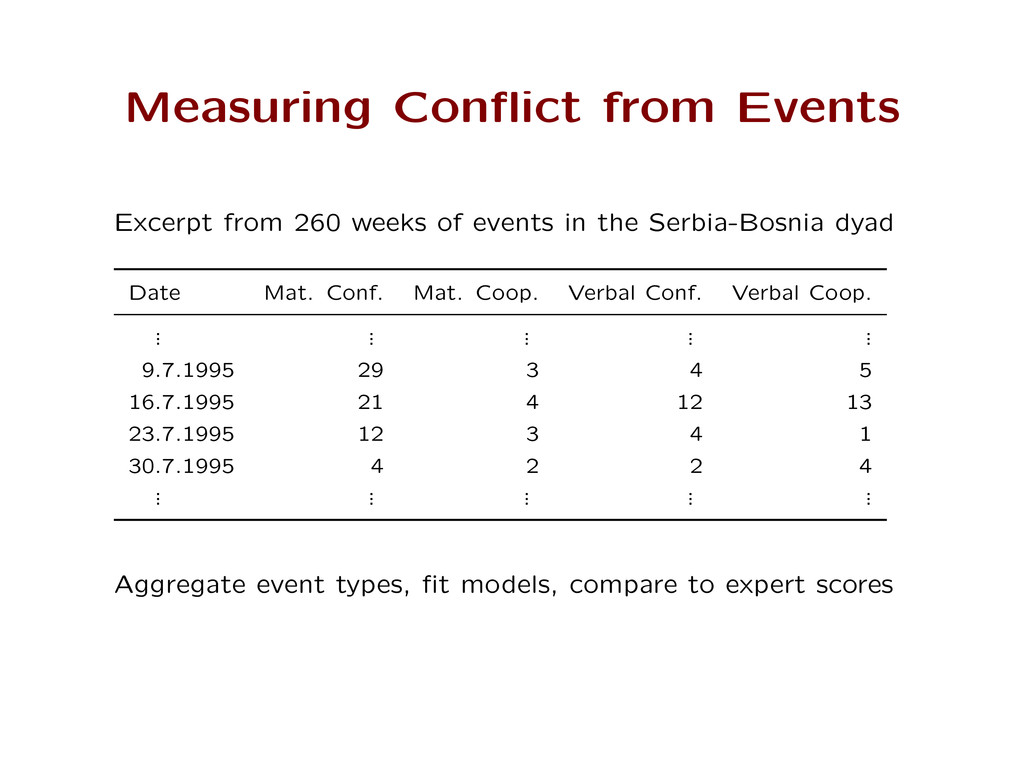
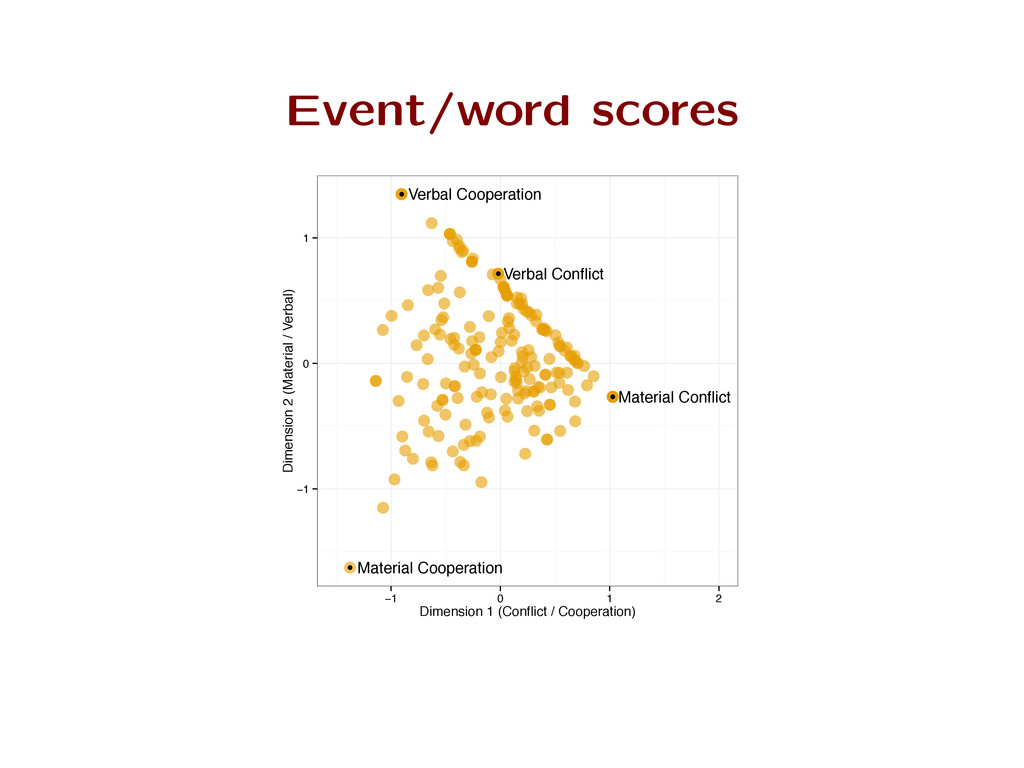
need data on international events , for understanding conflict dynamics and the consequences of intervention evaluating risk and forecasting measuring connectedness in the international system
need data on international events , for understanding conflict dynamics and the consequences of intervention evaluating risk and forecasting measuring connectedness in the international system Extracted from newswire by machine in the form of [Date, SOURCE, EVENT, TARGET]
estimation as a count data scaling problem ? „ is the unobserved conflict level in a dyad/week ˛ is the unobserved ‘conflictualness’ of each event type Marginal event counts depend on intensity of media coverage how easy it is to generate di erent events
estimation as a count data scaling problem ? „ is the unobserved conflict level in a dyad/week ˛ is the unobserved ‘conflictualness’ of each event type Marginal event counts depend on intensity of media coverage how easy it is to generate di erent events Unsuccessfully attempted with IRT models (Schrodt 2012)
analysis (Lowe & Stewart, MS) Conflict and dyad-specific event scaling Now that GDELT (200M events since 1979) is available . . . realtime event analysis with big data
measurement and strategic use of linguistic vagueness (C4) models for classical content analysis and coder error experimental investigation of relative emphasis