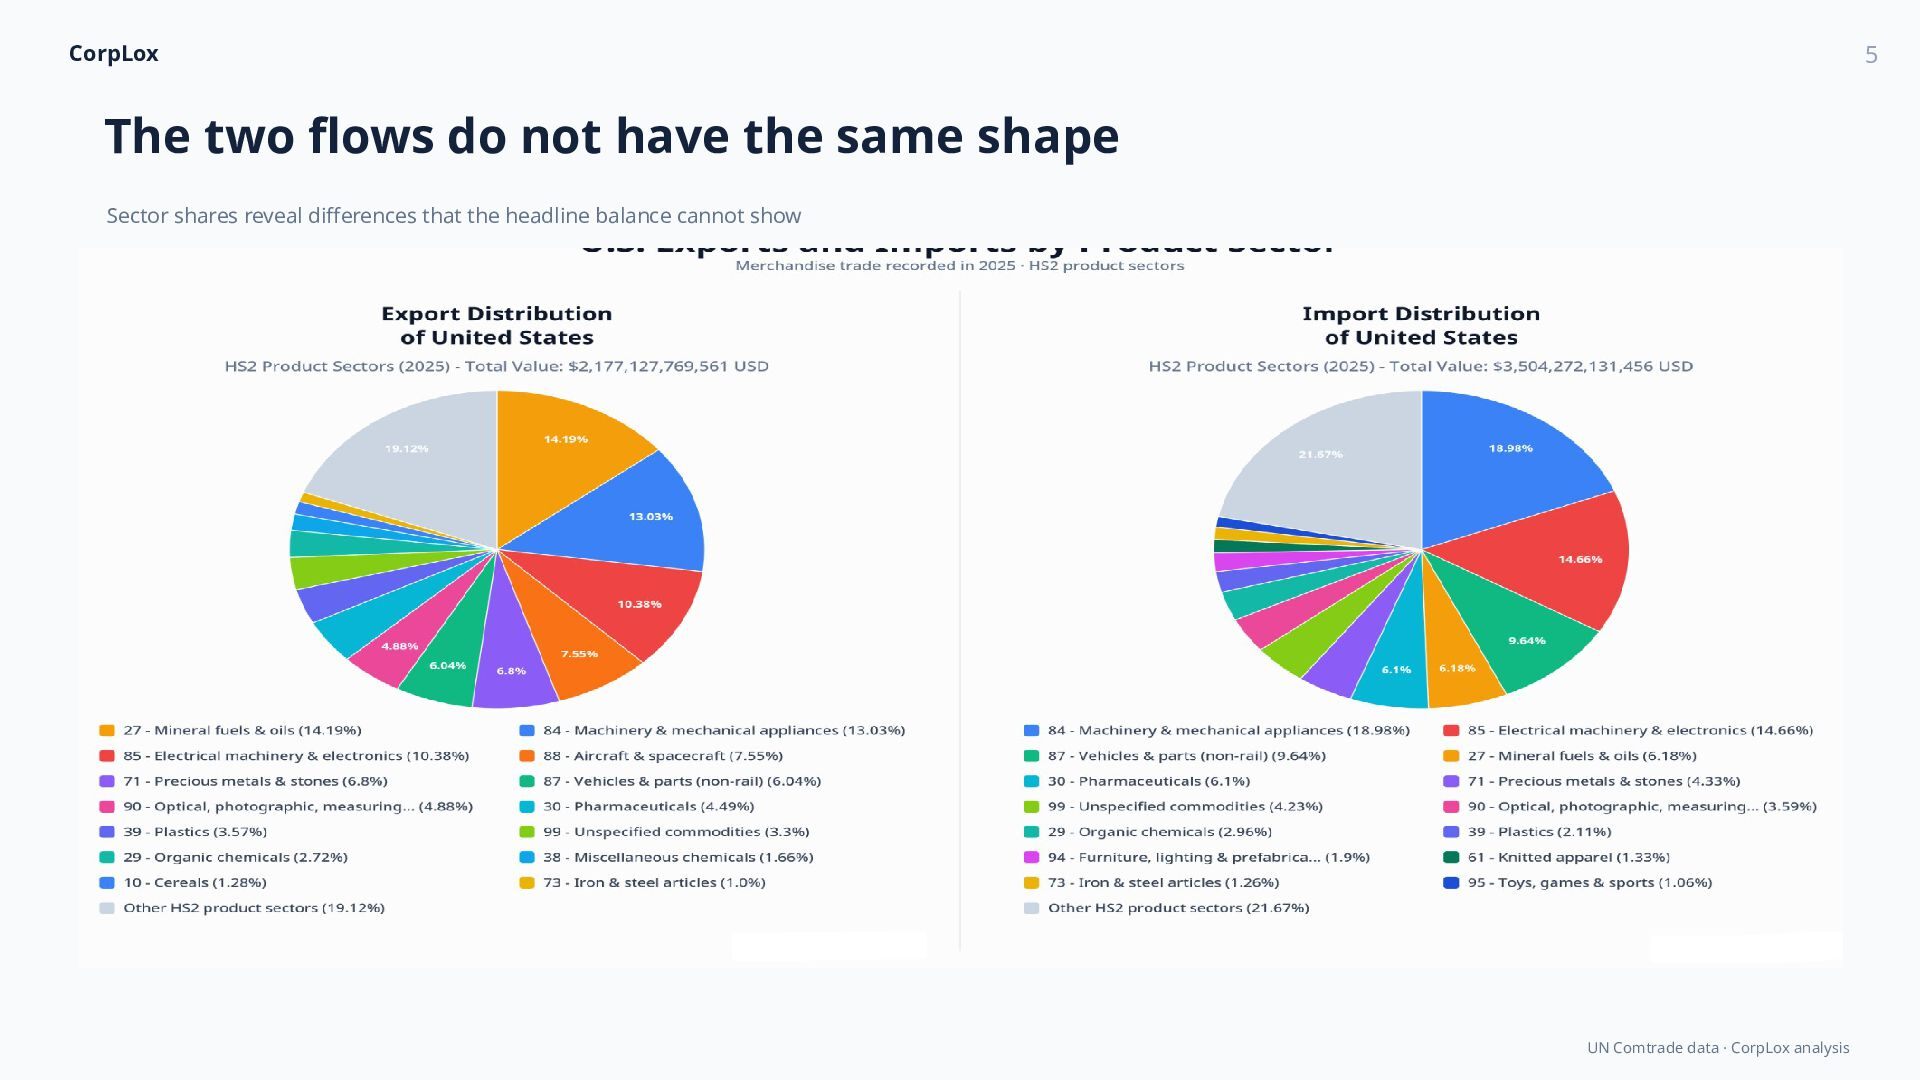
A short visual overview of U.S. merchandise exports and imports by HS2 product sector in 2025.
Full U.S. Trade Report on CorpLox:
https://corplox.net/trade/us Source data: UN Comtrade.
Analysis and visualization: CorpLox.
sector overview · UN Comtrade data · CorpLox analysis corplox.com/trade/us A short public deck built for sharing. Full tables and methodology are available on CorpLox. UN Comtrade data · CorpLox analysis
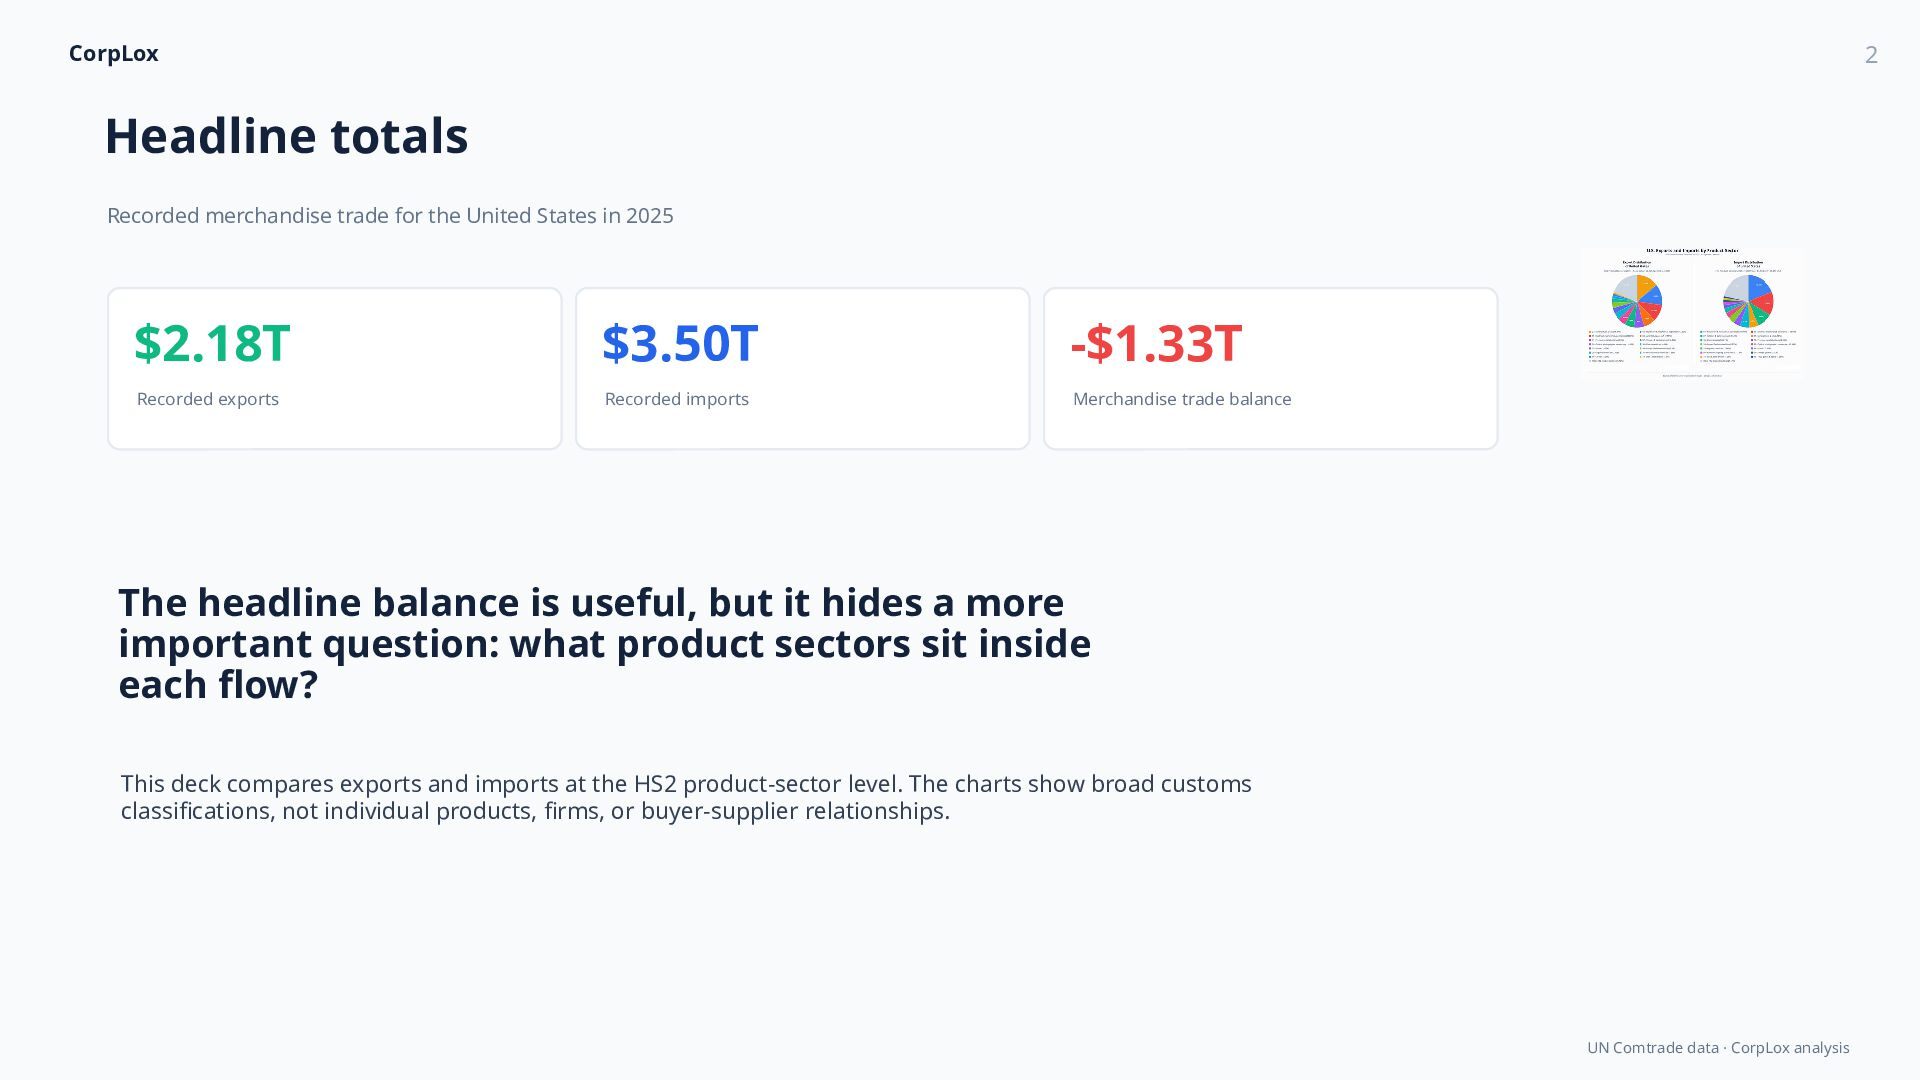
States in 2025 $2.18T $3.50T -$1.33T Recorded exports Recorded imports Merchandise trade balance The headline balance is useful, but it hides a more important question: what product sectors sit inside each flow? This deck compares exports and imports at the HS2 product-sector level. The charts show broad customs classifications, not individual products, firms, or buyer-supplier relationships. UN Comtrade data · CorpLox analysis
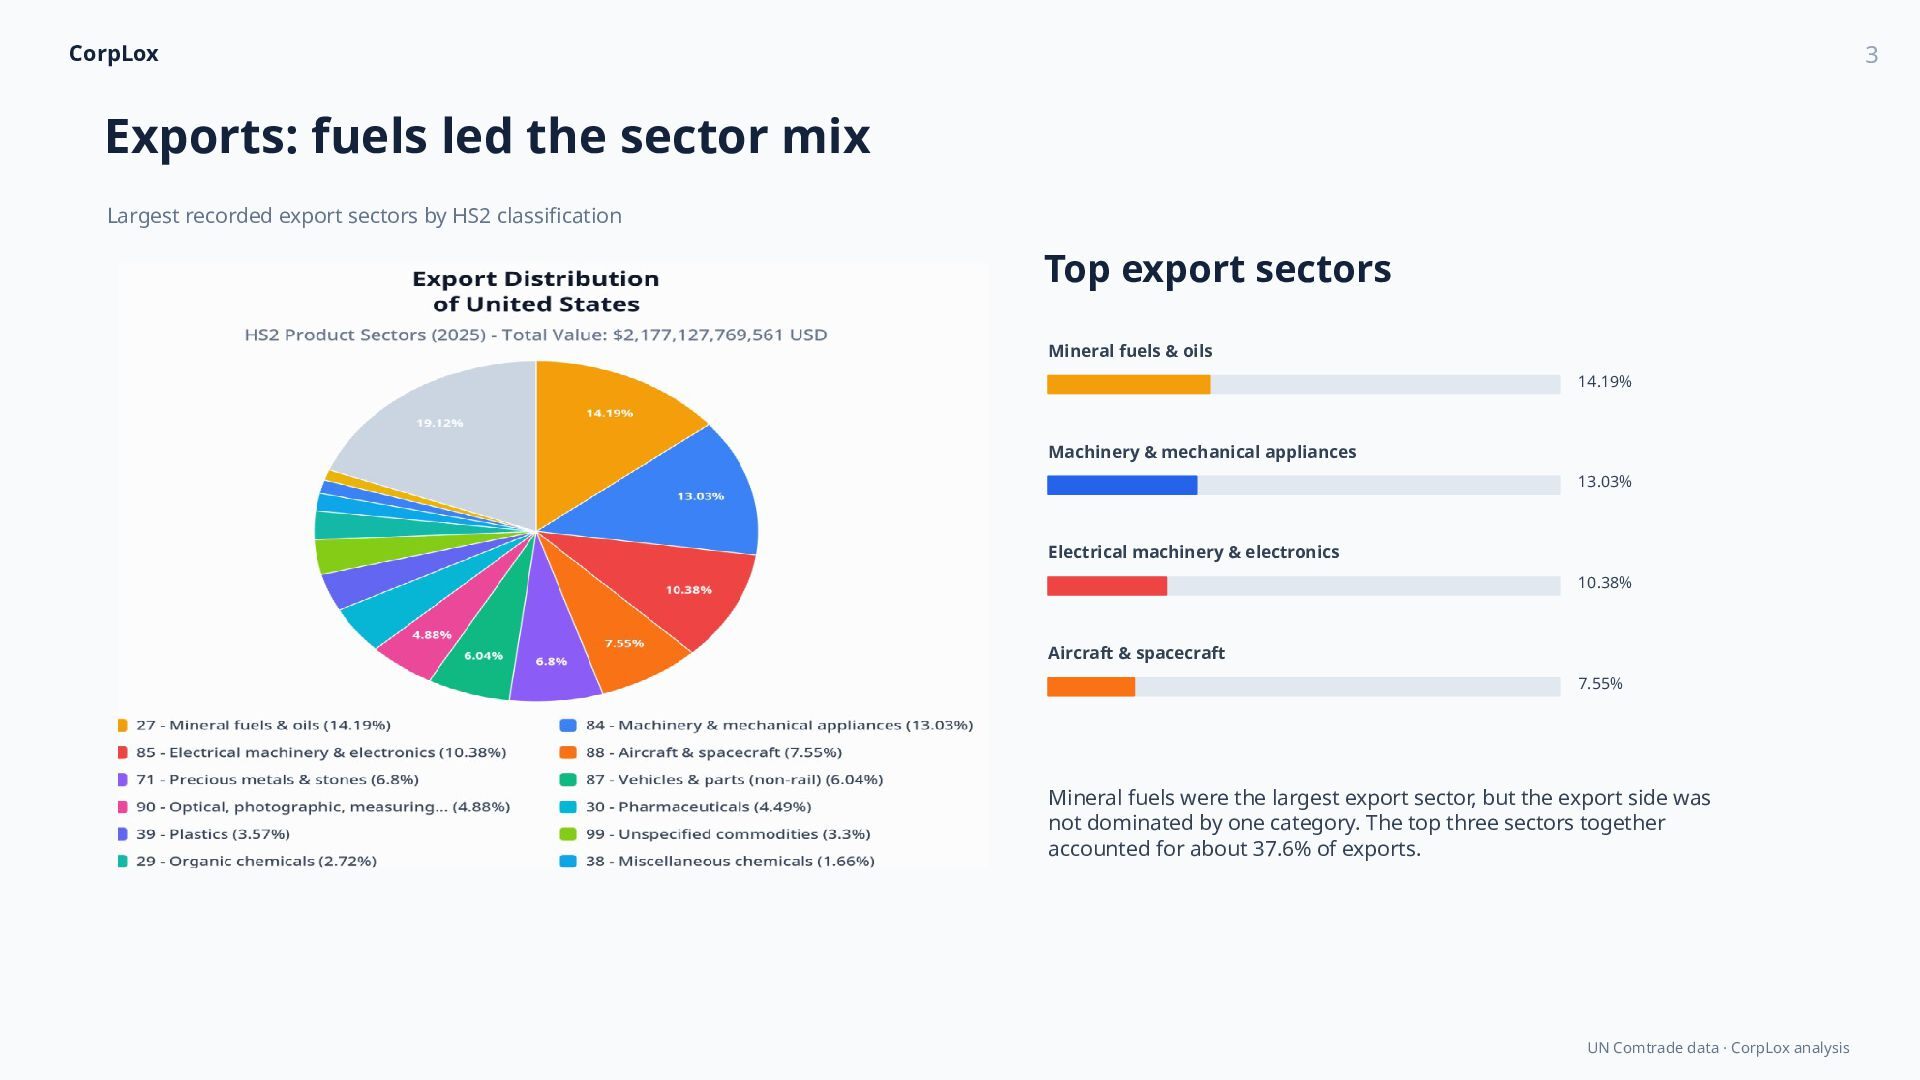
export sectors by HS2 classification Top export sectors Mineral fuels & oils 14.19% Machinery & mechanical appliances 13.03% Electrical machinery & electronics 10.38% Aircraft & spacecraft 7.55% Mineral fuels were the largest export sector, but the export side was not dominated by one category. The top three sectors together accounted for about 37.6% of exports. UN Comtrade data · CorpLox analysis
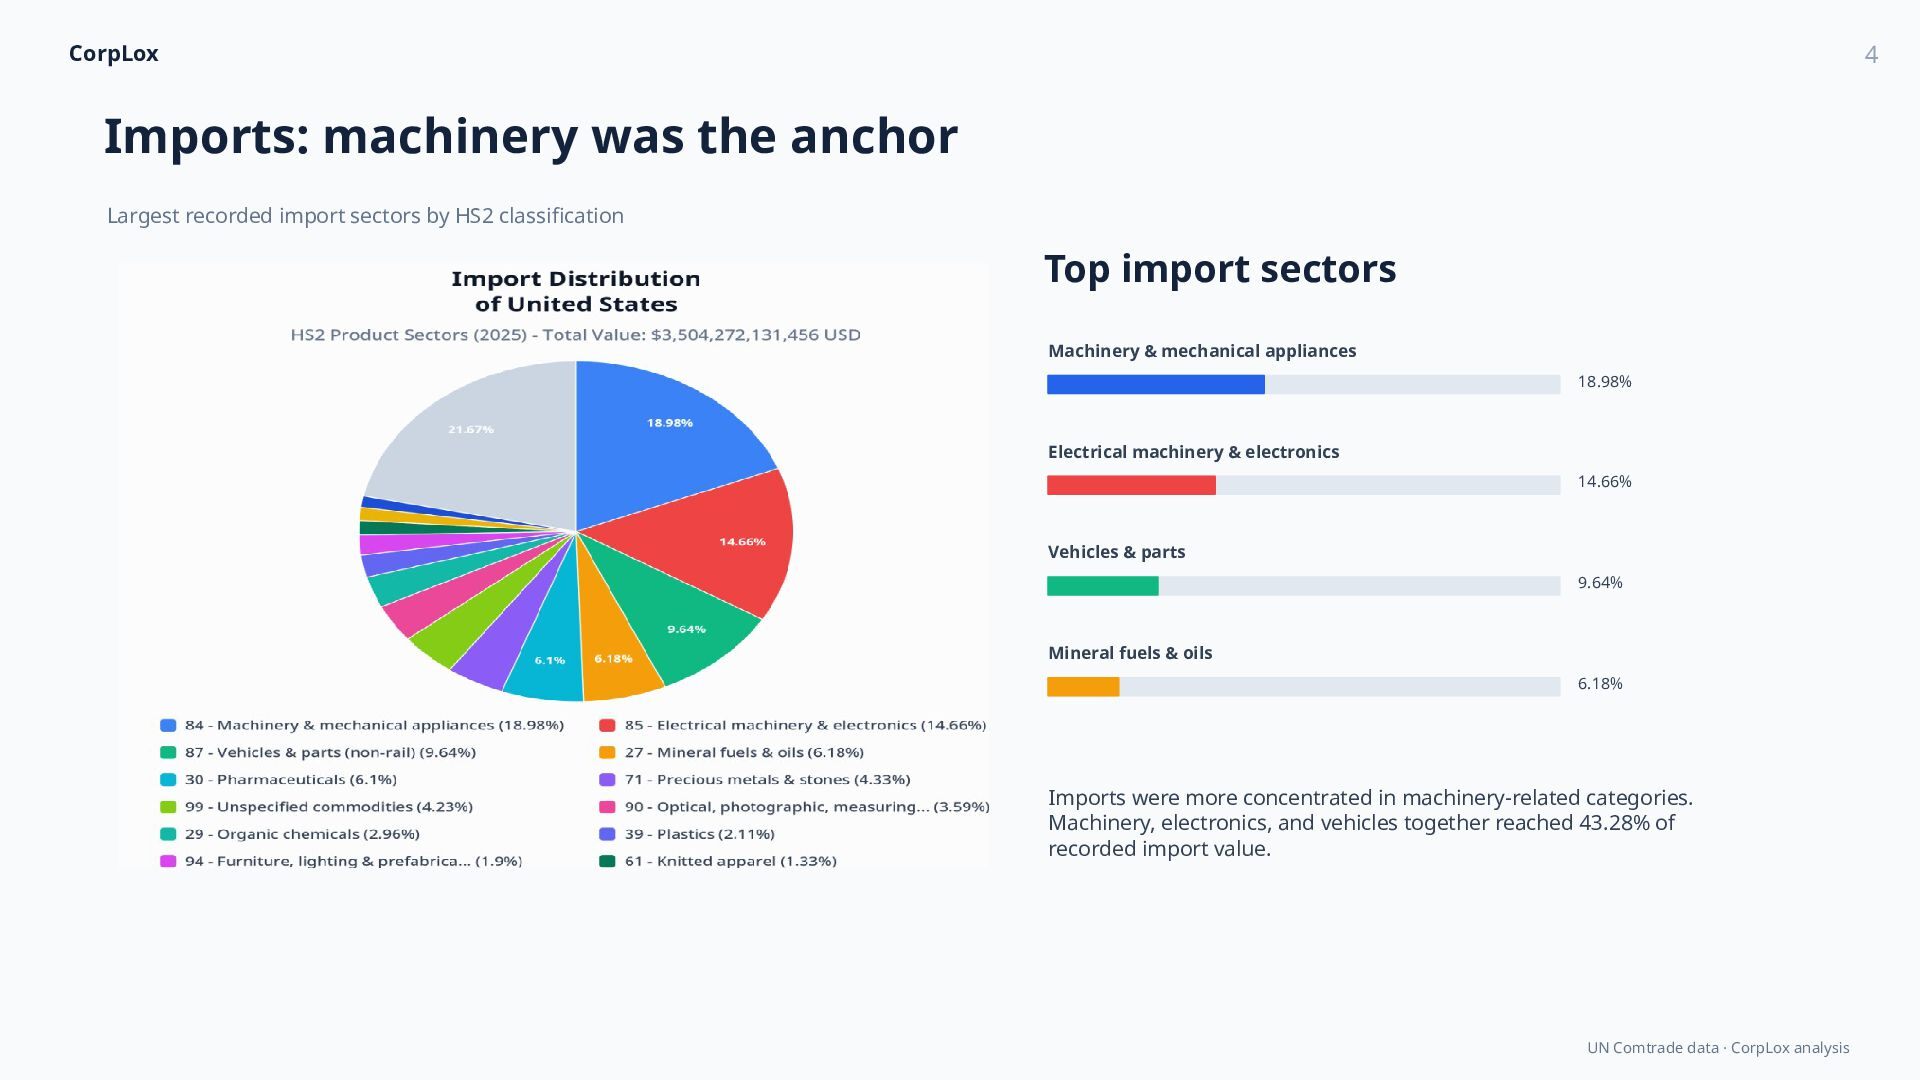
sectors by HS2 classification Top import sectors Machinery & mechanical appliances 18.98% Electrical machinery & electronics 14.66% Vehicles & parts 9.64% Mineral fuels & oils 6.18% Imports were more concentrated in machinery-related categories. Machinery, electronics, and vehicles together reached 43.28% of recorded import value. UN Comtrade data · CorpLox analysis
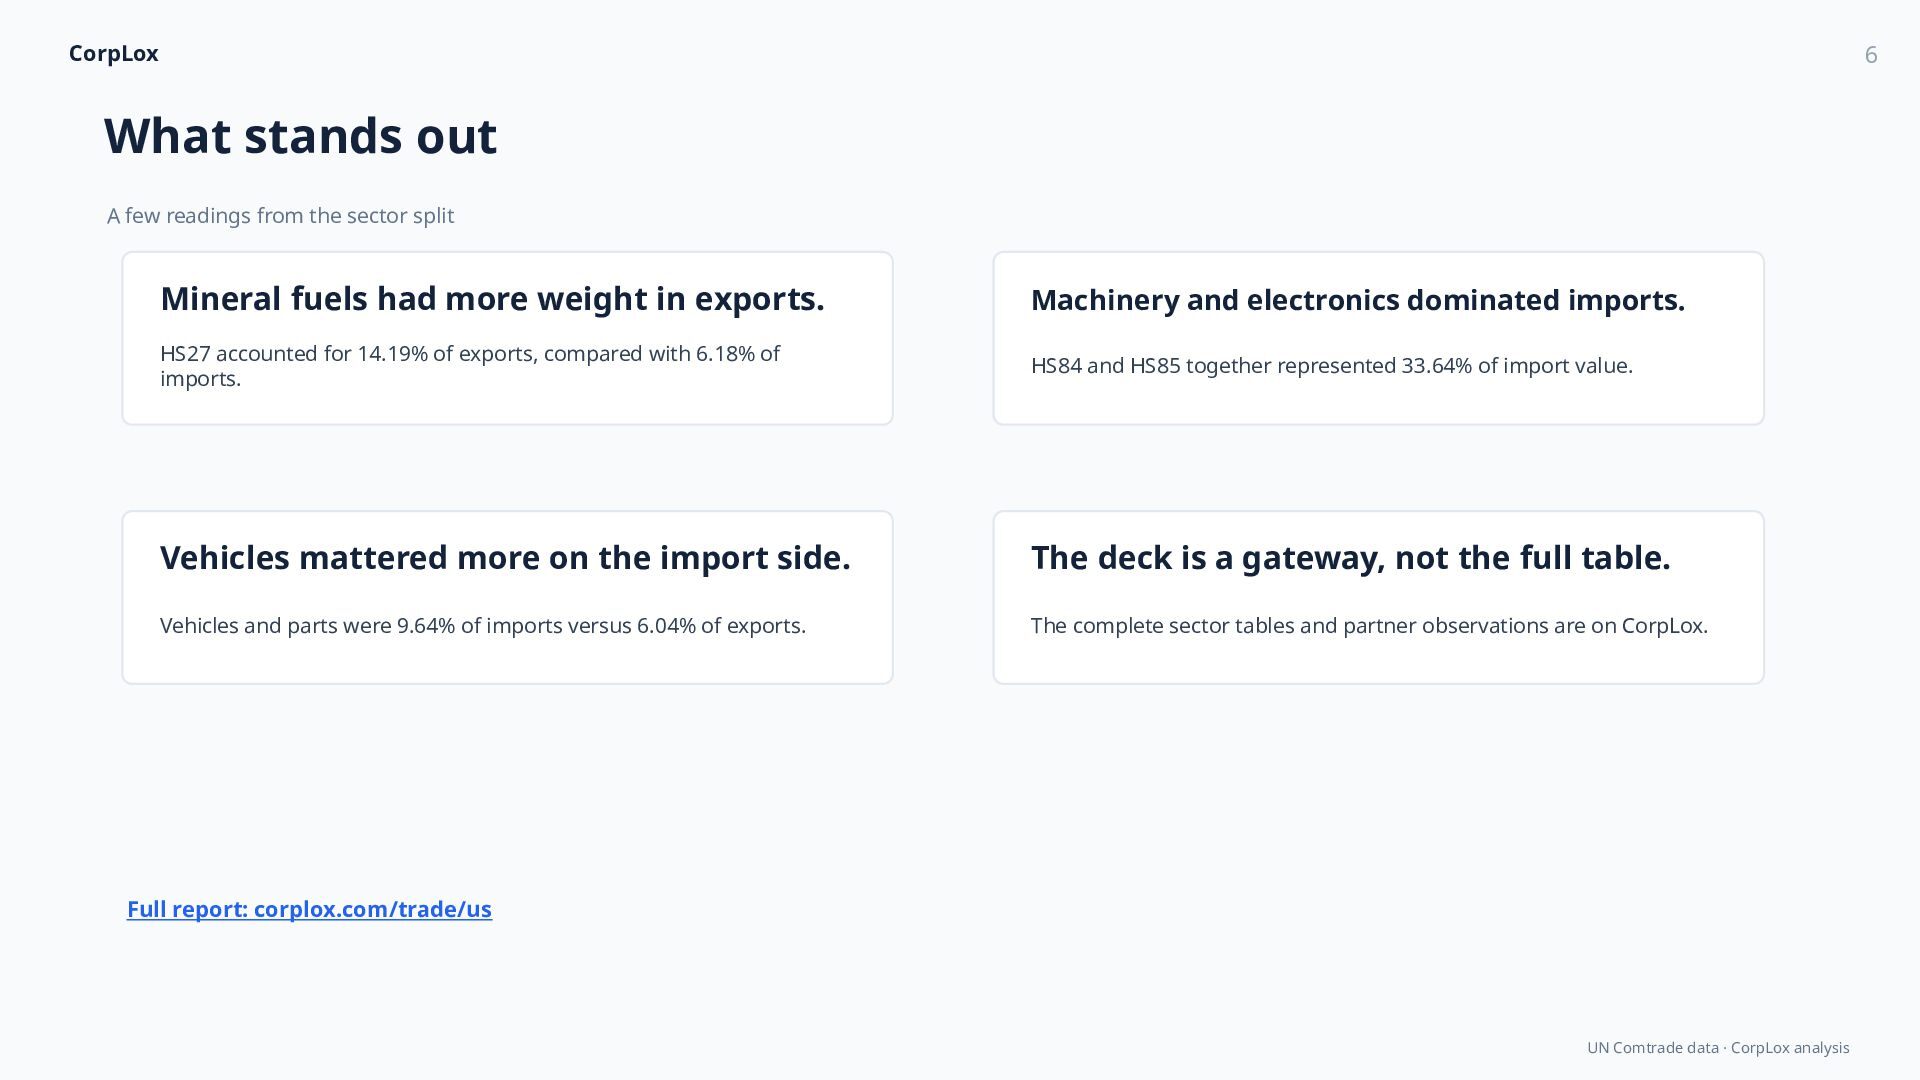
sector split Mineral fuels had more weight in exports. Machinery and electronics dominated imports. HS27 accounted for 14.19% of exports, compared with 6.18% of imports. HS84 and HS85 together represented 33.64% of import value. Vehicles mattered more on the import side. The deck is a gateway, not the full table. Vehicles and parts were 9.64% of imports versus 6.04% of exports. The complete sector tables and partner observations are on CorpLox. Full report: corplox.com/trade/us UN Comtrade data · CorpLox analysis
the numbers Recorded exports are not the same as domestic production. Recorded imports are not the same as final consumption. HS2 sectors are broad product classifications, not individual technologies or firms. Customs data does not establish buyer-supplier relationships between companies. Source records may be revised; use methodology notes when comparing periods. Methodology: corplox.com/methodology UN Comtrade data · CorpLox analysis
U.S. Trade Report on CorpLox. https://corplox.com/trade/us Source: UN Comtrade · Visualization and analysis: CorpLox UN Comtrade data · CorpLox analysis


 tbpgr
 ikuodanaka
 uniam
 daiksy
 kinsofficial
 nakasonejusetsu
 pokotyamu
 so_kotani
 ikmwatanabe
 speakbuddy
 mj6237
 holman
 leimatthew05
 aleyda
 chriscoyier
 ianozsvald
 nmsamuel
 schroneko
 lauravandoore
 kevinliebholz
 axbom
 katarinadahlin
 andyhume