Upgrade to Pro — share decks privately, control downloads, hide ads and more …

Are Safer Looking Neighborhoods More Lively? A ...

Are Safer Looking Neighborhoods More Lively? A multimodal Investigation into Urban Life

Presentation for the Responsive Environments: City eMotion course of Harvard University 2017.
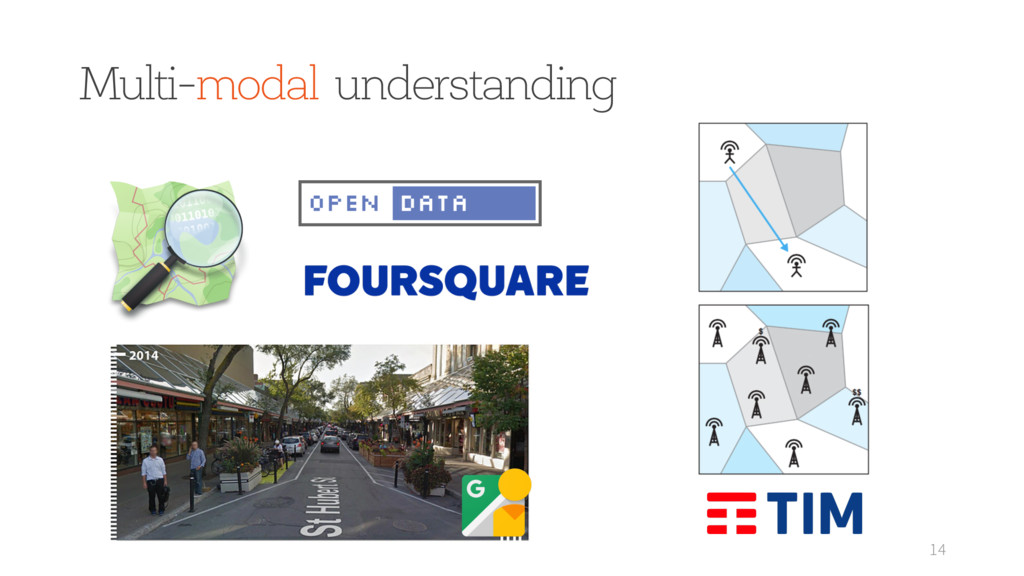
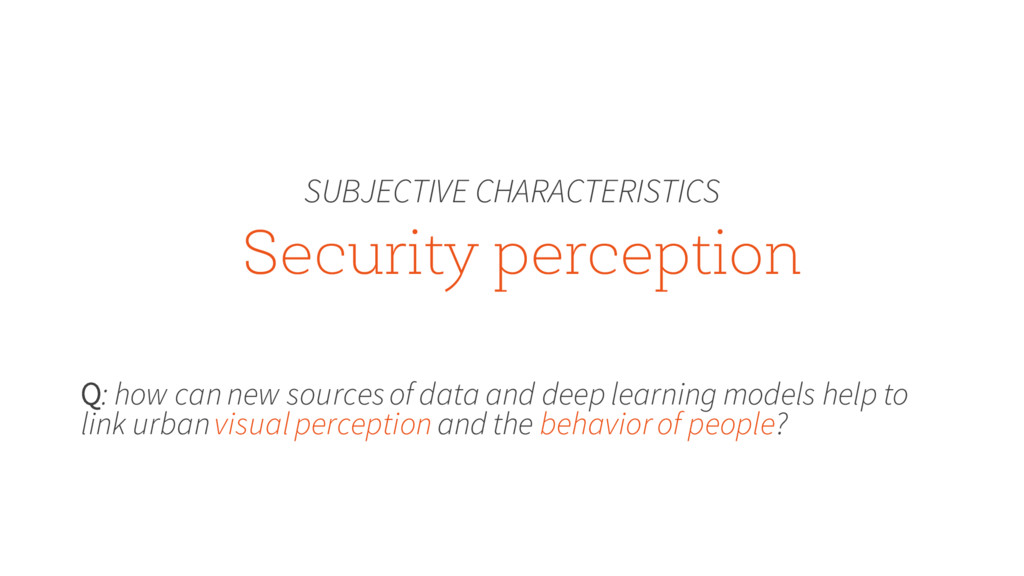
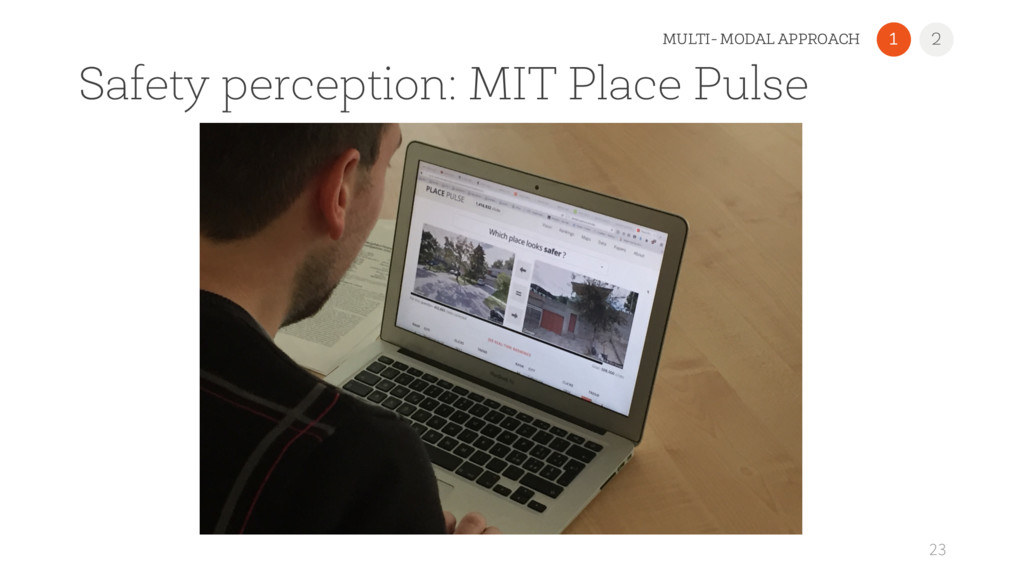
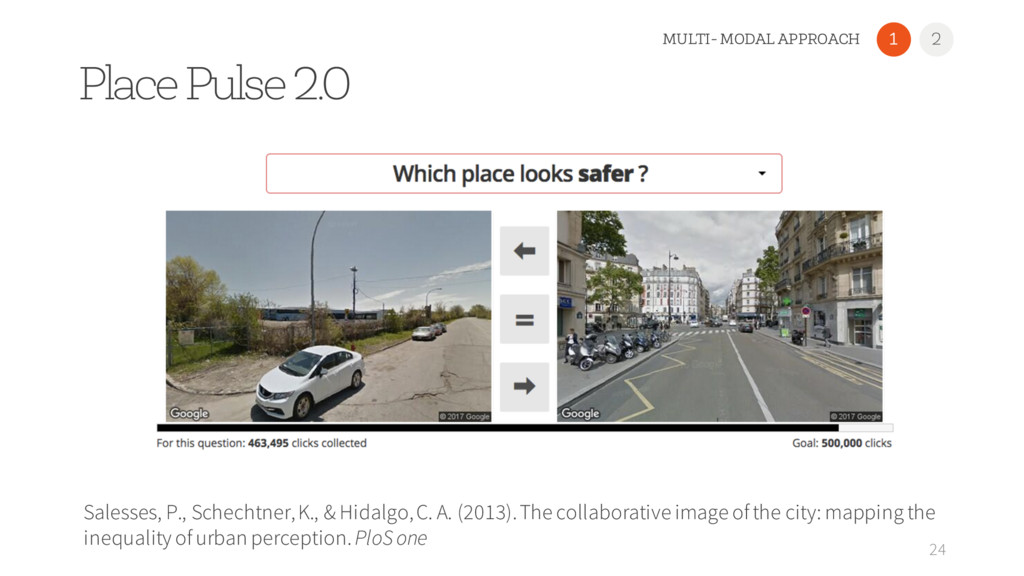
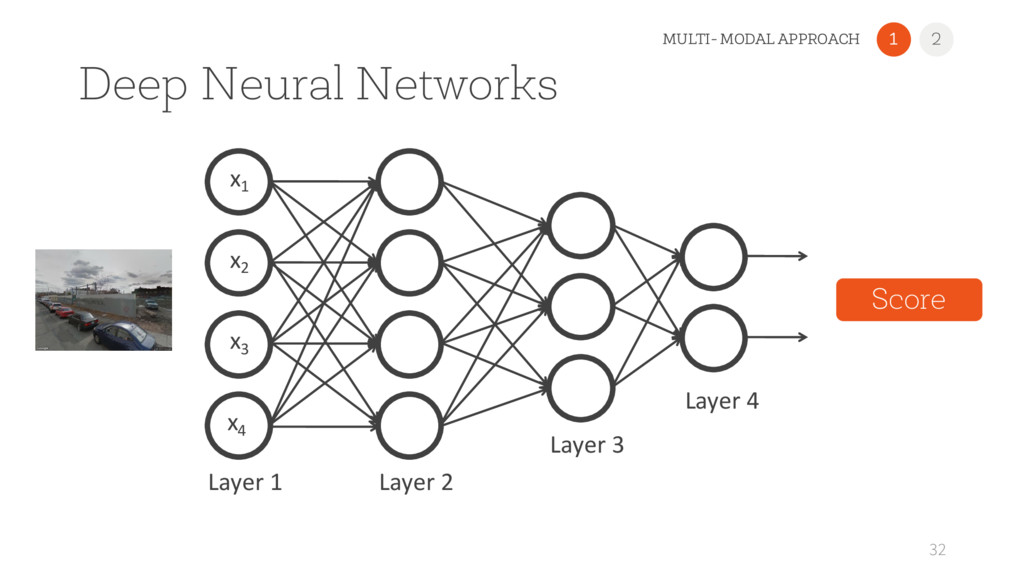
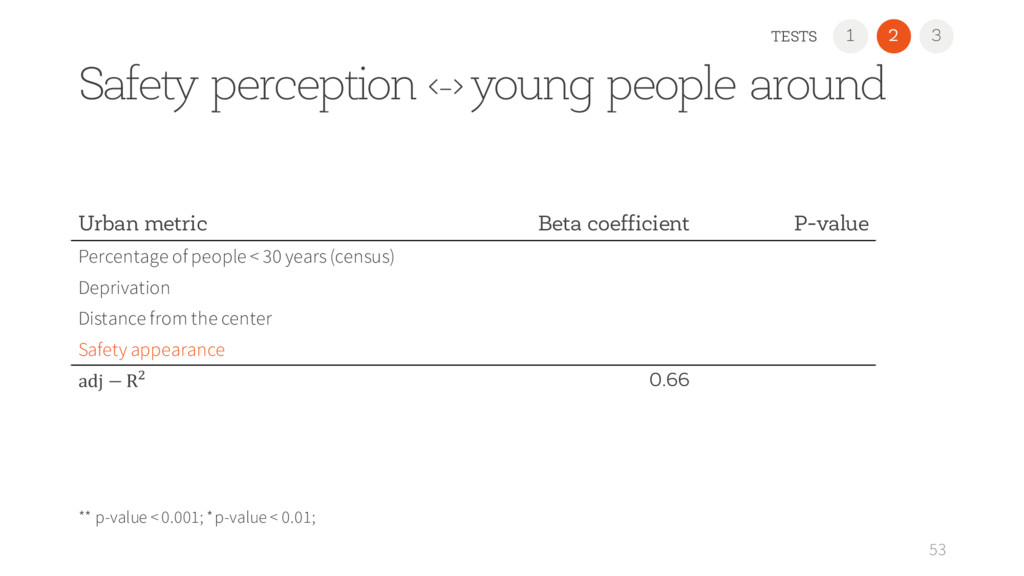
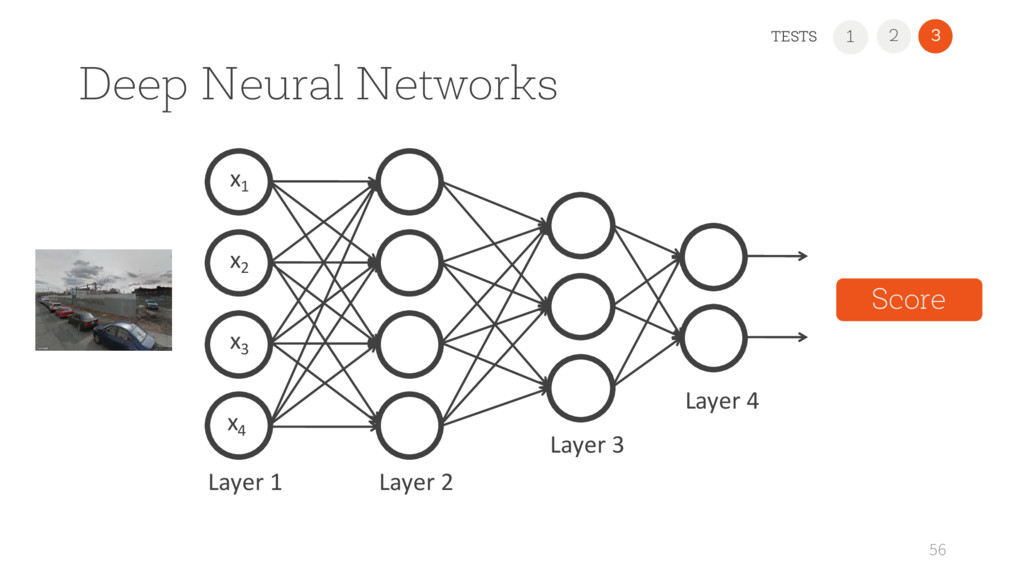
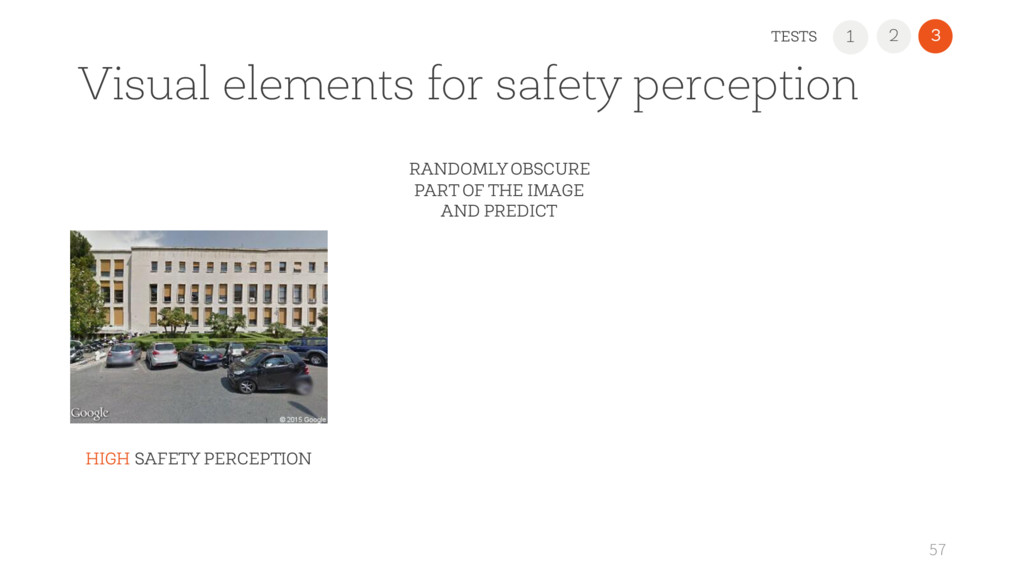
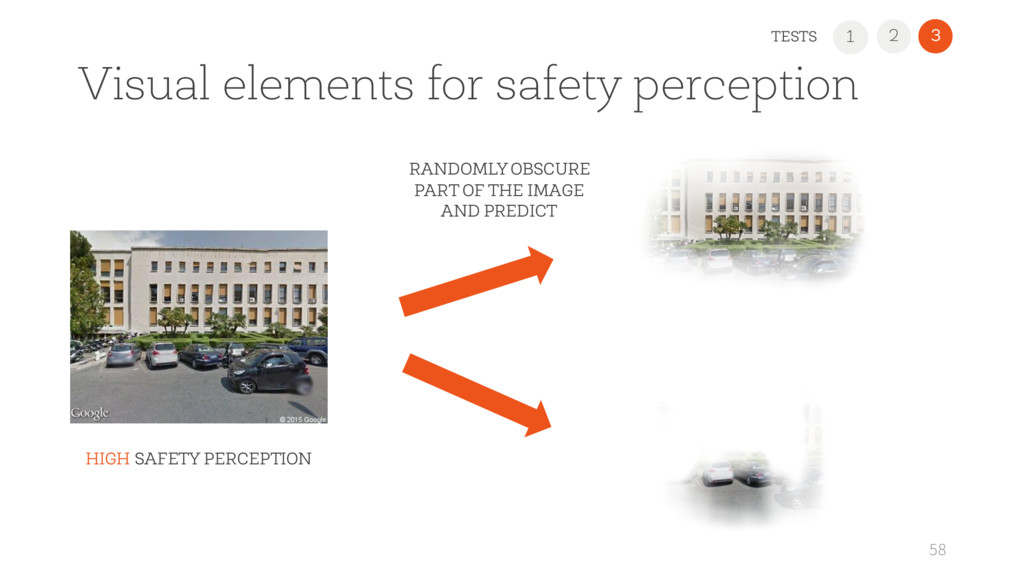
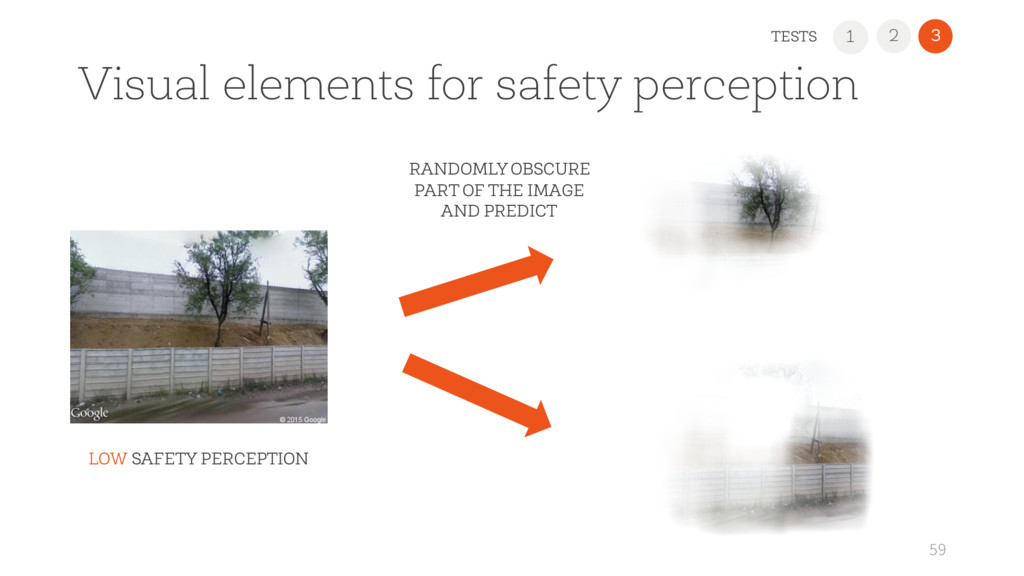
Study from Google street view images in order to understand safety perception in urban enviroment with Deep Learning techniques. Original paper: https://arxiv.org/abs/1608.00462

Avatar for Marco De Nadai

Marco De Nadai

March 30, 2017
Tweet

More Decks by Marco De Nadai

Other Decks in Research

Transcript

  1. Marco De Nadai Are Safer Looking Neighborhoods More Lively? A

    multimodal Investigation into Urban Life
  2. Who am I? 2 • Ph.D. student in Computer science

    • Reality: I’m in Computational Social Science • University of Trento (Italy) - FBK
  3. Outline 3 • Motivation to study cities • How we

    do it • Security perception • Methods • Results • Next
  4. Cities, very difficult to explain 4 COMPLEX Not only agglomeration

    of residents, factories, shops • Millions of individuals • Continuously evolving A small change generates a cascading throughout
  5. The role of data mining and machine learning 5 DATA

    MINING • Inexpensive way to understand mechanisms; • New stimulus to social research; MACHINE LEARNING • New tools to expand the notion of what is predictable; Shmueli, Galit. "To explain or to predict?." Statistical science 25, no. 3 (2010): 289-310.
  6. Predict deprivation and per-capita income solely relying on mobility diversity

    and social diversity 6 Pappalardo, L., Vanhoof, M., Gabrielli, L., Smoreda, Z., Pedreschi, D., & Giannotti, F. (2016). An analytical framework to nowcast well-being using mobile phone data. International Journal of Data Science and Analytics
  7. Predict poverty from satellite imagery (75% variation of economic outcomes)

    7 Jean, N., Burke, M., Xie, M., Davis, W. M., Lobell, D. B., & Ermon, S. (2016). Combining satellite imagery and machine learning to predict poverty. Science
  8. Predict crime rates from POIs, mobility, demographics 8 Wang, H.,

    Kifer, D., Graif, C., & Li, Z. (2016). Crime rate inference with big data. In Proceedings of the 22nd ACM SIGKDD.
  9. Understand underlying mechanisms of a city 9 Arbesman, Samuel. Overcomplicated:

    Technology at the Limits of Comprehension. Penguin, 2016.
  10. Understand underlying mechanisms of a city 10 Arbesman, Samuel. Overcomplicated:

    Technology at the Limits of Comprehension. Penguin, 2016. Describe
  11. Understand underlying mechanisms of a city 11 Arbesman, Samuel. Overcomplicated:

    Technology at the Limits of Comprehension. Penguin, 2016. Describe Predict
  12. Understand underlying mechanisms of a city 12 Arbesman, Samuel. Overcomplicated:

    Technology at the Limits of Comprehension. Penguin, 2016. Describe Predict Generate
  13. Understand underlying mechanisms of a city 13 Arbesman, Samuel. Overcomplicated:

    Technology at the Limits of Comprehension. Penguin, 2016. Describe Predict Generate
  14. A multitude of dimensions and aspects! 15 DESCRIBE & PREDICT

    PREDICT & GENERATE Crime 3 Urban vitality 1 Security perception 2 Structural design 4
  15. Security perception SUBJECTIVE CHARACTERISTICS Q: how can new sources of

    data and deep learning models help to link urban visual perception and the behavior of people?
  16. Broken windows theory • City mismanagement • Dirty places •

    Poor infrastructure Lead to misbehavior => Crime 17 Wilson, James Q., and George L. Kelling. "Broken windows." Critical issues in policing: Contemporary readings (1982): 395- 407. 2 1 3 SECURITY PERCEPTION 4
  17. Jane Jacobs and Newman Two of the most influential books

    in city planning • Lit streets • Street-facing windows • Physical demarcation private-public 18 Klemek, C. (2011) ‘Dead or Alive at Fifty? Reading Jane Jacobs on her Golden Anniversary’ Dissent, Vol. 58, No. 2, 75–79. 2 1 3 URBAN VITALITY 4
  18. Answer by surveys! • High costs • Not scalable •

    # people • # cities • How should we design the survey? 20
  19. Place Pulse 2.0 24 Salesses, P., Schechtner, K., & Hidalgo,

    C. A. (2013). The collaborative image of the city: mapping the inequality of urban perception. PloS one 1 2 MULTI- MODAL APPROACH
  20. Safety perception: MIT Place Pulse 25 … 1 10 1

    2 MULTI- MODAL APPROACH Place Pulse • New York • Boston • Linz • Salzburg Place Pulse 2 • Rome • Milan PROBLEM: • Just thousands of examples • Sparse in space and # votes
  21. Safety perception: fix sparse images • From 6.7 to 100

    images per km^2 • 360 degrees of images • Learning safety perception, predict in Rome and Milan • Aggregation per district 26 1 2 MULTI- MODAL APPROACH
  22. Deep Learning Networks (DNNs) • How do you extract features?

    • Handcraft features • Implicitly (Kernels) • Self-taught learning (learn representation) • Black boxes • Hard to train 27 1 2 MULTI- MODAL APPROACH
  23. DNNs: Representation 28 1 2 MULTI- MODAL APPROACH * From

    Paolo Frasconi slides – Deep Learning course – University of Trento
  24. DNNs: pre-trained Imagenet/Places 31 1 2 MULTI- MODAL APPROACH •

    Trained on 1.2 millions of images Hard to train?
  25. Deep Neural Networks 32 1 2 MULTI- MODAL APPROACH x1

    x2 x3 Layer 1 Layer 2 Layer 4 Layer 3 x4 Score
  26. Safety perception: fix sparse votes • Learning safety perception, predict

    in Rome and Milan • Standard architecture AlexNet CNN 33 * B. Zhou, A. Lapedriza, J. Xiao, A. Torralba, and A. Oliva. “Learning Deep Features for Scene Recognition using Places Database.” NIPS, 2014. 1 2 MULTI- MODAL APPROACH
  27. Safety perception: fix sparse votes • Learning safety perception, predict

    in Rome and Milan • Standard architecture AlexNet CNN 34 * B. Zhou, A. Lapedriza, J. Xiao, A. Torralba, and A. Oliva. “Learning Deep Features for Scene Recognition using Places Database.” NIPS, 2014. Model type NY - NY NY - Boston Boston - Boston Boston - NY 1 2 MULTI- MODAL APPROACH
  28. Safety perception: fix sparse votes • Learning safety perception, predict

    in Rome and Milan • Standard architecture AlexNet CNN 35 * B. Zhou, A. Lapedriza, J. Xiao, A. Torralba, and A. Oliva. “Learning Deep Features for Scene Recognition using Places Database.” NIPS, 2014. ** Ordonez, Vicente, and Tamara L. Berg. "Learning high-level judgments of urban perception.” ECCV, 2014. Model type State of art [**] Our model NY - NY 0.687 0.718 NY - Boston 0.701 0.734 Boston - Boston 0.718 0.744 Boston - NY 0.636 0.693 1 2 MULTI- MODAL APPROACH
  29. Safety perception: aggregation 36 1 2 MULTI- MODAL APPROACH 3.5

    3.7 3.9 4.2 4.4 4.6 4.8 5.0 Safety score DUOMO SAN SIRO QUARTO OGGIARO CITTA' STUDI BICOCCA TRASTEVERE TIBURTINO OSTIENSE PRIMAVALLE LESS SAFE SAFER ROME MILAN
  30. 1 2 Liveliness: mobile phone data • Anonymized mobile phone

    calls activity as a proxy for urban liveliness • Broken down by gender, age • 3 months time span (in 2015) • Rome and Milan 38 MULTI- MODAL APPROACH
  31. Liveliness: metrics • People around in district |',)*+ | |'

    | • Fraction females |',)*+ | |',)*+ | • People below 30 (and above 50) |(< 30)',)*+ | |',)*+ | 39 0.2 0.0 0.2 0.4 0.6 0.8 1.0 Land Use Mix 0.8 1.2 1.8 2.7 4.1 6.1 9.3 14.0 21.1 31.9 Activity density ⇥ 103 ROME MILAN 0.8 1.2 1.8 2.7 4.1 6.1 9.3 14.0 21.1 31.9 Activity density 103 MILAN MULTI- MODAL APPROACH 1 2
  32. 1 Link: regression 40 4.2 4.4 4.6 4.8 5.0 afety

    score DUOMO SAN SIRO QUARTO OGGIARO CITTA' STUDI BICOCCA MULTI- MODAL APPROACH 2 0.2 0.0 0.2 0.4 0.6 0.8 1.0 1.2 Land Use Mix 0.8 1.2 1.8 2.7 4.1 6.1 9.3 14.0 21.1 3 Activity density ⇥ 103 MILAN SAFETY PERCEPTION LIVELINESS
  33. = : : + ) ) + ⋯ + >

    > + The Linear Regression 41 Liveliness metric 1 MULTI- MODAL APPROACH 2
  34. The Linear Regression 42 Liveliness metric Perceived safety = :

    : + ) ) + ⋯ + > > + 1 MULTI- MODAL APPROACH 2
  35. The Linear Regression 43 Liveliness metric Perceived safety Population density

    = : : + ) ) + ⋯ + > > + 1 MULTI- MODAL APPROACH 2
  36. Spatial auto-correlation 44 Getis, Arthur, and Daniel A. Griffith. "Comparative

    spatial filtering in regression analysis." Geographical analysis 34.2 (2002): 130-140. “everything is related to everything else, but near things are more related than distant things.” Tobler's first law of geography • We control for spatial auto-correlation 1 2 MULTI- MODAL APPROACH
  37. Safety perception and liveliness 46 1 Presence of people Women,

    Young people around Visual elements for safety 2 3
  38. 2 1 Safety perception <-> presence of people 48 3

    TESTS Urban metric Beta coefficient P-value Population density Employees density Deprivation Distance from the center Safety appearance adj − R) 0.91
  39. 2 1 Safety perception <-> presence of people 49 3

    TESTS Urban metric Beta coefficient P-value Population density 0.155 ** Employees density 0.328 ** Deprivation -0.022 Distance from the center -0.257 ** Safety appearance 0.105 ** adj − R) 0.91 ** p-value < 0.001; * p-value < 0.01;
  40. 1 2 51 3 TESTS ** p-value < 0.001; *

    p-value < 0.01; Safety perception <-> women around Urban metric Beta coefficient P-value Percentage of women (census) Deprivation Distance from the center Safety appearance adj − R) 0.65
  41. 1 2 52 3 TESTS ** p-value < 0.001; *

    p-value < 0.01; Safety perception <-> women around Urban metric Beta coefficient P-value Percentage of women (census) 0.001 Deprivation -0.005 Distance from the center -0.003 Safety appearance 0.020 ** adj − R) 0.65
  42. 1 2 53 3 TESTS ** p-value < 0.001; *

    p-value < 0.01; Safety perception <-> young people around Urban metric Beta coefficient P-value Percentage of people < 30 years (census) Deprivation Distance from the center Safety appearance adj − R) 0.66
  43. 1 2 54 3 TESTS ** p-value < 0.001; *

    p-value < 0.01; Safety perception <-> young people around Urban metric Beta coefficient P-value Percentage of people < 30 years (census) -0.001 Deprivation 0.032 ** Distance from the center -0.150 ** Safety appearance -0.048 ** adj − R) 0.66
  44. Deep Neural Networks 56 x1 x2 x3 Layer 1 Layer

    2 Layer 4 Layer 3 x4 Score 1 2 3 TESTS
  45. 1 2 3 Visual elements for safety perception 57 TESTS

    HIGH SAFETY PERCEPTION RANDOMLY OBSCURE PART OF THE IMAGE AND PREDICT
  46. 1 2 3 Visual elements for safety perception 58 TESTS

    HIGH SAFETY PERCEPTION RANDOMLY OBSCURE PART OF THE IMAGE AND PREDICT
  47. 1 2 3 Visual elements for safety perception 59 TESTS

    LOW SAFETY PERCEPTION RANDOMLY OBSCURE PART OF THE IMAGE AND PREDICT
  48. “What this [paper] does is put the facts on the

    table, and that’s a big step” … “It will bring up a lot of other research, in which, I don’t have any doubt, this will be put up as a seminal step” Luis Valenzuela, Urban Planner Harvard University Source: http://news.mit.edu/2016/quantifying-urban-revitalization-1024
  49. Useful! • Evaluate the districts vitality through visual appearance •

    Plan regulatory interventions • Mobile phone data as valid proxy to census 63 Barlacchi, Gianni, et al. "A multi-source dataset of urban life in the city of Milan and the Province of Trentino." Scientific data 2 (2015).
  50. Practical applications • Real estate evaluation (land and buildings) •

    Know in advance the best places for retails (age/gender) • Analyze economic shocks in a region and respond to them 64
  51. In the (next) future • Temporal dimension (aesthetic change, people’s

    behavior) • How urban perception influences our mobility? 65 A B
  52. 66 1 Presence of people Women, Young people around Visual

    elements for safety 2 3 Safety perception and liveliness a multi-modal approach