in city planning • planning models that dominated mid-century planning • American housing policy (HOPE VI) • Melbourne, Toronto etc. 79 1 2 3 4 THEORY TEST Klemek, C. (2011) ‘Dead or Alive at Fifty? Reading Jane Jacobs on her Golden Anniversary’ Dissent, Vol. 58, No. 2, 75–79.
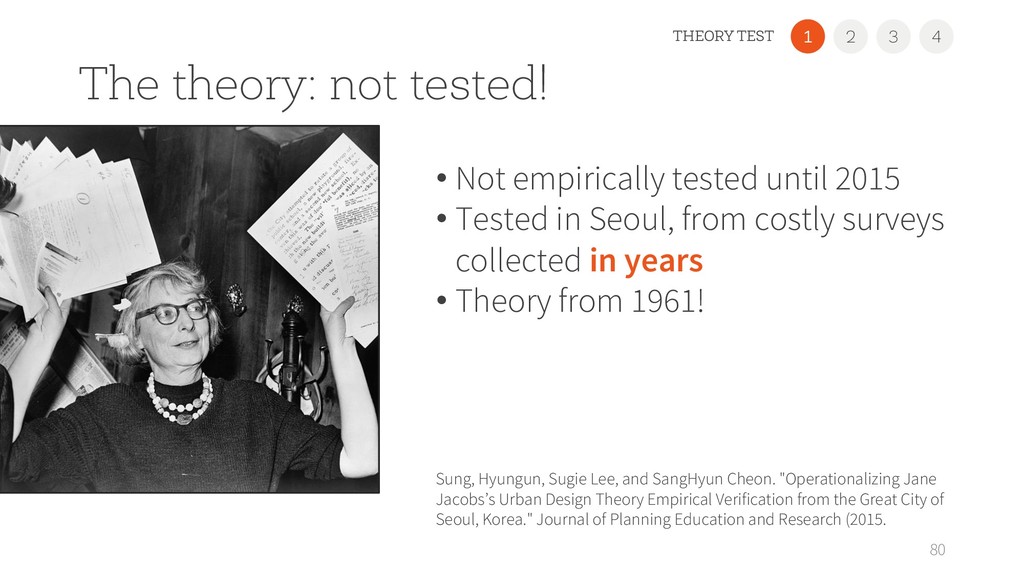
• Tested in Seoul, from costly surveys collected in years • Theory from 1961! 80 1 2 3 4 THEORY TEST Sung, Hyungun, Sugie Lee, and SangHyun Cheon. "Operationalizing Jane Jacobs’s Urban Design Theory Empirical Verification from the Great City of Seoul, Korea." Journal of Planning Education and Research (2015.
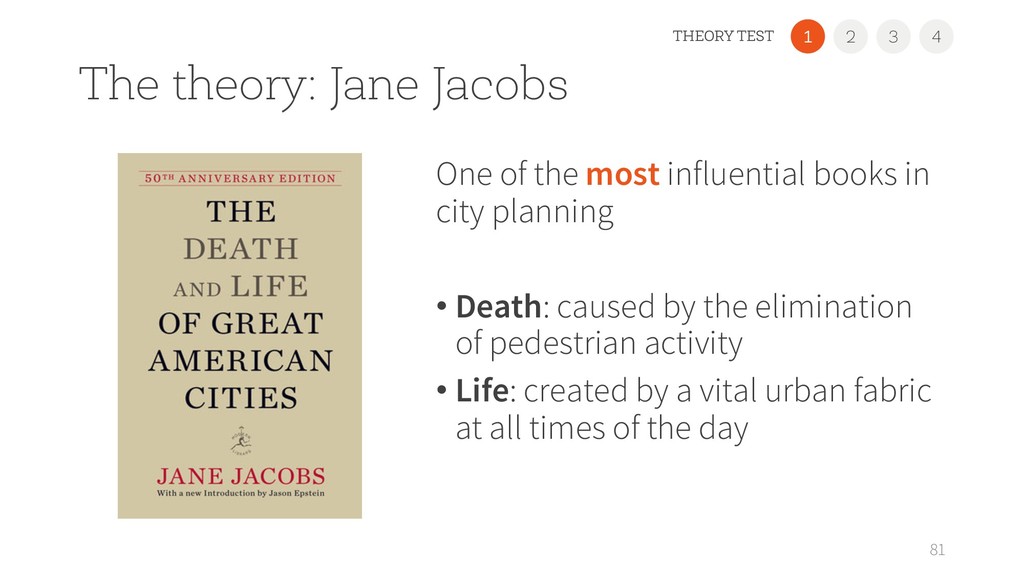
in city planning • Death: caused by the elimination of pedestrian activity • Life: created by a vital urban fabric at all times of the day 81 1 2 3 4 THEORY TEST
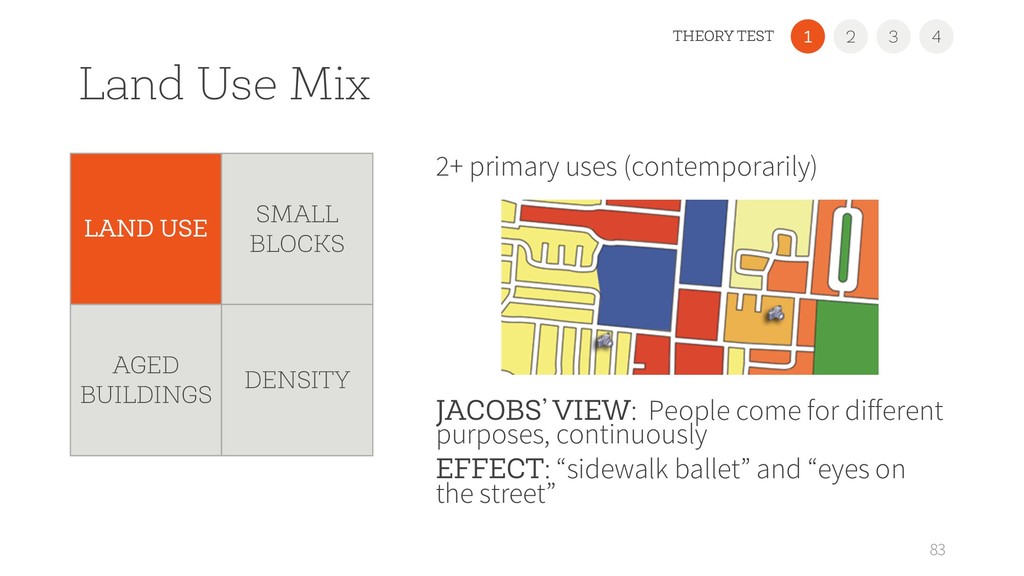
come for different purposes, continuously EFFECT: “sidewalk ballet” and “eyes on the street” 83 LAND USE SMALL BLOCKS AGED BUILDINGS DENSITY 1 2 3 4 THEORY TEST
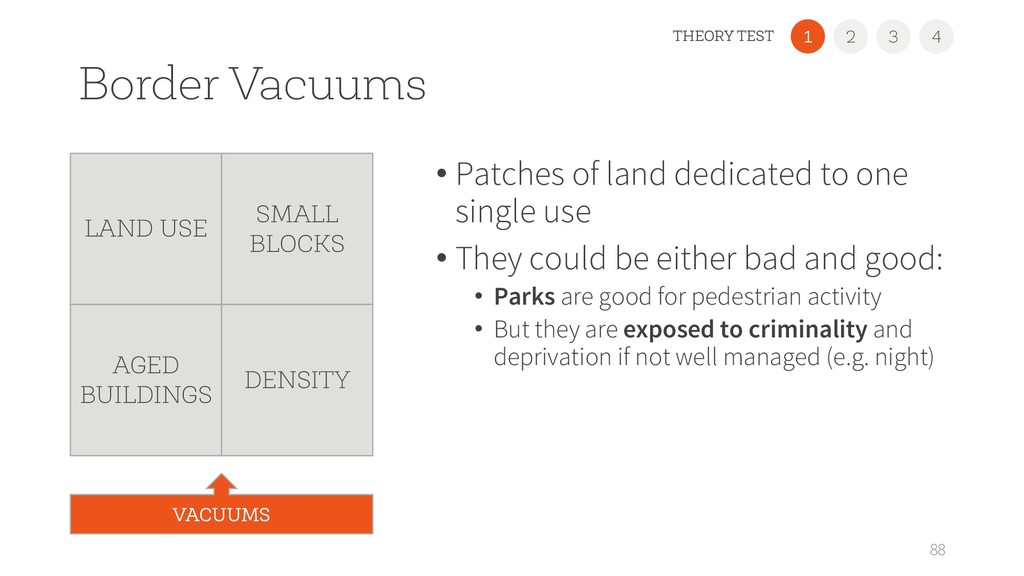
use • They could be either bad and good: • Parks are good for pedestrian activity • But they are exposed to criminality and deprivation if not well managed (e.g. night) 88 LAND USE SMALL BLOCKS AGED BUILDINGS DENSITY VACUUMS 1 2 3 4 THEORY TEST
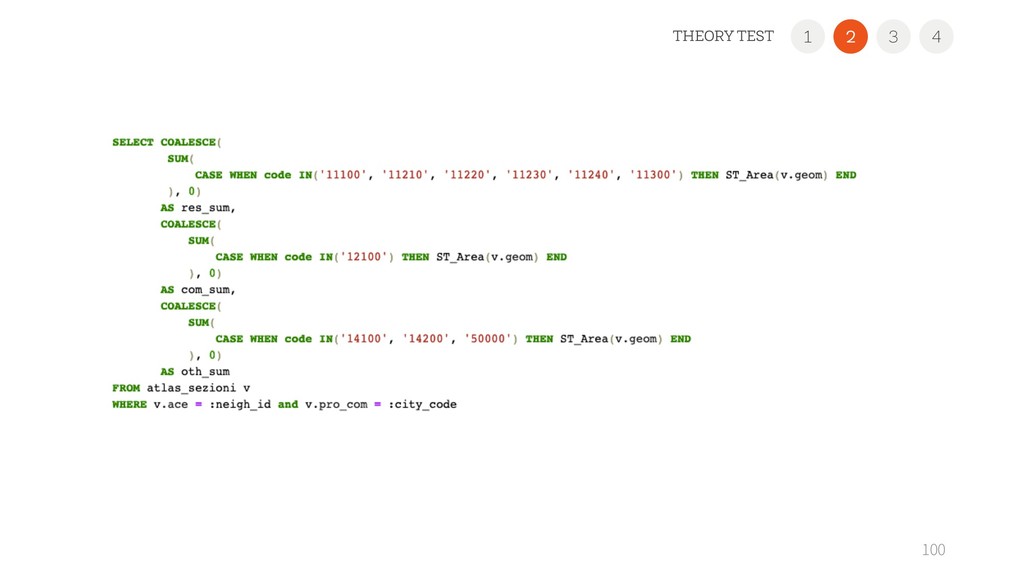
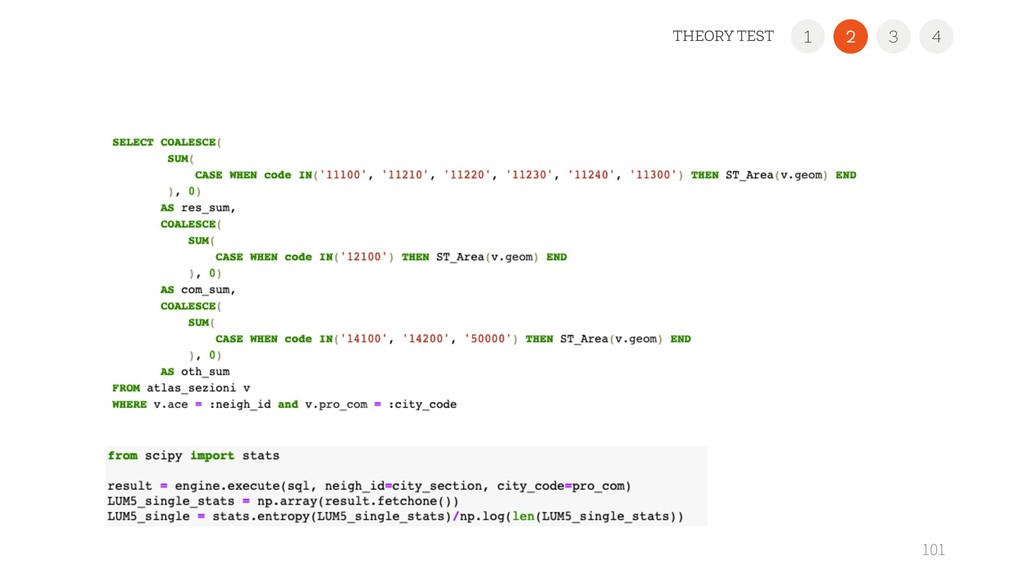
( )∈+ %,) log(%,) ) log || %,): % square footage of land use : {residential, commercial, recreation} 99 LAND USE SMALL BLOCKS AGED BUILDINGS DENSITY VACUUMS 1 3 4 THEORY TEST 2 Ref: R. Cervero. Land-use mixing and suburban mobility. University of California Transportation Center, 1989 EFFECT: The higher, the better. 1 0
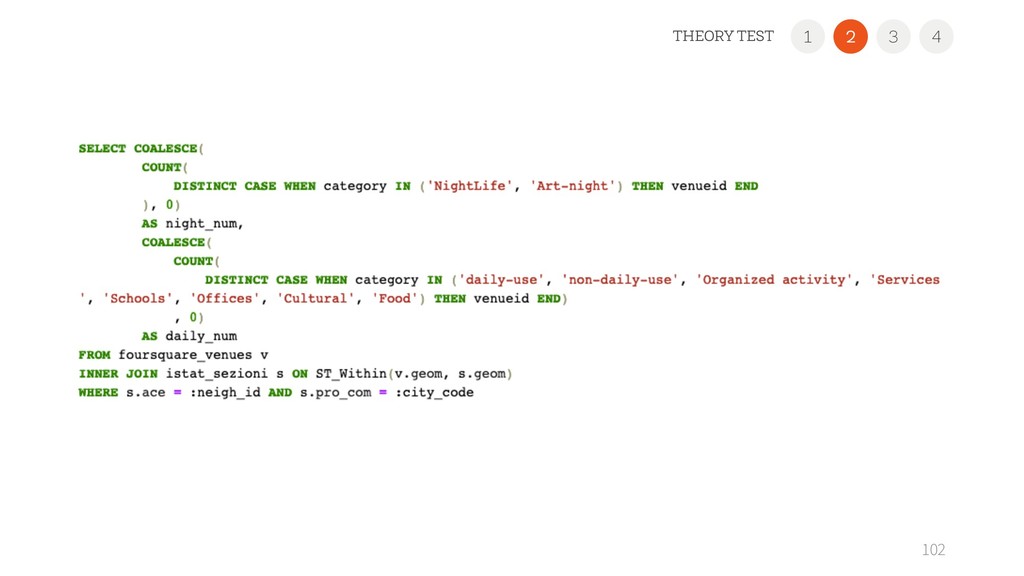
high number of peoples’ interactions For district : 1 | | ( =∈=>?@AB(%) () EFFECT: The lower, the better 103 LAND USE SMALL BLOCKS AGED BUILDINGS DENSITY VACUUMS 1 3 4 THEORY TEST 2
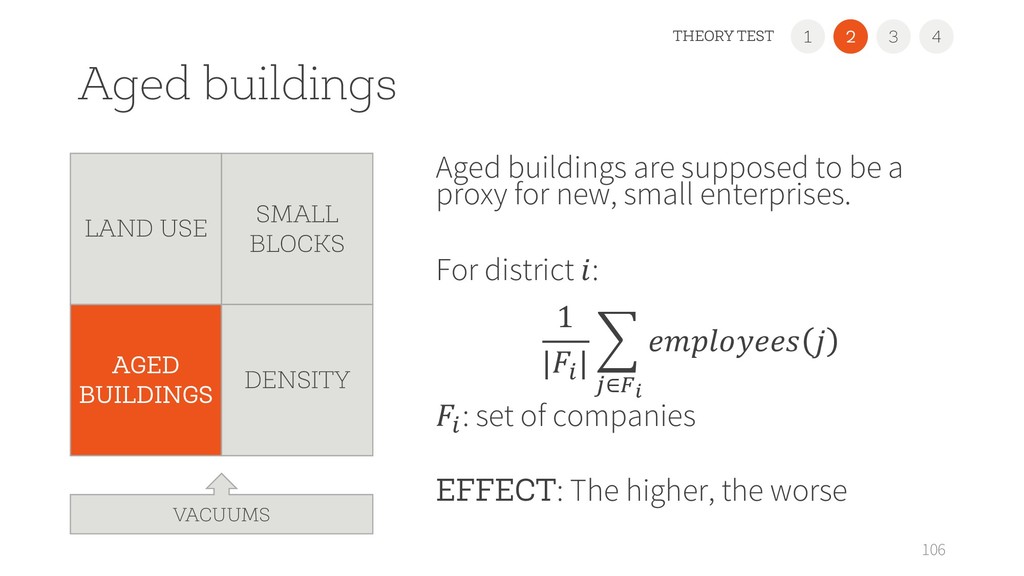
for new, small enterprises. For district : 1 |% | ( )∈GH % : set of companies EFFECT: The higher, the worse 106 LAND USE SMALL BLOCKS AGED BUILDINGS DENSITY VACUUMS 1 3 4 THEORY TEST 2
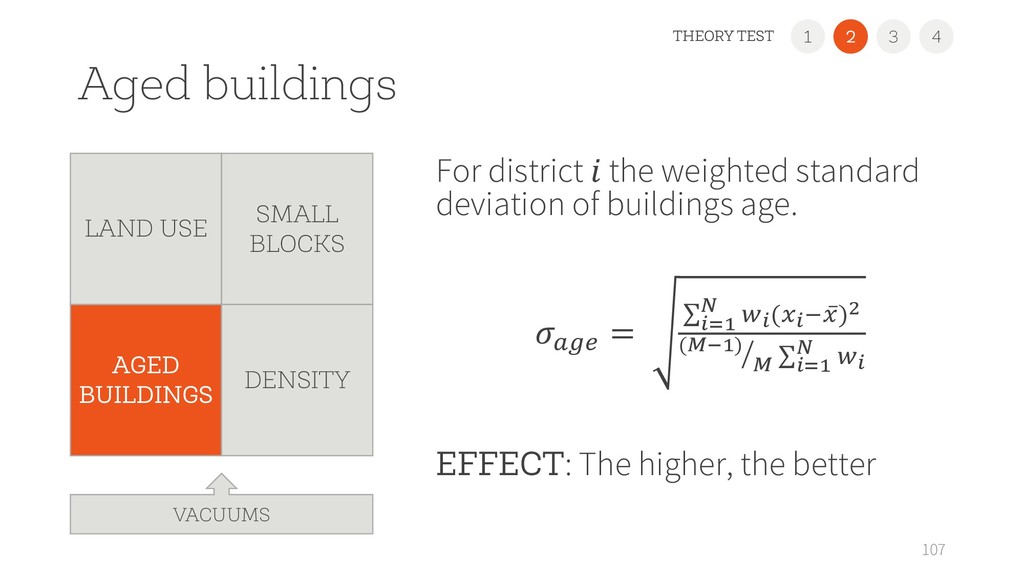
age. EFFECT: The higher, the better 107 LAND USE SMALL BLOCKS AGED BUILDINGS DENSITY VACUUMS 1 3 4 THEORY TEST 2 MNO = ∑HQR S TH(UHV ̅ U)X Y (Z[R) Z ∑HQR S TH
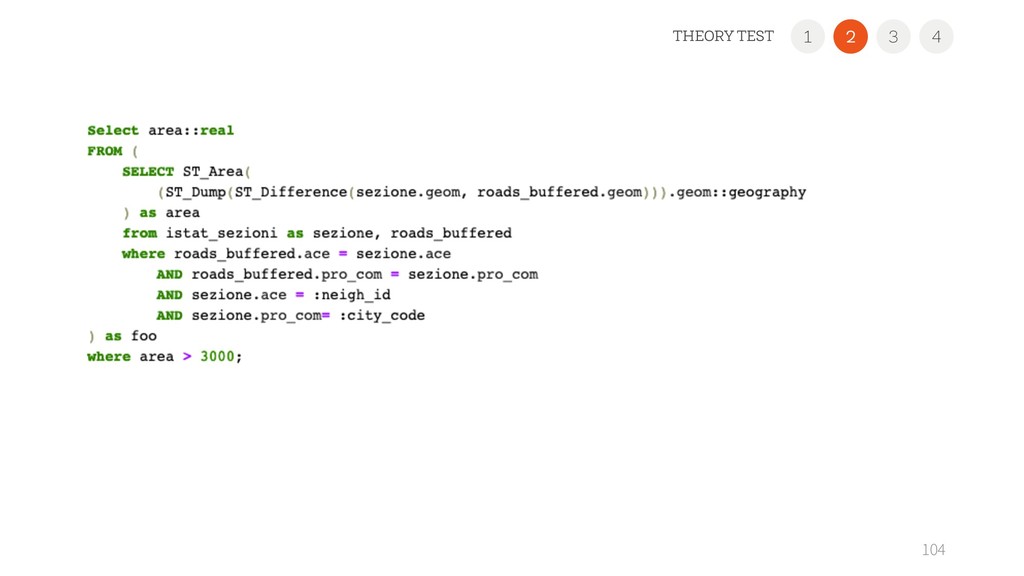
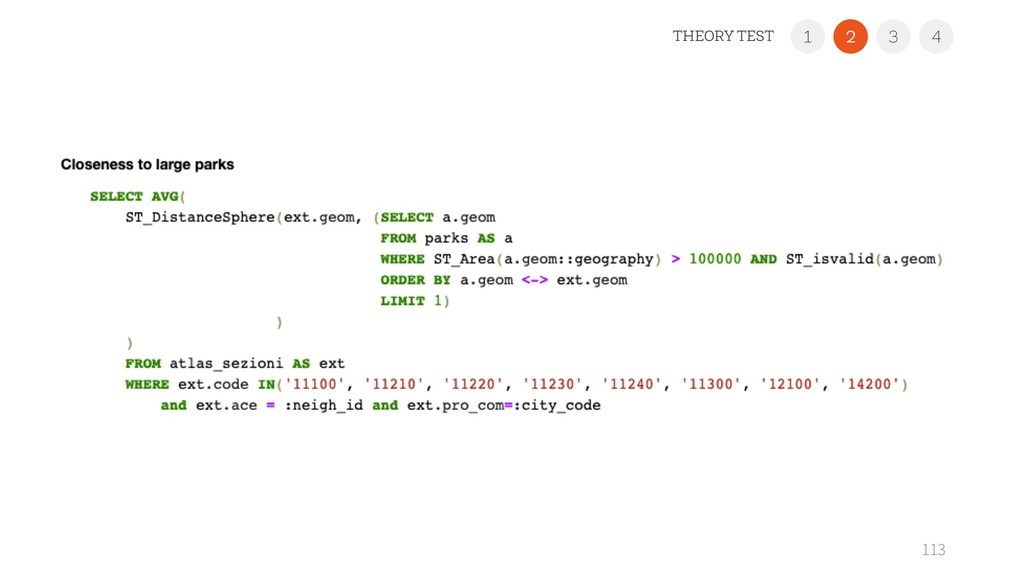
% ( )∈gH ( , , ) % : the set of the blocks : the set of parks EFFECT: The higher, the better 112 LAND USE SMALL BLOCKS AGED BUILDINGS DENSITY VACUUMS 1 3 4 THEORY TEST 2
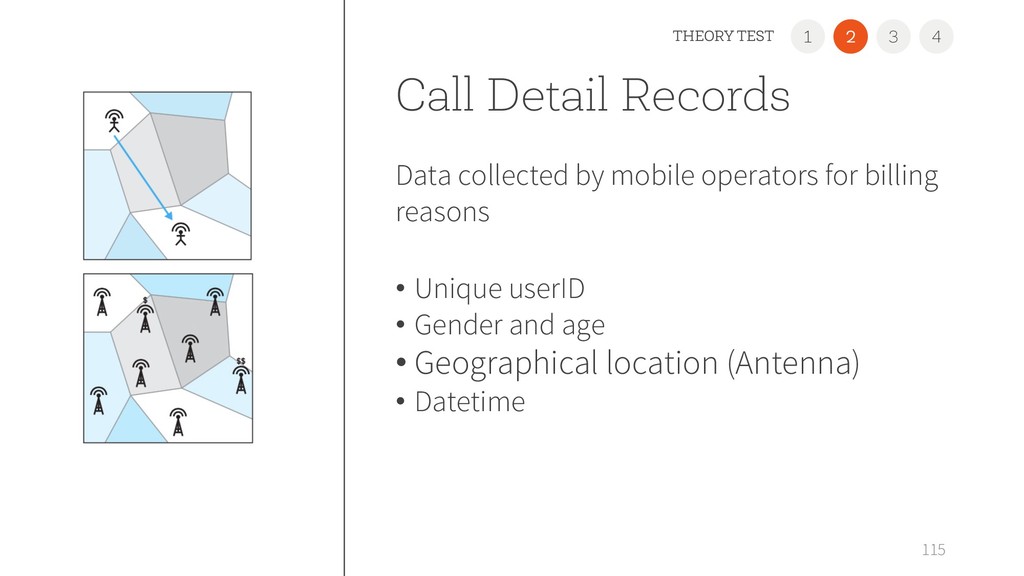
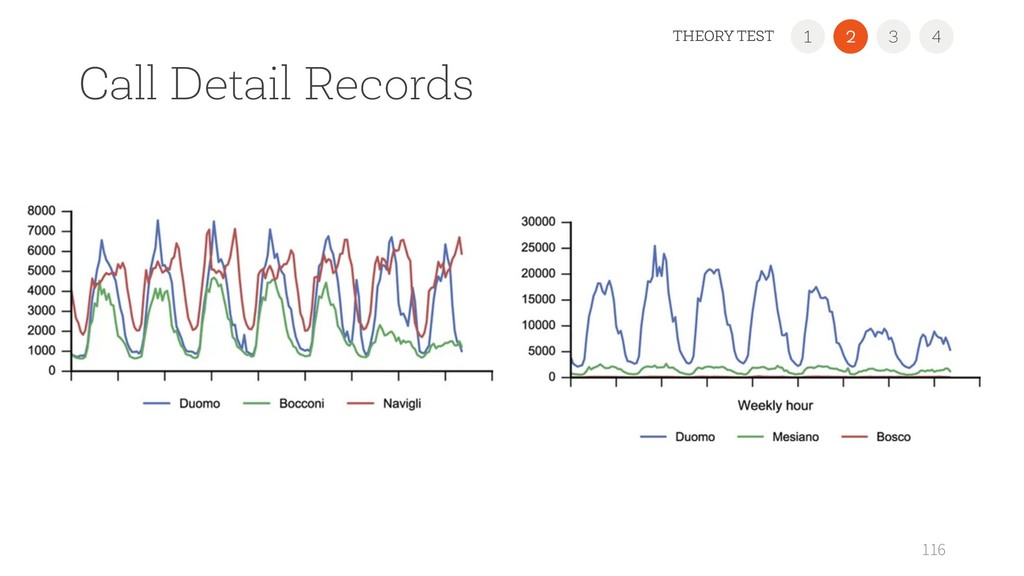
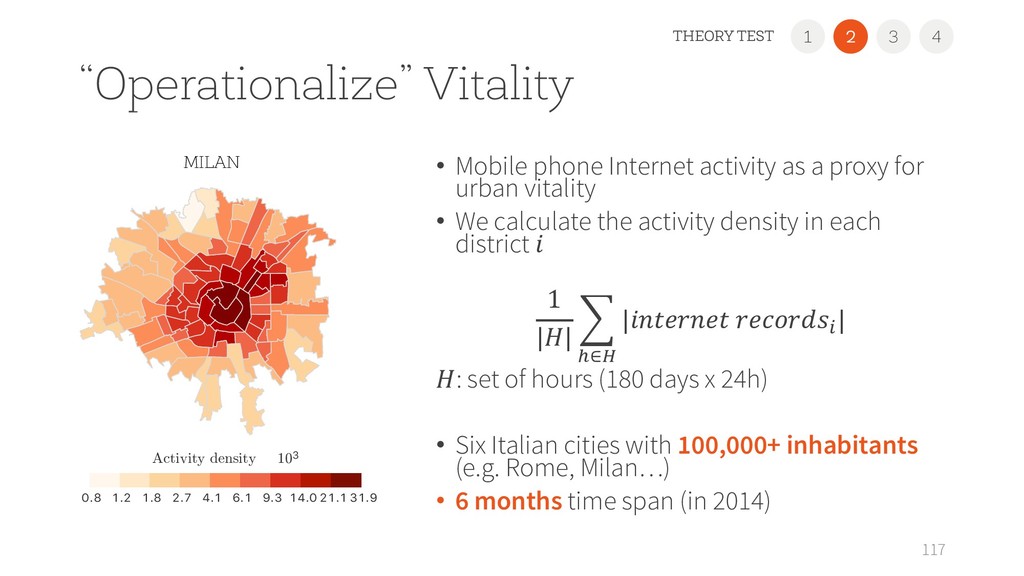
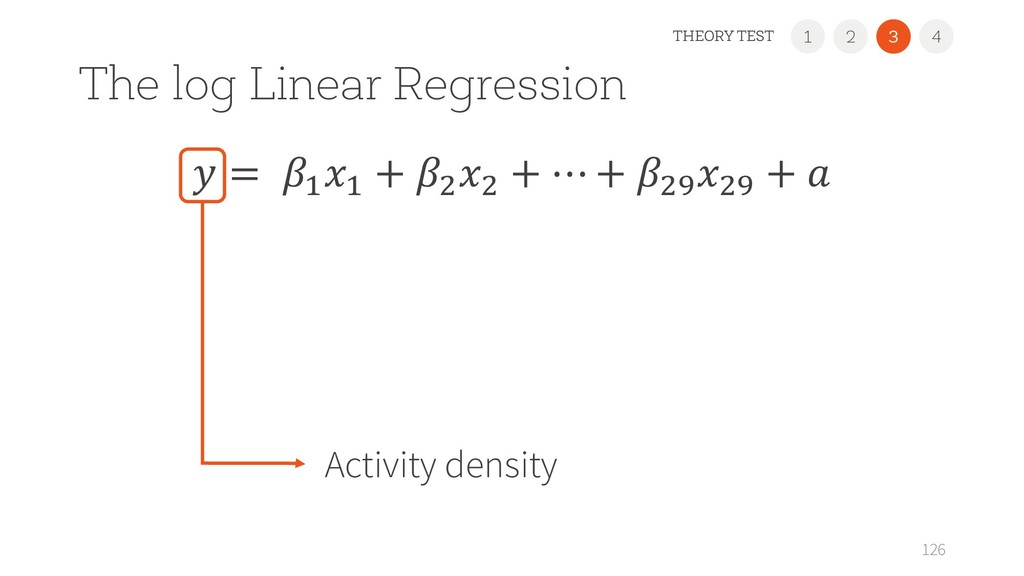
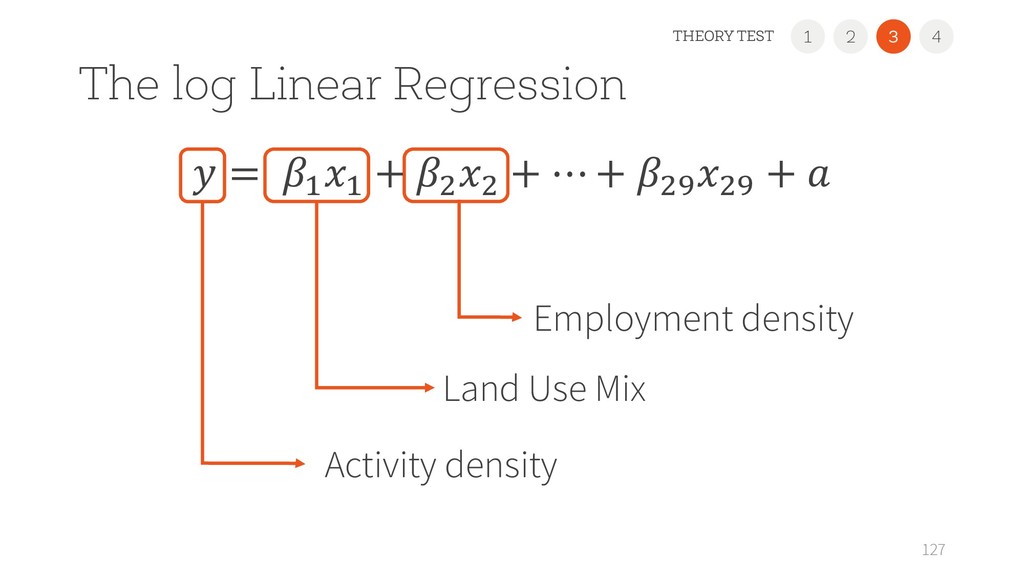
for urban vitality • We calculate the activity density in each district 1 || ( l∈m | % | : set of hours (180 days x 24h) • Six Italian cities with 100,000+ inhabitants (e.g. Rome, Milan…) • 6 months time span (in 2014) 117 0.2 0.0 0.2 0.4 0.6 0.8 1.0 Land Use Mix 0.8 1.2 1.8 2.7 4.1 6.1 9.3 14.0 21.1 31.9 Activity density ⇥ 103 ROME MILAN 0.8 1.2 1.8 2.7 4.1 6.1 9.3 14.0 21.1 31.9 Activity density 103 1 2 3 4 THEORY TEST MILAN
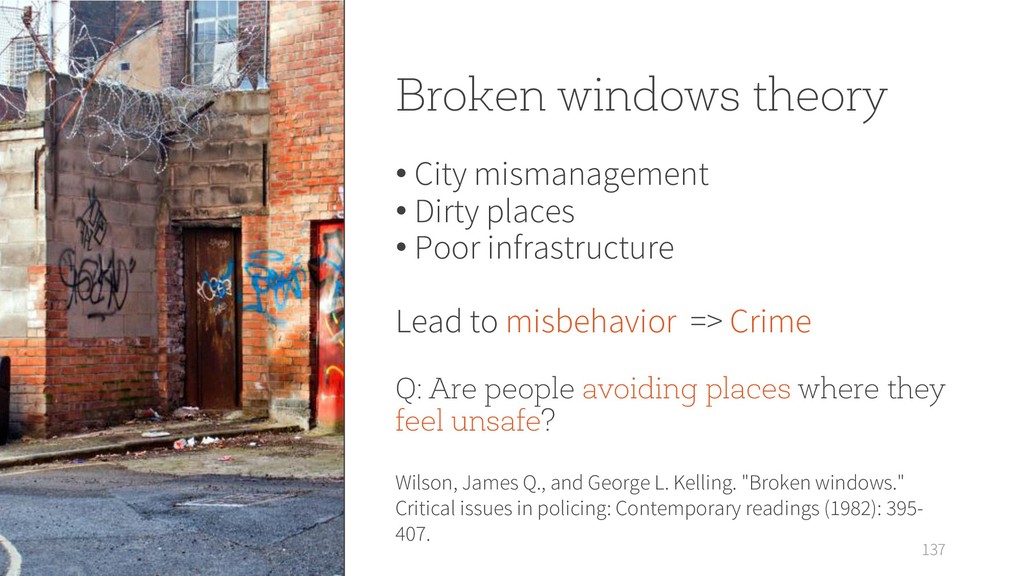
Poor infrastructure Lead to misbehavior => Crime Q: Are people avoiding places where they feel unsafe? 137 Wilson, James Q., and George L. Kelling. "Broken windows." Critical issues in policing: Contemporary readings (1982): 395- 407.
Xiao, A. Torralba, and A. Oliva. “Learning Deep Features for Scene Recognition using Places Database.” NIPS, 2014. • Learning human security perception PERCEPTION SCORE [0-10]
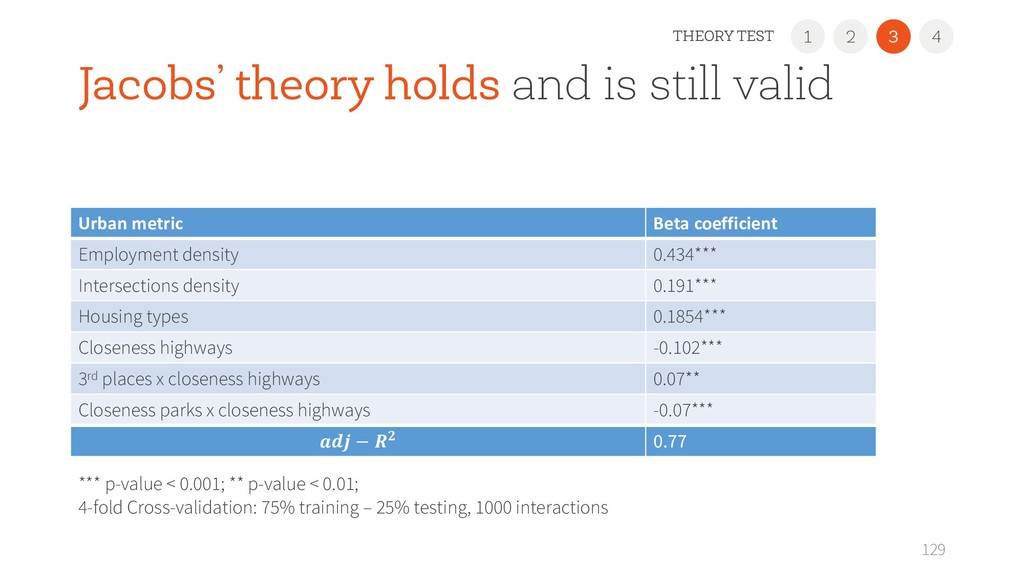
density 0.328** Deprivation -0.022 Distance from the center -0.257** Security perception 0.105** adj − Rs 0.91 ** p-value < 0.001; * p-value < 0.01; Security perception -> presence of people
![“Operationalize” Density For district : Employment density: |\]^>?_O` ^O?^>OH| MaOMH](https://files.speakerdeck.com/presentations/f4a436fd4af24011937f5f223fac360d/slide_39.jpg)