Upgrade to Pro — share decks privately, control downloads, hide ads and more …

Predicting real estate prices from the urban environment

Predicting real estate prices from the urban environment

Marco De Nadai

October 04, 2018
Tweet

More Decks by Marco De Nadai

Other Decks in Research

Transcript

  1. The economic value of neighborhoods:
    Predicting real estate prices from the urban
    environment
    MARCO DE NADAI and BRUNO LEPRI

    View Slide

  2. 2
    Let’s find a new house

    View Slide

  3. 3
    Let’s find a new house

    View Slide

  4. 4
    Let’s find a new house

    View Slide

  5. 5
    Let’s find a new house

    View Slide

  6. 6
    Let’s find a new house

    View Slide

  7. 7
    Let’s find a new house

    View Slide

  8. 8
    Let’s find a new house

    View Slide

  9. 9
    Let’s find a new house

    View Slide

  10. 10
    Let’s find a new house

    View Slide

  11. 11
    Let’s find a new house

    View Slide

  12. 12
    Let’s find a new house

    View Slide

  13. How is the housing price
    composed?

    View Slide

  14. The data
    14
    One year of listed properties in Immobiliare.it
    • 8 biggest Italian cities
    • 70,000 houses

    View Slide

  15. The property: textual features
    Textual features about the listed property
    • Number of rooms
    • Square meters
    • Energy compliance
    • Garden (yes/no)
    • etc
    15

    View Slide

  16. The property is not an island
    16

    View Slide

  17. The neighborhood
    The fundamental geographical unit for:
    • individuals’ activities
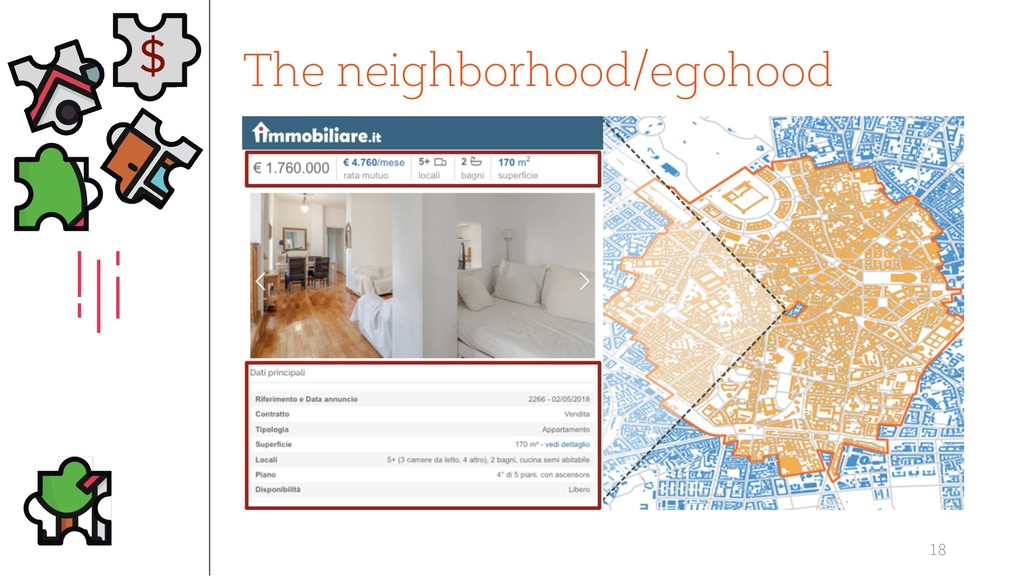
    • social interactions
    Studied in urban planning, social science,
    criminology
    Usually defined through non-overlapping
    administrative boundaries (census)
    17

    View Slide

  18. The neighborhood/egohood
    18

    View Slide

  19. The neighborhood/egohood
    19
    So what about the features?

    View Slide

  20. Neighborhood: walkability
    Walkable and pleasant neighborhoods have a
    direct impact 
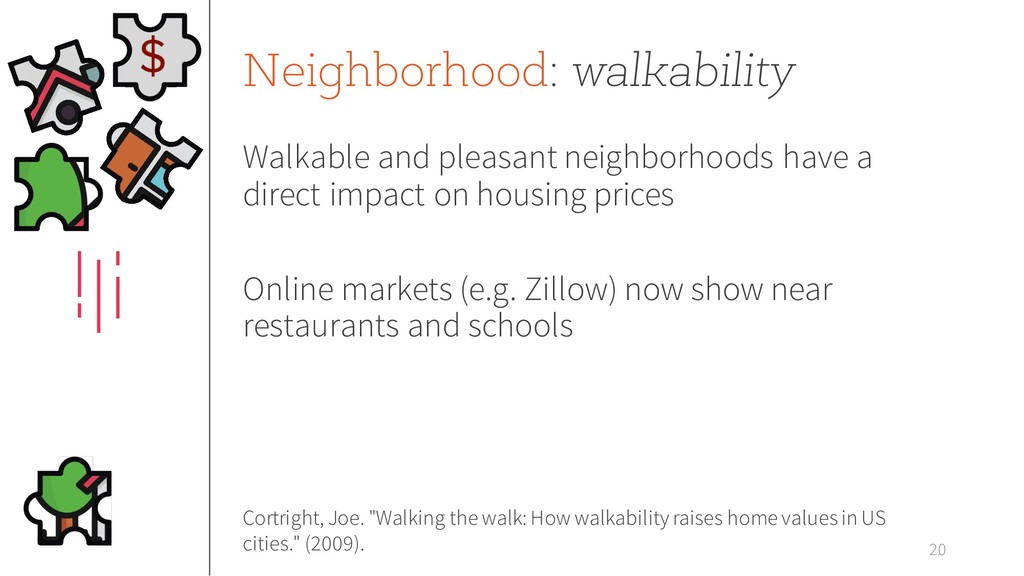
on housing prices
    Online markets (e.g. Zillow) now show near
    restaurants and schools
    20
    Cortright, Joe. "Walking the walk: How walkability raises home values in US
    cities." (2009).

    View Slide

  21. Neighborhood: walkability
    Walking distance to amenities (~ to Walkscore™)
    • Restaurants and bars (10)
    • Shops (5)
    • Schools
    • Grocery stores
    • Entertainment
    • Parks (3)
    * (n) = depth of choices
    21

    View Slide

  22. Neighborhood: walkability
    Walking distance to amenities (~ to Walkscore™)
    22

    View Slide

  23. Neighborhood: walkability
    Walking distance to amenities (~ to Walkscore™)
    We have a score of walkability for each house
    23
    0 500 1000 1500 2000
    Distance
    0.0
    0.2
    0.4
    0.6
    0.8
    1.0
    Walkability score

    View Slide

  24. Neighborhood: urban theory
    Jane Jacobs has been one of the 
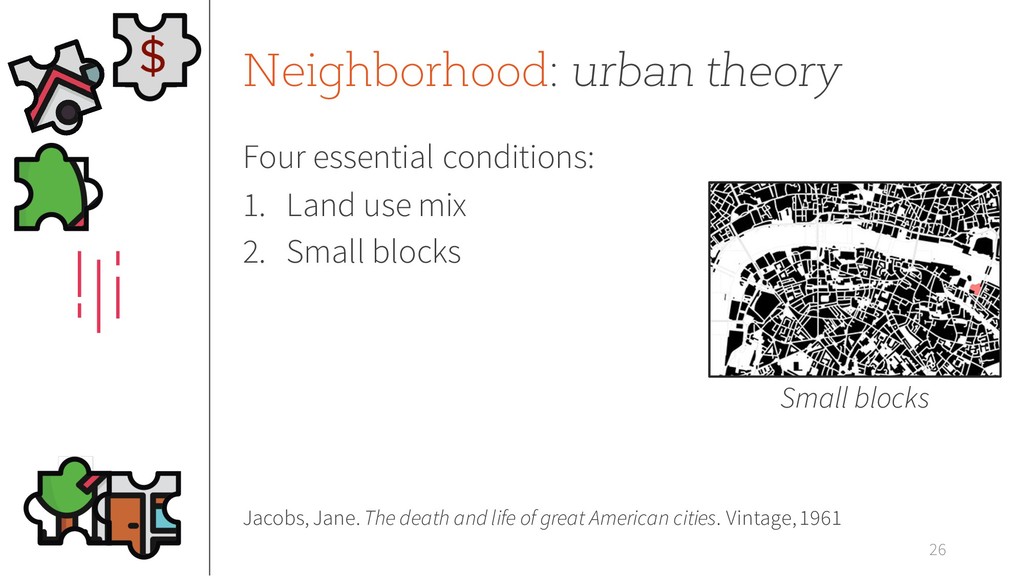
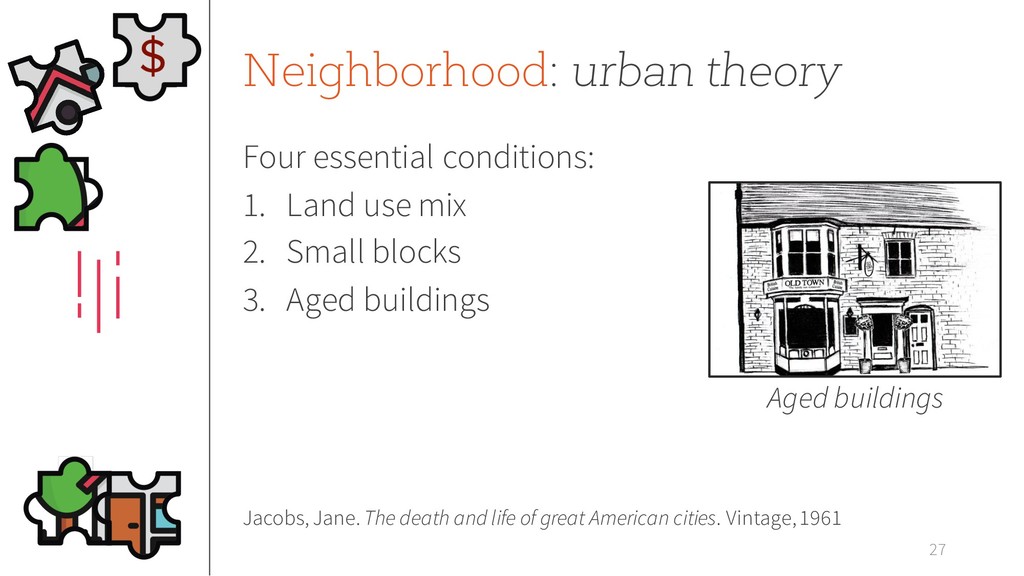
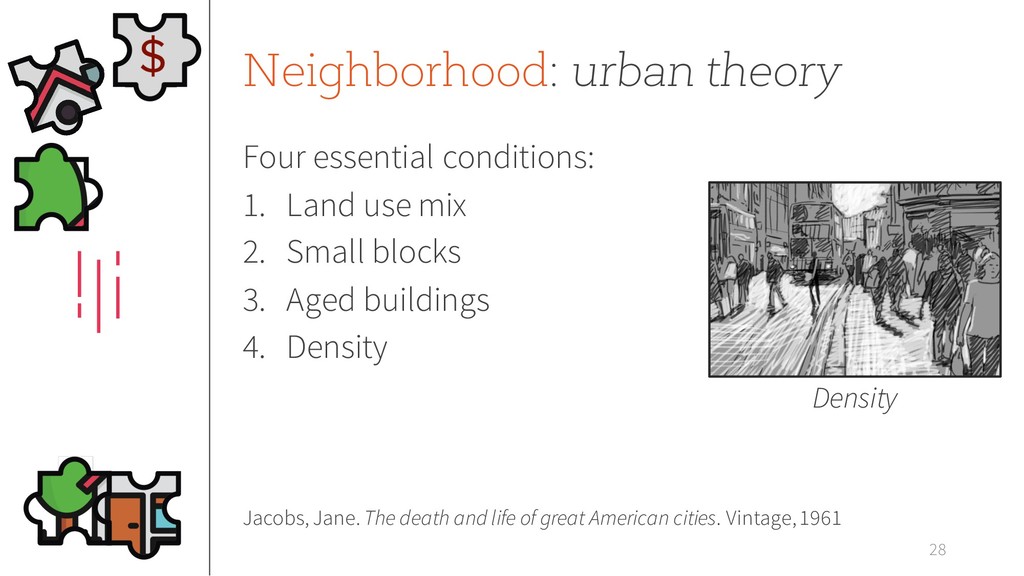
most influential
    people in urban planning
    Diversity => Urban vitality
    => Higher Housing price?
    24
    Jacobs, Jane. The death and life of great American cities. Vintage, 1961

    View Slide

  25. Neighborhood: urban theory
    Four essential conditions:
    1. Land use mix
    25
    Jacobs, Jane. The death and life of great American cities. Vintage, 1961
    Land use mix

    View Slide

  26. Neighborhood: urban theory
    Four essential conditions:
    1. Land use mix
    2. Small blocks
    26
    Jacobs, Jane. The death and life of great American cities. Vintage, 1961
    Small blocks

    View Slide

  27. Neighborhood: urban theory
    Four essential conditions:
    1. Land use mix
    2. Small blocks
    3. Aged buildings
    27
    Jacobs, Jane. The death and life of great American cities. Vintage, 1961
    Aged buildings

    View Slide

  28. Neighborhood: urban theory
    Four essential conditions:
    1. Land use mix
    2. Small blocks
    3. Aged buildings
    4. Density
    28
    Jacobs, Jane. The death and life of great American cities. Vintage, 1961
    Density

    View Slide

  29. Neighborhood: urban theory
    Four essential conditions:
    1. Land use mix
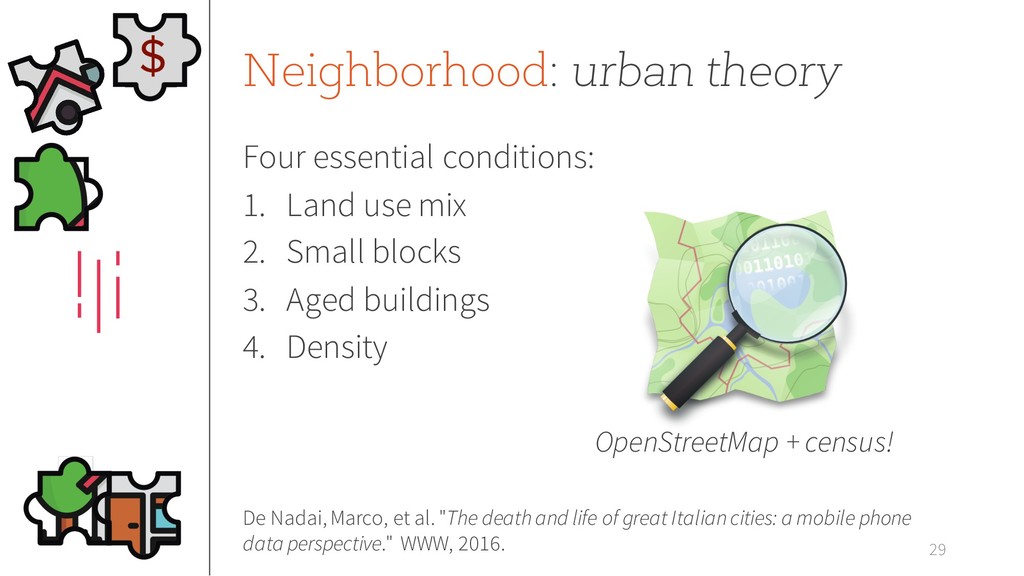
    2. Small blocks
    3. Aged buildings
    4. Density
    29
    De Nadai, Marco, et al. "The death and life of great Italian cities: a mobile phone
    data perspective." WWW, 2016.
    OpenStreetMap + census!

    View Slide

  30. Neighborhood: cultural capital
    Cultural capital influences housing prices and people
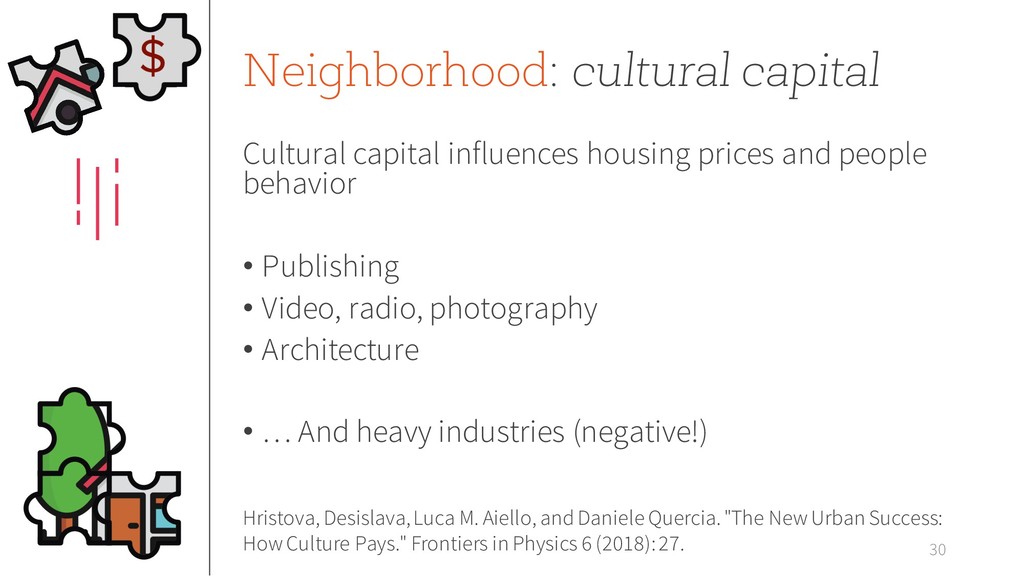
    behavior
    • Publishing
    • Video, radio, photography
    • Architecture
    • … And heavy industries (negative!)
    30
    Hristova, Desislava, Luca M. Aiello, and Daniele Quercia. "The New Urban Success:
    How Culture Pays." Frontiers in Physics 6 (2018): 27.

    View Slide

  31. Neighborhood: security perception
    31
    Which place looks more secure?

    View Slide

  32. Neighborhood: security perception
    32
    Salesses, Philip, Katja Schechtner, and César A. Hidalgo. "The collaborative image
    of the city: mapping the inequality of urban perception." PloS one 8.7 (2013)

    View Slide

  33. • Learning safety perception, learned in Milan,
    Rome
    • Predict 
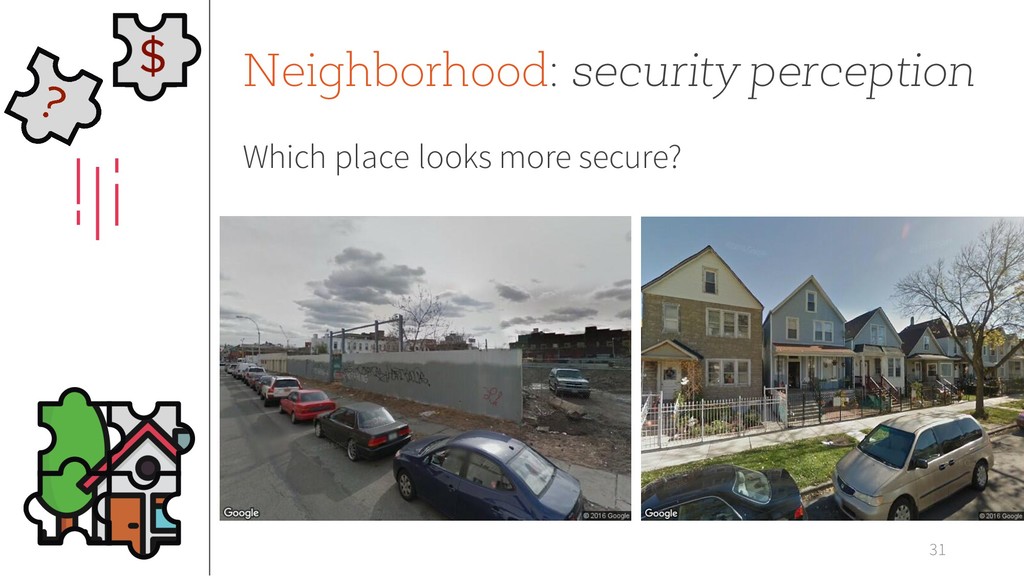
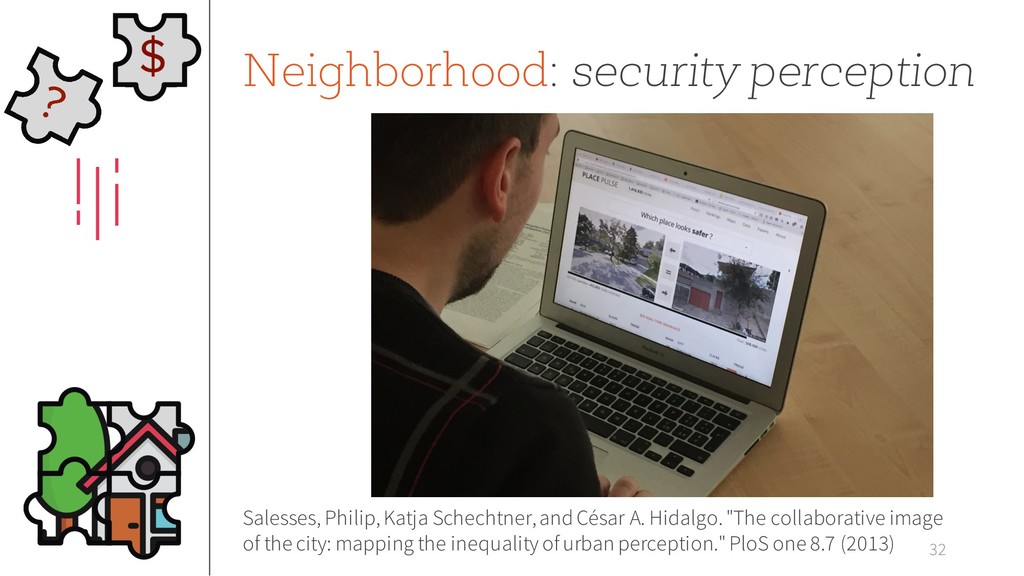
on our cities
    Neighborhood: security perception
    33
    De Nadai, Marco, et al. "Are safer looking neighborhoods more lively?: A
    multimodal investigation into urban life." ACM MM 2016.

    View Slide

  34. Neighborhood and place: together!
    34
    PLACE
    Characteristics of the
    census cell
    NEIGHBORHOOD
    Objective and subjective
    characteristics
    HOUSE
    Characteristics of the
    house

    View Slide

  35. The model

    View Slide

  36. XGBoost
    36
    = ( + )
    Neighborhood features
    (e.g. walkability)
    Property features
    (e.g. square feets)
    Housing price
    (ground truth)
    K-fold Cross-validation (with care!)
    Contiguity matrix

    View Slide

  37. 37
    Results (errors)
    Model MAE MdAPE
    Property 148, 109 23,76%

    View Slide

  38. 38
    Results (errors)
    Model MAE MdAPE
    Property 148, 109 23,76%
    Property + Neighborhood 104,586 15,44%
    THE NEIGHBORHOOD SHAPES
    PROPERTY PRICE BY ~60%!

    View Slide

  39. 39
    Global features importance

    View Slide

  40. 40
    How can we explain predictions?
    From a prediction we can go back and compute
    how each feature contributed to the prediction
    J: set of trees
    K: set of features

    View Slide

  41. 41
    Can we explain predictions?
    House in Corso Grosseto, Turin

    View Slide

  42. 42
    Can we explain predictions?
    House in Corso Grosseto, Turin
    THE MODEL IS INTERPRETABLE

    View Slide

  43. 43
    Reproducibility
    Some of the principal competitors:
    • Make use of timeless, private, data
    • Do not share data
    • Do not share code

    View Slide

  44. 44
    Reproducibility: Open model + code
    We created an “Open” model:
    • Make use only of Open data
    • Share the data
    • Share the code!
    https://github.com/denadai2/real-estate-
    neighborhood-prediction

    View Slide

  45. 45
    Results (errors)
    Model MAE MdAPE
    Property 148, 109 23,76%
    Property + Neighborhood 104, 586 15,44%
    Property + Neighborhood
    (Open)
    138, 929 18.02%
    GREAT!

    View Slide

  46. View Slide

  47. Why is it important
    47
    • We can better understand the market
    • Planning: no oasis in the desert
    • The surroundings and vitality is important
    • Responsive predictions without historical data
    • Gentrification?

    View Slide

  48. 48
    The puzzle of housing price

    View Slide

  49. Feedback time!
    @denadai2

    View Slide