Upgrade to Pro — share decks privately, control downloads, hide ads and more …

Best PhD award talk

Best PhD award talk

Talk for the Best PhD award of Marco De Nadai in Fondazione Bruno Kessler

Marco De Nadai

February 28, 2020
Tweet

More Decks by Marco De Nadai

Other Decks in Research

Transcript

  1. Marco De Nadai, supervised by Bruno Lepri and Nicu Sebe
    INTO THE CITY:
    a Multi-Disciplinary
    Investigation of Urban Life

    View Slide

  2. 2
    Cities, very difficult to explain
    Not only agglomeration of
    residents, factories, shops
    • Millions of individuals
    • Continuously evolving
    A small change generates a
    cascading throughout
    COMPLEX SYSTEM

    View Slide

  3. 3
    Cities have always been studied
    IDEAL CITY
    (XV century)
    SYSTEM
    (XIX century)
    LIVING ORGANISM
    (XX century)

    View Slide

  4. 4
    Understand cities

    View Slide

  5. 5
    Understand cities
    New data

    View Slide

  6. 6
    Understand cities
    New methods
    New data

    View Slide

  7. 7
    Describe people and places at scale
    Urban description
    1

    View Slide

  8. 8
    Describe people and places at scale
    Urban description
    1
    Urban perception
    2

    View Slide

  9. 9
    CITY
    Multi-modal approach

    View Slide

  10. 10
    CITY PEOPLE
    Multi-modal approach

    View Slide

  11. Urban description
    Q: Can we describe how people experience the city?
    1

    View Slide

  12. The theory: Jane Jacobs
    One of the most influential books 
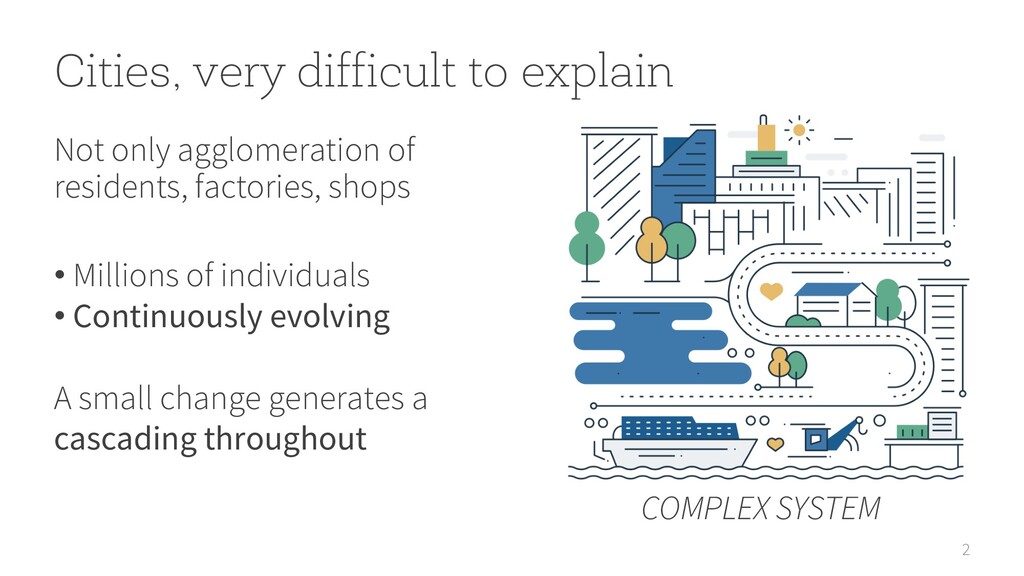
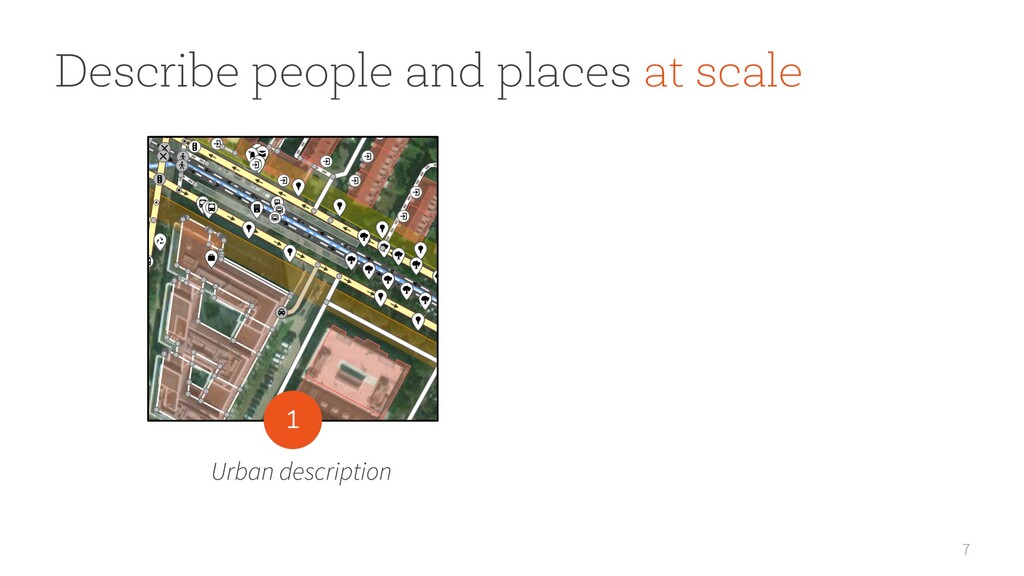
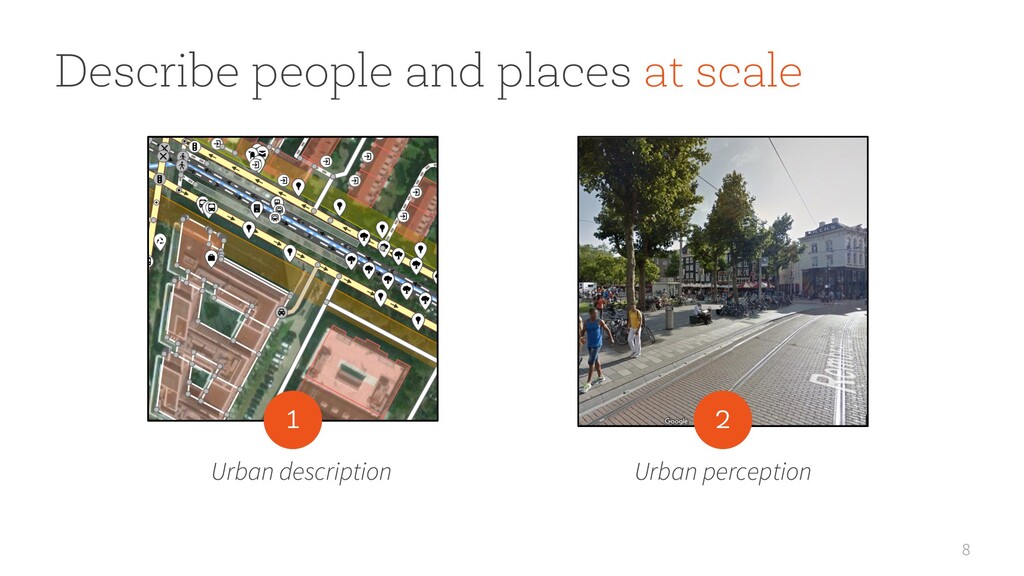
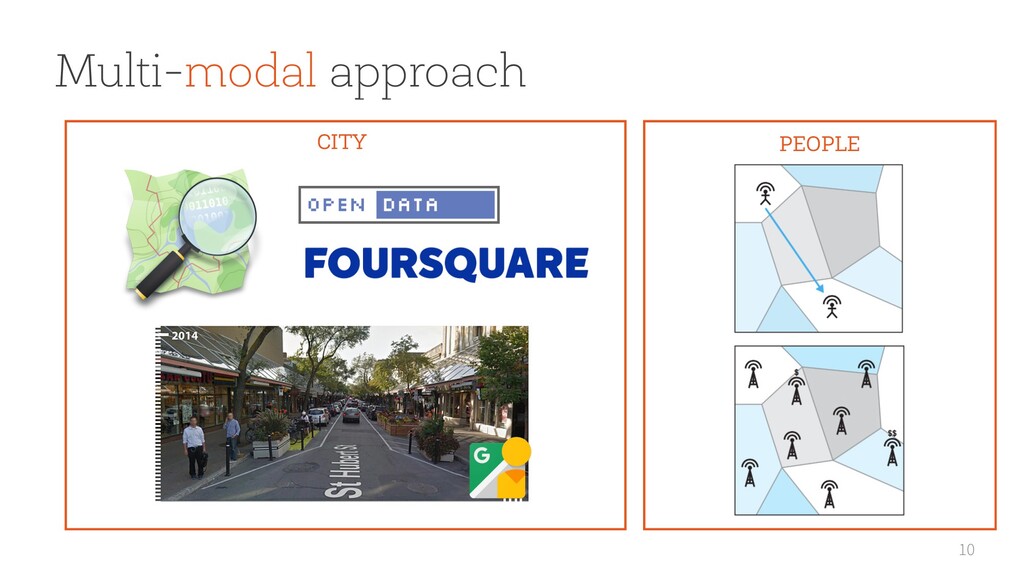
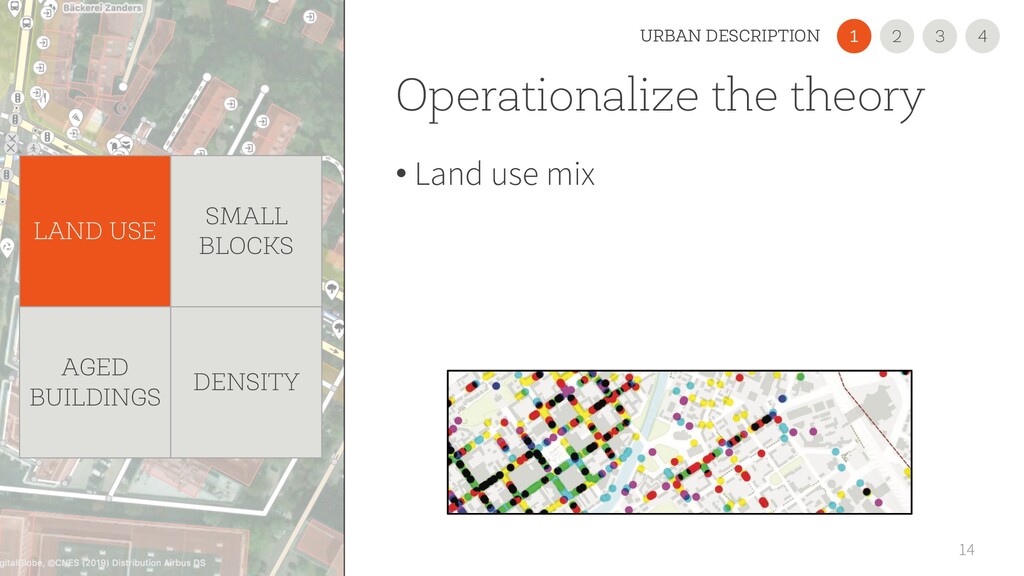
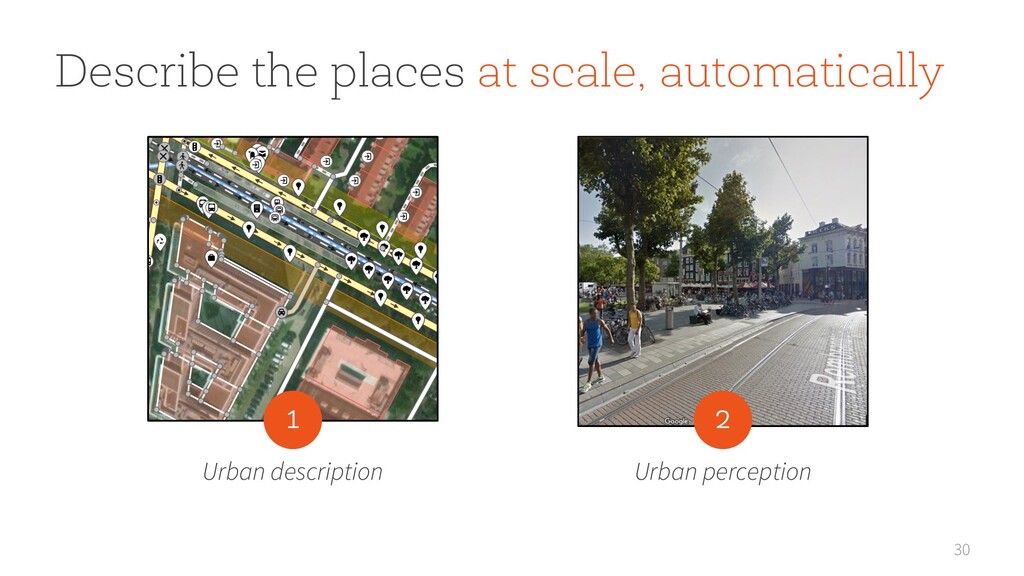
in city
    planning
    • Written in 1961
    • Not empirically tested until 2015
    • Tested in Seoul, from costly surveys
    collected in years
    • Operationalize the theory
    12
    Jacobs, Jane. The death and life of great American cities.
    Vintage, 1961
    2
    1 3 4
    URBAN DESCRIPTION

    View Slide

  13. The theory: Jane Jacobs
    Diversity of built environment
    Urban vitality
    There are 4 diversity conditions
    13
    LAND USE
    SMALL
    BLOCKS
    AGED
    BUILDINGS
    DENSITY
    2
    1 3 4
    URBAN DESCRIPTION

    View Slide

  14. Operationalize the theory
    • Land use mix
    14
    LAND USE
    SMALL
    BLOCKS
    AGED
    BUILDINGS
    DENSITY
    2
    1 3 4
    URBAN DESCRIPTION

    View Slide

  15. Operationalize the theory
    • Land use mix
    15
    For district :
    %
    = − (
    )∈+
    %,)
    log(%,)
    )
    log ||
    %,)
    : % square footage of land use
    : {residential, commercial, recreation}
    LAND USE
    SMALL
    BLOCKS
    AGED
    BUILDINGS
    DENSITY
    2
    1 3 4
    URBAN DESCRIPTION

    View Slide

  16. Operationalize the theory
    • Small blocks
    |%
    |
    %
    16
    LAND USE
    SMALL
    BLOCKS
    AGED
    BUILDINGS
    DENSITY
    2
    1 3 4
    URBAN DESCRIPTION

    View Slide

  17. Operationalize the theory
    • Aged buildings:
    17
    @AB
    = ∑DEF
    G HD(IDJ ̅
    I)L
    M
    (NOF)
    N
    ∑DEF
    G HD
    =
    LAND USE
    SMALL
    BLOCKS
    AGED
    BUILDINGS
    DENSITY
    2
    1 3 4
    URBAN DESCRIPTION

    View Slide

  18. Operationalize the theory
    18
    LAND USE
    SMALL
    BLOCKS
    AGED
    BUILDINGS
    DENSITY
    2
    1 3 4
    Employment density:
    |PQRSTUBV RBTRSBD|
    @WB@D
    Population density:
    |XTRYS@Z%T[D|
    @WB@D
    URBAN DESCRIPTION

    View Slide

  19. What is vitality?
    • Defined in various (fuzzy) ways in
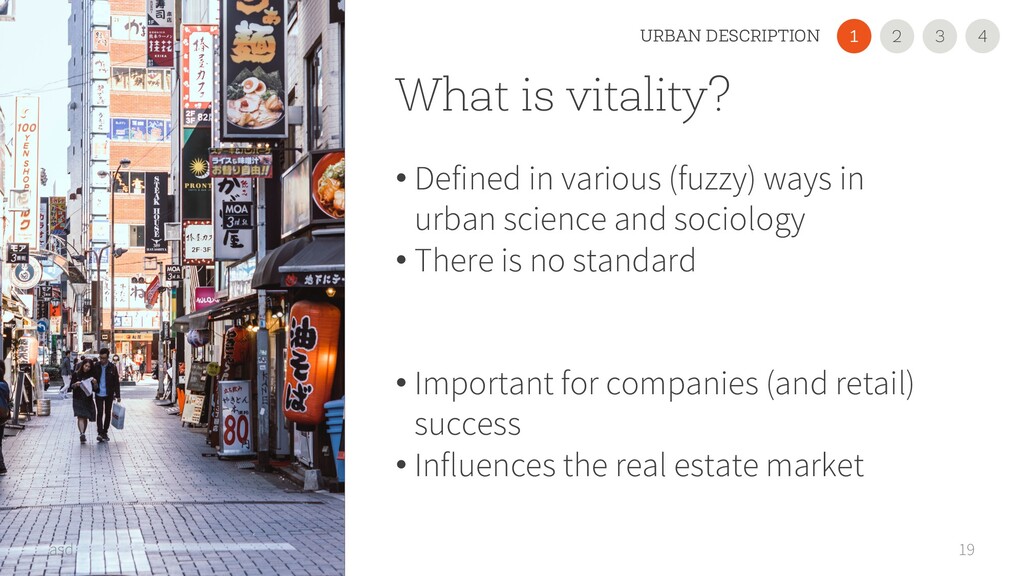
    urban science and sociology
    • There is no standard
    • Important for companies (and retail)
    success
    • Influences the real estate market
    19
    asd
    2
    1 3 4
    URBAN DESCRIPTION

    View Slide

  20. Vitality (empirical)
    • Call detail records, collected by
    mobile operators 
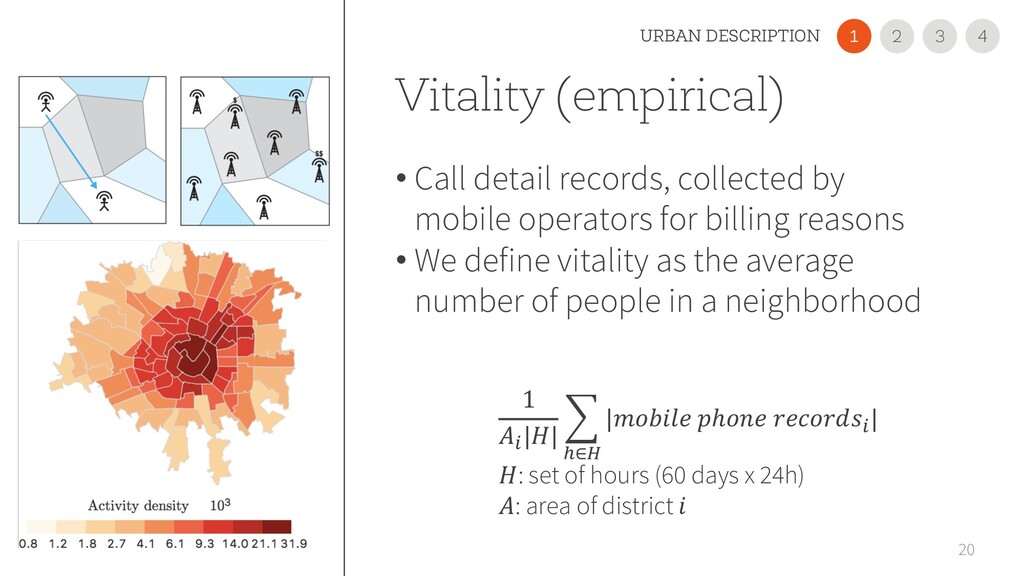
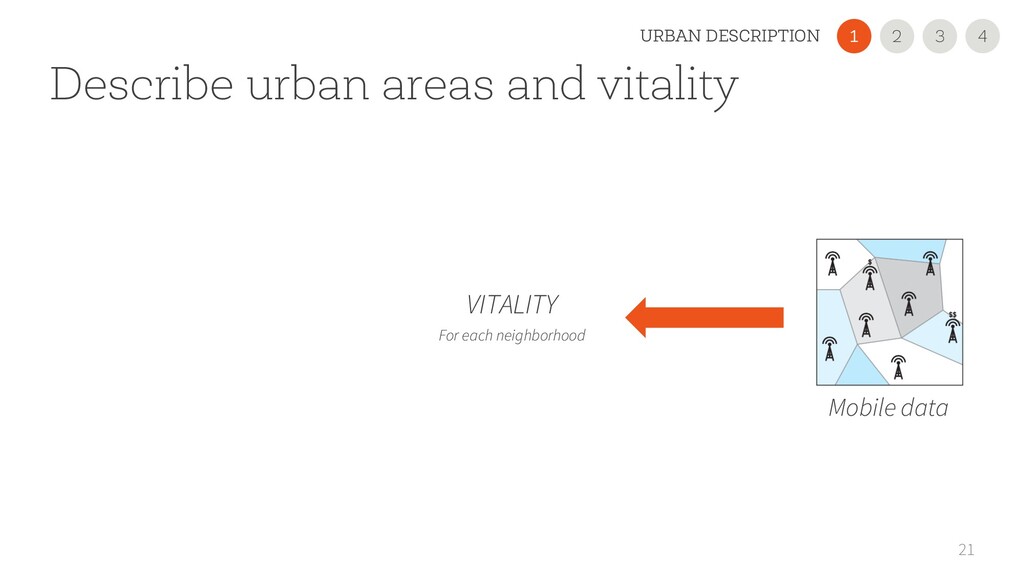
for billing reasons
    • We define vitality as the average
    number of people in a neighborhood
    20
    1
    %
    ||
    (
    _∈`
    | ℎ %
    |
    : set of hours (60 days x 24h)
    : area of district
    2
    1 3 4
    URBAN DESCRIPTION

    View Slide

  21. Describe urban areas and vitality
    21
    VITALITY
    For each neighborhood
    Mobile data
    2
    1 3 4
    URBAN DESCRIPTION

    View Slide

  22. Describe urban areas and vitality
    22
    People + Companies
    GIS
    Predictive
    model
    VITALITY
    For each neighborhood
    Mobile data
    2
    1 3 4
    URBAN DESCRIPTION
    • 6 Italian cities

    View Slide

  23. 23
    Urban description
    1
    We can predict vitality
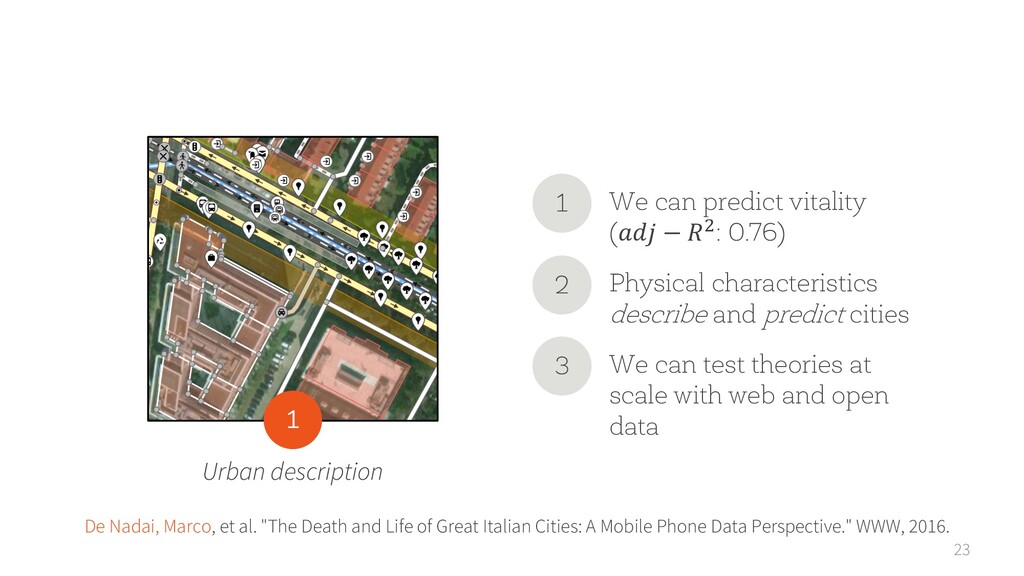
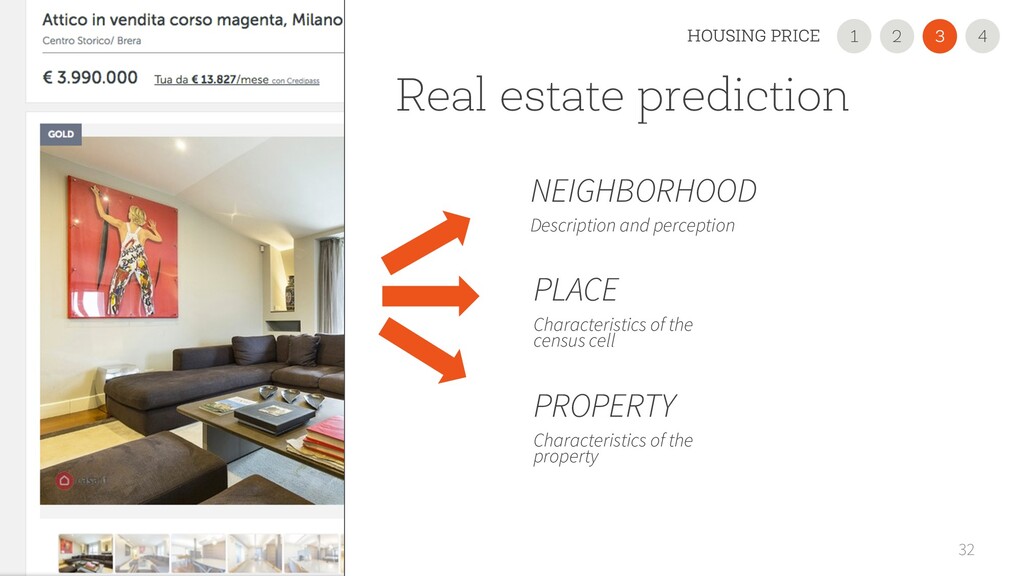
    ( − h: 0.76)
    1
    Physical characteristics
    describe and predict cities
    2
    We can test theories at
    scale with web and open
    data
    3
    De Nadai, Marco, et al. "The Death and Life of Great Italian Cities: A Mobile Phone Data Perspective." WWW, 2016.

    View Slide

  24. Urban perception
    Q: Can we link urban visual perception with the behavior of
    people at scale?
    2

    View Slide

  25. Broken windows theory
    • City mismanagement
    • Dirty places
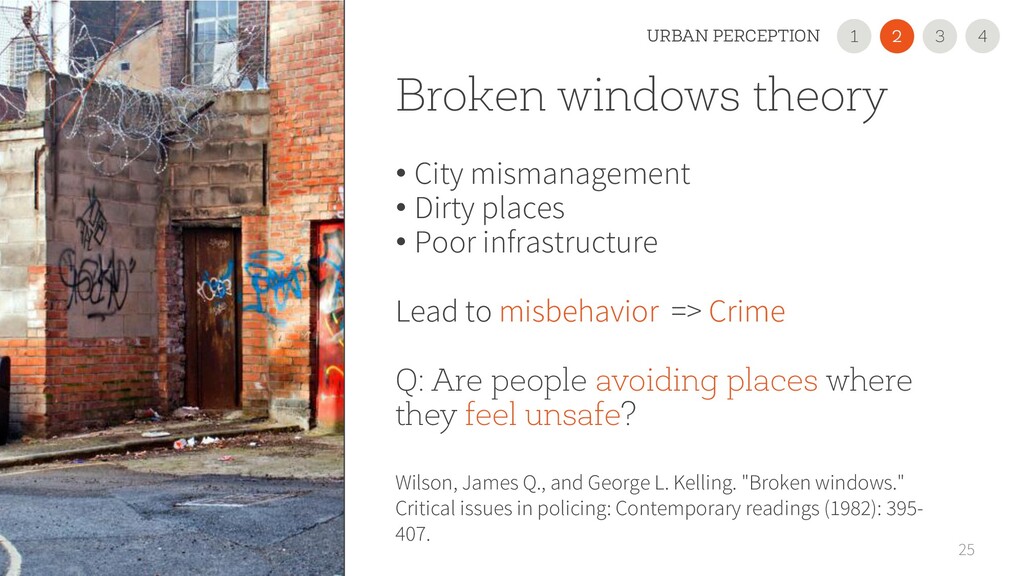
    • Poor infrastructure
    Lead to misbehavior => Crime
    Q: Are people avoiding places where
    they feel unsafe?
    25
    Wilson, James Q., and George L. Kelling. "Broken windows."
    Critical issues in policing: Contemporary readings (1982): 395-
    407.
    2
    1 3
    URBAN PERCEPTION 4

    View Slide

  26. 26
    Urban perception from Place Pulse
    Salesses, P., Schechtner, K., & Hidalgo, C. A. (2013). The collaborative image of the city: mapping the inequality of urban
    perception. PloS one
    2
    1 3
    URBAN PERCEPTION 4

    View Slide

  27. 27
    Security perception prediction
    * B. Zhou, A. Lapedriza, J. 
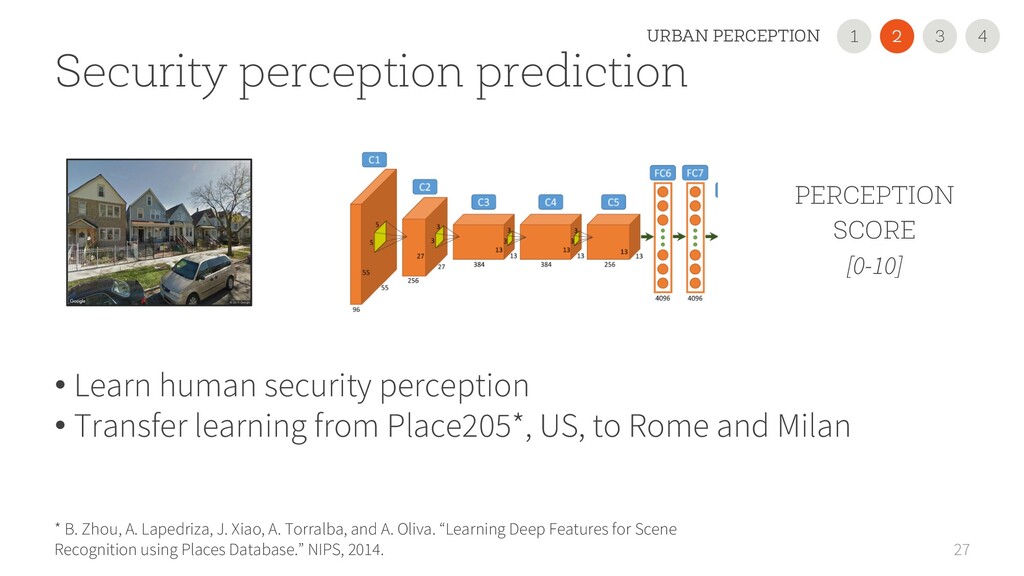
Xiao, A. Torralba, and A. Oliva. “Learning Deep Features for Scene
    Recognition using Places Database.” NIPS, 2014.
    • Learn human security perception
    • Transfer learning from Place205*, US, to Rome and Milan
    PERCEPTION
    SCORE
    [0-10]
    2
    1 3
    URBAN PERCEPTION 4

    View Slide

  28. 28
    2
    1 3
    URBAN PERCEPTION 4
    Describe security perception
    Security perception
    Vitality
    Regression model

    View Slide

  29. 29
    Urban perception
    2
    We can predict presence
    of people 
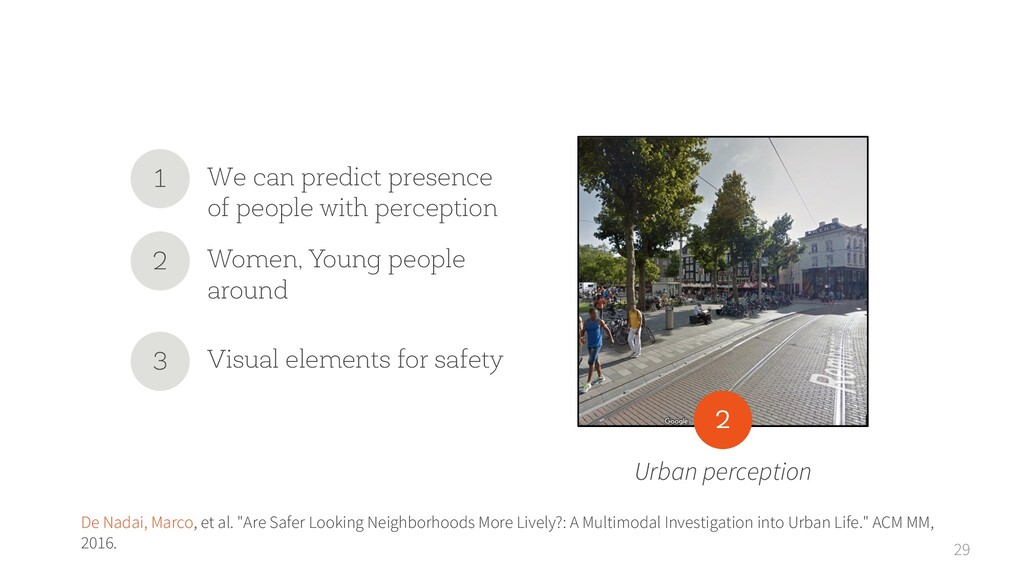
with perception
    1
    Women, Young people
    around
    2
    Visual elements for safety
    3
    De Nadai, Marco, et al. "Are Safer Looking Neighborhoods More Lively?: A Multimodal Investigation into Urban Life." ACM MM,
    2016.

    View Slide

  30. 30
    Describe the places at scale, automatically
    Urban description
    1
    Urban perception
    2

    View Slide

  31. 31

    View Slide

  32. Real estate prediction
    32
    PLACE
    Characteristics of the
    census cell
    NEIGHBORHOOD
    Description and perception
    PROPERTY
    Characteristics of the
    property
    2
    1 3
    HOUSING PRICE 4

    View Slide

  33. Real estate prediction
    33
    2
    1 3
    HOUSING PRICE 4
    The neighborhood features are very
    important
    1
    Predictions improved by ~ 60%
    2

    View Slide

  34. Crime prediction
    34
    PLACE
    Characteristics of the
    census cell
    NEIGHBORHOOD
    Description and perception
    MOBILITY
    Mobility of people
    from mobile phones
    2
    1 3
    CRIME 4
    • Bogota, Boston, Los Angeles, Chicago

    View Slide

  35. Crime prediction
    35
    CRIME
    We accurately describe crime only when
    we consider people + place + mobility
    1
    The built environment plays
    different roles, but it is important
    to describe crime
    2
    2
    1 3 4

    View Slide

  36. 36

    View Slide

  37. Why does it matter?
    37
    • DATA MINING
    • Inexpensive 
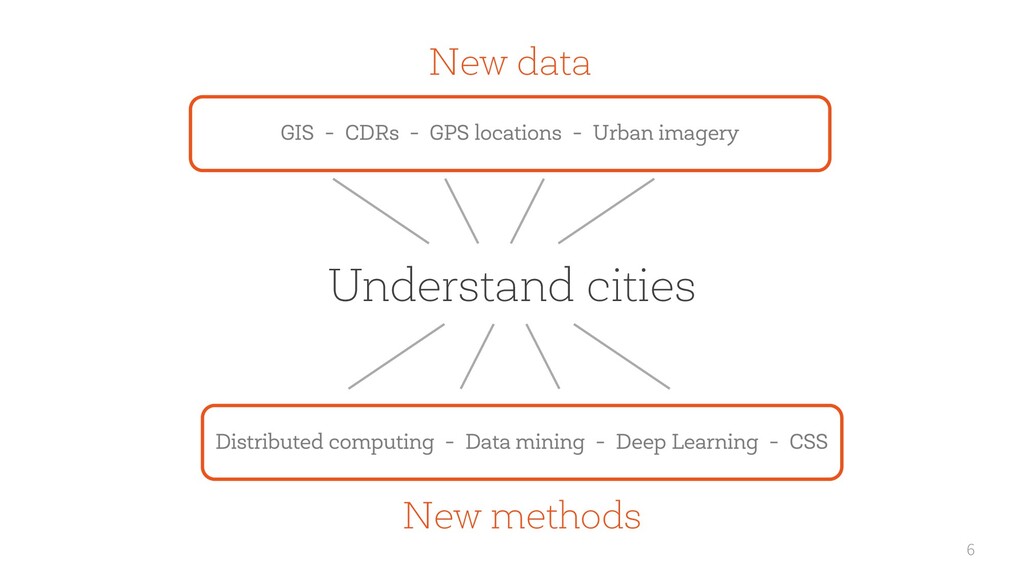
way to understand urban mechanisms;
    • New stimulus to social research;
    • Deep understanding of city life through multi-modal data
    • Urban science at scale

    View Slide

  38. 38
    Next steps
    DATA DRIVEN APPROACH: let the data speak
    STREET VIEW
    IMAGERY
    AERIAL
    IMAGERY
    + NEIGHBORHOOD
    OUTCOMES
    (CRIME,
    VITALITY…)

    View Slide

  39. 39
    Next steps
    GENERATIVE MODELS FOR URBAN PLANNING
    CRIME
    VITALITY
    HOUSING PRICE
    PREDICT
    GENERATE?
    NEIGHBORHOOD
    OUTCOMES
    AERIAL + STREET VIEW
    IMAGERY

    View Slide

  40. STEFAN
    DRAGICEVIC
    LETOUZE’
    EMMANUEL
    DANIELE QUERCIA
    MARTA C.
    GONZALEZ
    CESAR A.
    HIDALGO
    JACOPO STAIANO
    NICU SEBE
    BRUNO LEPRI
    ROBERTO
    LARCHER
    SANDY PENTLAND
    GLORIA ZEN
    XU YANYAN
    RADU L. VIERIU
    NIKHIL NAIK THANKS

    View Slide

  41. 41
    Thank you FBK!
    Urban vitality
    1 4
    2 3
    Application usage Global
    urbanization
    Unsupervised
    Image to Image
    Translation
    …and if you are bored, learn more about:
    http://www.marcodena.it

    View Slide