Upgrade to Pro — share decks privately, control downloads, hide ads and more …

Analyzing Urban Vitality at scale: PhD defense 2019

Analyzing Urban Vitality at scale: PhD defense 2019

Marco De Nadai

May 22, 2019
Tweet

More Decks by Marco De Nadai

Other Decks in Research

Transcript

  1. Marco De Nadai, supervised by Bruno Lepri and Nicu Sebe

    INTO THE CITY: a Multi-Disciplinary Investigation of Urban Life
  2. 2 Cities, very difficult to explain Not only agglomeration of

    residents, factories, shops • Millions of individuals • Continuously evolving A small change generates a cascading throughout COMPLEX SYSTEM
  3. 3 Cities have always been studied IDEAL CITY (XV century)

    SYSTEM (XIX century) LIVING ORGANISM (XX century)
  4. The theory: Jane Jacobs One of the most influential books

    in city planning • planning models that dominated mid- century planning • Melbourne, Toronto etc. 9 Klemek, C. (2011) ‘Dead or Alive at Fifty? Reading Jane Jacobs on her Golden Anniversary’ Dissent, Vol. 58, No. 2, 75–79. 2 1 3 URBAN DESCRIPTION 4
  5. The theory: Jane Jacobs • Written in 1961 • Not

    empirically tested until 2015 • Tested in Seoul, from costly surveys collected in years • Operationalize the theory 10 Jacobs, Jane. The death and life of great American cities. Vintage, 1961 2 1 3 4 URBAN DESCRIPTION
  6. The theory: Jane Jacobs The theory says that: • Death:

    caused by the elimination of pedestrian activity • Life: created by a vital urban fabric at all times of the day 11 Jacobs, Jane. The death and life of great American cities. Vintage, 1961 2 1 3 4 URBAN DESCRIPTION
  7. The theory: Jane Jacobs Diversity => Urban vitality There are

    4 diversity conditions 12 LAND USE SMALL BLOCKS AGED BUILDINGS DENSITY 2 1 3 4 URBAN DESCRIPTION
  8. Operationalize the theory • Land use mix 13 For district

    : % = − ( )∈+ %,) log(%,) ) log || %,) : % square footage of land use : {residential, commercial, recreation} LAND USE SMALL BLOCKS AGED BUILDINGS DENSITY 2 1 3 4 URBAN DESCRIPTION
  9. Operationalize the theory • Small blocks |% | % 14

    LAND USE SMALL BLOCKS AGED BUILDINGS DENSITY 2 1 3 4 URBAN DESCRIPTION
  10. Operationalize the theory • Aged buildings: 15 @AB = ∑DEF

    G HD(IDJ ̅ I)L M (NOF) N ∑DEF G HD = LAND USE SMALL BLOCKS AGED BUILDINGS DENSITY 2 1 3 4 URBAN DESCRIPTION
  11. Operationalize the theory 16 LAND USE SMALL BLOCKS AGED BUILDINGS

    DENSITY 2 1 3 4 Employment density: |PQRSTUBV RBTRSBD| @WB@D Population density: |XTRYS@Z%T[D| @WB@D URBAN DESCRIPTION
  12. Operationalize the theory • 6 Italian cities • Features to

    describe the Jane Jacobs theory 17 2 1 3 4 URBAN DESCRIPTION
  13. What is vitality? • Defined in various (fuzzy) ways in

    urban science and sociology • There is no standard • Key asset for urban spaces • Important for companies (and retail) success • Influences the real estate market 18 asd 2 1 3 4 URBAN DESCRIPTION
  14. Call Detail Records Data collected by mobile operators for billing

    reasons • Unique userID • Gender and age • Geographical location (Antenna) • Datetime 19 2 1 3 4 URBAN DESCRIPTION
  15. Vitality (empirical) • Define areas • We define vitality as

    the average number of people in a neighborhood 20 1 % || ( _∈` | ℎ % | : set of hours (60 days x 24h) : area of district 2 1 3 4 URBAN DESCRIPTION
  16. Describe urban areas and vitality 22 People + Companies GIS

    VITALITY For each neighborhood Mobile data 2 1 3 4 URBAN DESCRIPTION
  17. Describe urban areas and vitality 23 People + Companies GIS

    Predictive model VITALITY For each neighborhood Mobile data 2 1 3 4 URBAN DESCRIPTION
  18. The log Linear Regression model 24 Vitality (Ground truth) Land

    Use Mix Employment density = i i + l l + ⋯ + [ [ + 2 1 3 4 URBAN DESCRIPTION
  19. 25 Urban metric Standardized Beta coefficient Employment density 0.434*** Intersections

    density 0.191*** Housing types 0.185*** Closeness highways -0.102*** 3rd places x closeness highways 0.07** Closeness parks x closeness highways -0.07*** adj − Rl 0.77 *** p-value < 0.001; ** p-value < 0.01; Describe urban vitality 2 1 3 4 URBAN DESCRIPTION
  20. Take home 26 De Nadai, Marco, et al. "The Death

    and Life of Great Italian Cities: A Mobile Phone Data Perspective." WWW, 2016. Physical characteristics describe and predict urban vitality 2 1 3 4 URBAN DESCRIPTION
  21. Broken windows theory • City mismanagement • Dirty places •

    Poor infrastructure Lead to misbehavior => Crime Q: Are people avoiding places where they feel unsafe? 28 Wilson, James Q., and George L. Kelling. "Broken windows." Critical issues in policing: Contemporary readings (1982): 395- 407. 2 1 3 URBAN PERCEPTION 4
  22. 29 Urban perception from Place Pulse Salesses, P., Schechtner, K.,

    & Hidalgo, C. A. (2013). The collaborative image of the city: mapping the inequality of urban perception. PloS one 2 1 3 URBAN PERCEPTION 4
  23. 30 … 1 10 Place Pulse • New York •

    Boston • Linz • Salzburg Place Pulse 2 • Rome • Milan PROBLEM: • Few images per neighborhood • Few labels per image 2 1 3 URBAN PERCEPTION 4 Safety perception: MIT Place Pulse
  24. 31 Security perception prediction * B. Zhou, A. Lapedriza, J.

    Xiao, A. Torralba, and A. Oliva. “Learning Deep Features for Scene Recognition using Places Database.” NIPS, 2014. • Learning human security perception • Transfer learning from Place205*, US, to Rome and Milan PERCEPTION SCORE [0-10] 2 1 3 URBAN PERCEPTION 4
  25. 32 Can we predict human security perception? * Ordonez, Vicente,

    and Tamara L. Berg. "Learning high-level judgments of urban perception.” ECCV, 2014. Model type State of the art* Our model NY - NY 0.687 0.718 NY - Boston 0.701 0.734 Boston - Boston 0.718 0.744 Boston - NY 0.636 0.693 2 1 3 URBAN PERCEPTION 4
  26. 33 2 1 3 URBAN PERCEPTION 4 Describe security perception

    Security perception Vitality Regression model
  27. 34 2 1 3 URBAN PERCEPTION 4 Describe security perception

    2 4.4 4.6 4.8 5.0 ety score DUOMO SAN SIRO QUARTO OGGIARO CITTA' STUDI BICOCCA 0.2 0.0 0.2 0.4 0.6 0.8 1.0 1.2 Land Use Mix 0.8 1.2 1.8 2.7 4.1 6.1 9.3 Activity density ⇥ 10 MILAN Security perception Vitality Regression model
  28. 35 Urban metric Standardized Beta coefficient adj − Rl 0.91

    Security perception -> presence of people 2 1 3 URBAN PERCEPTION 4
  29. 36 Urban metric Standardized Beta coefficient Population density 0.155** Employees

    density 0.328** Deprivation -0.022 Distance from the center -0.257** Security perception 0.105** adj − Rl 0.91 ** p-value < 0.001; * p-value < 0.01; Security perception -> presence of people 2 1 3 URBAN PERCEPTION 4
  30. 37 Urban metric Standardized Beta coefficient % of women (from

    census) 0.001 Deprivation -0.005 Distance from the center -0.003 Security perception 0.020** adj − Rl 0.65 ** p-value < 0.001; * p-value < 0.01; Security perception -> presence of women 2 1 3 URBAN PERCEPTION 4
  31. 38 Visual elements for security perception HIGH SAFETY PERCEPTION RANDOMLY

    OBSCURE PART OF THE IMAGE AND PREDICT 2 1 3 URBAN PERCEPTION 4 CONTRIBUTE POSITIVELY CONTRIBUTE NEGATIVELY
  32. Take home 39 De Nadai, Marco, et al. "Are Safer

    Looking Neighborhoods More Lively?: A Multimodal Investigation into Urban Life." ACM MM, 2016. Security perception can describe and predict the presence of people 2 1 3 URBAN PERCEPTION 4
  33. Real estate appraisal • Timeless sale transactions • Proprietary data

    • Lack of data? • Neighborhood? 43 2 1 3 HOUSING PRICE 4
  34. A data mining approach 44 PLACE Characteristics of the census

    cell NEIGHBORHOOD Description and perception PROPERTY Characteristics of the property 2 1 3 HOUSING PRICE 4
  35. 45 The data One year of listed properties in Immobiliare.it

    • The 8 biggest Italian cities • 70,000 properties 2 1 3 HOUSING PRICE 4
  36. 46 The property: textual features Textual features about the listed

    property • Number of rooms • Square meters • Energy compliance • Garden (yes/no) • […] 2 1 3 HOUSING PRICE 4
  37. Features of the city For each of the ~ 400’000

    census cells: • build the egohood • Create: • 10 socio-economic indexes • 11 urban features • 4 indexes of companies and jobs 49 2 1 3 HOUSING PRICE 4
  38. 50 XGBoost K-fold Cross-validation (with care!) = ( + )

    2 1 3 HOUSING PRICE 4 Egohood features (e.g. land use mix) Property features (e.g. square feets) Housing price (ground truth) Weight/contiguity matrix
  39. 51 Results Model MAE MdAPE Property 148, 109 23,76% Property

    + Neighborhood 104,586 15,44% THE NEIGHBORHOOD SHAPES PROPERTY PRICE BY ~60%! 2 1 3 HOUSING PRICE 4
  40. Result 54 De Nadai, Marco and Bruno Lepri. "The economic

    value of neighborhoods: Predicting real estate prices from the urban environment" IEEE DSAA, 2018. Neighborhood features are very correlated with housing price 2 1 3 HOUSING PRICE 4
  41. What drives crime? There are many theories CRIMINOLOGY • Lack

    of cooperation and trust URBAN PLANNING • Lack of informal surveillance: (guardianship by ordinary citizen, not just the police) 56 2 1 3 CRIME 4
  42. Limits • Mobility of people is not considered • The

    built environment? • Usually tested in one city Q: Can we study multiple factors in multiple cities to understand crime? 57 2 1 3 CRIME 4
  43. 58 2 1 3 CRIME 4 SOCIO-ECONOMIC Our model •

    Socio-economic conditions (CRIMINOLOGY) • Economic deprivation • Ethnic heterogeneity • Residential instability
  44. 59 2 1 3 CRIME 4 Our model • Socio-economic

    conditions (CRIMINOLOGY) • The built environment (URBAN PLANNING) • Land use mix • Small blocks • […] BUILT ENVIRONMENT
  45. 60 2 1 3 CRIME 4 Our model • Socio-economic

    conditions (CRIMINOLOGY) • The built environment (URBAN PLANNING) • Mobility of people MOBILITY Jiang, Shan, et al. "The TimeGeo modeling framework for urban mobility without travel surveys." Proceedings of the National Academy of Sciences 113.37 (2016)
  46. 61 2 1 3 CRIME 4 Our model • Socio-economic

    conditions (CRIMINOLOGY) • The built environment (URBAN PLANNING) • Mobility of people • Tested for Bogotá, Boston, Chicago, Los Angeles
  47. 63 Leroux et al. "Estimation of disease rates in small

    areas: a new mixed model for spatial dependence." Statistical models in epidemiology, the environment, and clinical trials. log % = ( vwi [ v v + CAR process Auto-correlation matrix Features (e.g. land use mix) Crime in a district (ground truth) Bayesian Poisson model 2 1 3 CRIME 4
  48. Results (MdAPE errors) 64 Model Bogota Boston Los Angeles Socio-economic

    44% 43% 22% Built environment 24% 31% 22% Mobility 37% 40% 21% 2 1 3 CRIME 4
  49. Results (MdAPE errors) 65 Model Bogota Boston Los Angeles Socio-economic

    44% 43% 22% Built environment 24% 31% 22% Mobility 37% 40% 21% Full model 19% 38% 15% SOCIO-ECONOMIC + BUILT ENVIRONMENT + MOBILITY 2 1 3 CRIME 4
  50. 66 Small blocks Just an example… 2 1 3 CRIME

    4 Built environment - Discrepancies
  51. BOSTON BOGOTA 67 Just an example… 2 1 3 CRIME

    4 Built environment - Discrepancies
  52. BOSTON BOGOTA 68 THE BUILT ENVIRONMENT IS NOT ENOUGH Just

    an example… 2 1 3 CRIME 4 Built environment - Discrepancies
  53. 69 How can we describe crime? Socio-economic characteristics Built environment

    Mobility ✓ Precise data ✓ Availability ✓ Unbiased (population) ✗ Rarely updated ✗ Availability ✗ Bias over OSM volunteers ✗ Availability 2 1 3 CRIME 4
  54. 70 How can we describe crime? Socio-economic characteristics Built environment

    Mobility ALL COMPONENTS TOGETHER BETTER DESCRIBE CRIME THEORY HAS DISCREPANCIES OVER DIFFERENT CITIES 2 1 3 CRIME 4
  55. 72 Research themes Urban description 1 4 2 3 Urban

    perception Housing price Crime AUTOMATICALLY COLLECTED DATA URBAN SCIENCE AT SCALE
  56. Why does it matter? 74 • DATA MINING • Inexpensive

    way to understand urban mechanisms; • New stimulus to social research; • Responsive predictions without historical data • Deep understanding of city life through multi-modal data • Studying cities means studying people • Gentrification?
  57. Some limits 75 • Theories/models <-> domain adaptation • Timely

    predictions • Data driven results <-> decisions
  58. 76 In the (next) future DATA DRIVEN APPROACH: let the

    data speak STREET VIEW IMAGERY AERIAL IMAGERY + NEIGHBORHOOD OUTCOMES (CRIME, VITALITY…)
  59. 77 In the (next) future GANs FOR URBAN PLANNING (with

    Yahui Liu) CRIME VITALITY HOUSING PRICE PREDICT GENERATE? NEIGHBORHOOD OUTCOMES AERIAL + STREET VIEW IMAGERY
  60. 78 1. De Nadai, M., Staiano, J., Larcher, R., Sebe,

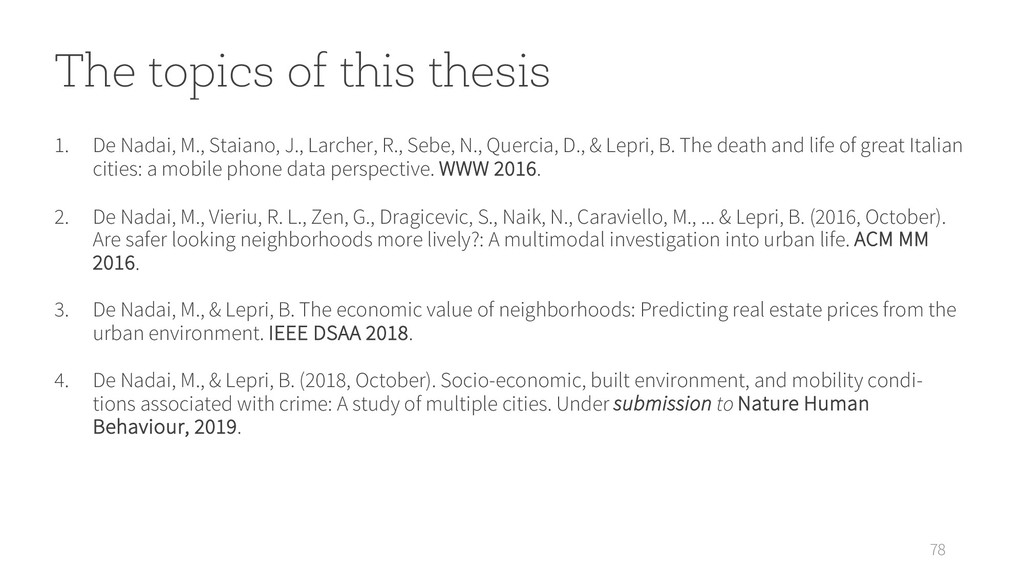
    N., Quercia, D., & Lepri, B. The death and life of great Italian cities: a mobile phone data perspective. WWW 2016. 2. De Nadai, M., Vieriu, R. L., Zen, G., Dragicevic, S., Naik, N., Caraviello, M., ... & Lepri, B. (2016, October). Are safer looking neighborhoods more lively?: A multimodal investigation into urban life. ACM MM 2016. 3. De Nadai, M., & Lepri, B. The economic value of neighborhoods: Predicting real estate prices from the urban environment. IEEE DSAA 2018. 4. De Nadai, M., & Lepri, B. (2018, October). Socio-economic, built environment, and mobility condi- tions associated with crime: A study of multiple cities. Under submission to Nature Human Behaviour, 2019. The topics of this thesis
  61. 79 5. Barlacchi, Gianni, et al. "A multi-source dataset of

    urban life in the city of Milan and the Province of Trentino." Nature Scientific Data 2, 2015. 6. Centellegher, Simone, et al. "The Mobile Territorial Lab: a multilayered and dynamic view on parents’ daily lives." EPJ Data Science 5.1, 2016. 7. Mamei, Marco, et al. "Is social capital associated with synchronization in human communication? An analysis of Italian call records and measures of civic engagement." EPJ Data Science 7.1, 2018. 8. De Nadai, Marco, et al. "Apps, Places and People: strategies, limitations and trade-offs in the physical and digital worlds." under review in Nature Scientific Reports, 2019. 9. Strano, Emanuele, et al. "Precise mapping, density and spatial structure of all hu- man settlements on earth», under submission for Nature Communications, 2019. 10. Liu, Yahui, et al. "Gesture-to-gesture translation in the wild via category-independent con- ditional maps", under review in ACM MM, 2019. Other topics I had the chance to explore
  62. STEFAN DRAGICEVIC LETOUZE’ EMMANUEL DANIELE QUERCIA MARTA C. GONZALEZ CESAR

    A. HIDALGO JACOPO STAIANO NICU SEBE BRUNO LEPRI ROBERTO LARCHER SANDY PENTLAND GLORIA ZEN XU YANYAN RADU L. VIERIU NIKHIL NAIK THANKS