Upgrade to Pro — share decks privately, control downloads, hide ads and more …

Strategies and limitations in app usage and human mobility

Strategies and limitations in app usage and human mobility

Marco De Nadai

July 18, 2019
Tweet

More Decks by Marco De Nadai

Other Decks in Research

Transcript

  1. Strategies and limitations in app usage and human mobility Marco

    De Nadai, Antonio Lima, Angelo Cardoso, Bruno Lepri and Nuria Oliver
  2. 3 PEOPLE SPEND AN INCREASINGLY AMOUNT OF TIME ON THE

    PHONE […] REACHING 3 HOURS PER DAY THERE ARE 2.1M APPS IN THE GOOGLE PLAY STORE App usage statistics by Statista.com & hubspot.net USER ENGAGMENT INCREASED BY 23%
  3. 6 ALWAYS USED MEH... SOMETIMES WAS THIS APP EVEN HERE?

    • APP USAGE CHANGES • APPS CHANGE But I always use the same apps!
  4. 8 •Screen time of 90K people •Over 8 months •69K

    different apps •12M of people’s hours spent on apps Data
  5. 13 • " ~ ( + ' ))*), - •

    = 1.19 ± 0.01 Characterizing App usage
  6. 14 • " ~ ( + ' ))*), - •

    = 1.19 ± 0.01 Characterizing App usage • " ~ ())* • = 1.27 ± 0.01
  7. 15 • " ~ ( + ' ))*), - •

    = 1.19 ± 0.01 Characterizing App usage • " ~ ())* • = 1.27 ± 0.01 • ~ 9 • γ = 0.41
  8. 16 • " ~ ( + ' ))*), - •

    = 1.19 ± 0.01 Characterizing App usage • " ~ ())* • = 1.27 ± 0.01 • ~ 9 • γ = 0.41 • PEOPLE TIME IS FOCUSED ON FEW APPS • PEOPLE KEEP EXPLORING NEW APPS
  9. 18 • Apps used at least twice and for at

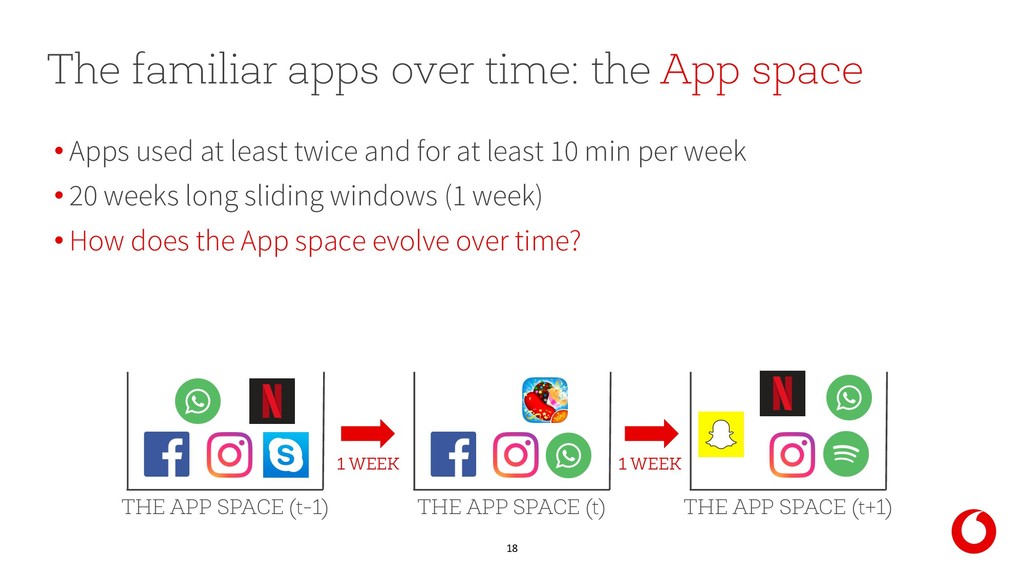
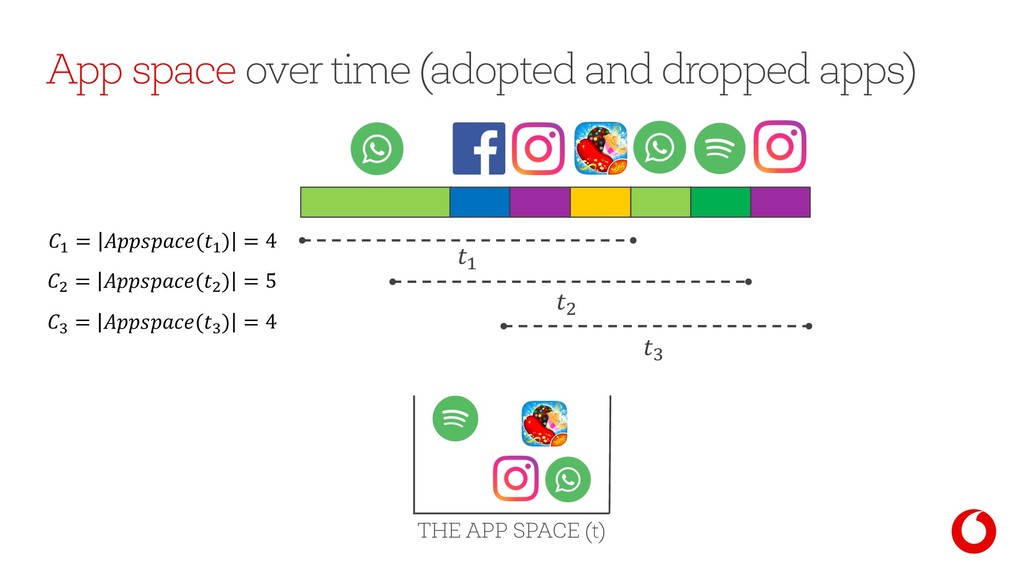
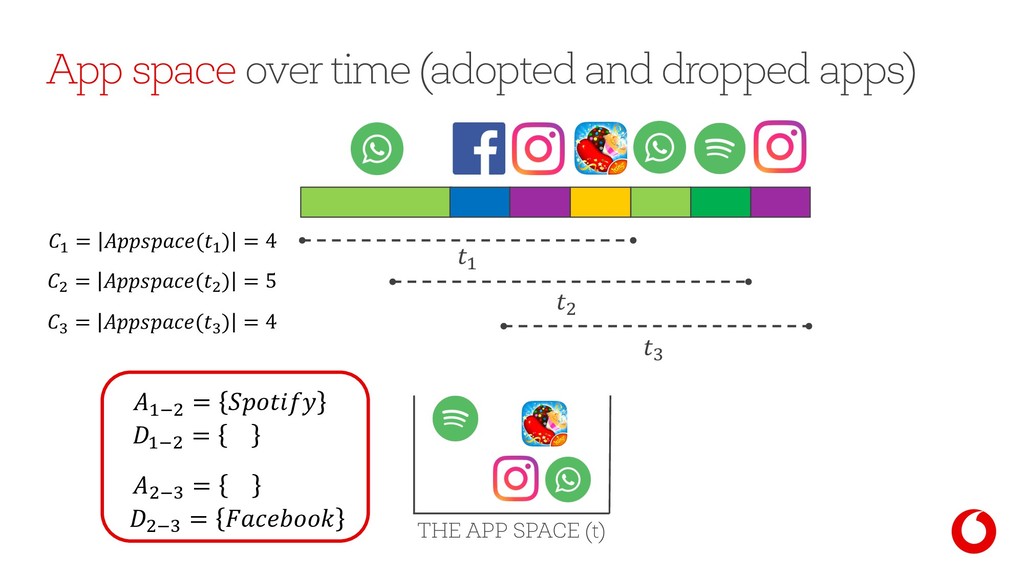
    least 10 min per week • 20 weeks long sliding windows (1 week) • How does the App space evolve over time? The familiar apps over time: the App space THE APP SPACE (t) THE APP SPACE (t-1) THE APP SPACE (t+1) 1 WEEK 1 WEEK
  10. App space over time (adopted and dropped apps) B <

    < = (<) = 4 B = (B) = 5 THE APP SPACE (t)
  11. App space over time (adopted and dropped apps) D B

    < < = (<) = 4 B = (B) = 5 D = (D) = 4 THE APP SPACE (t)
  12. App space over time (adopted and dropped apps) <)B =

    <)B = B)D = B)D = D B < < = (<) = 4 B = (B) = 5 D = (D) = 4 THE APP SPACE (t)
  13. 23 • Gain: M = M − M () •

    97.5% of people exhibit a conserved capacity ( OP QRP ≤ 1) Adoped and dropped apps
  14. What is the conserved capacity? On average: •Everytime a new

    app is adopted, an older app is discarded THE APP SPACE (t)
  15. 25 •Local shuffle: app usage order of a user No

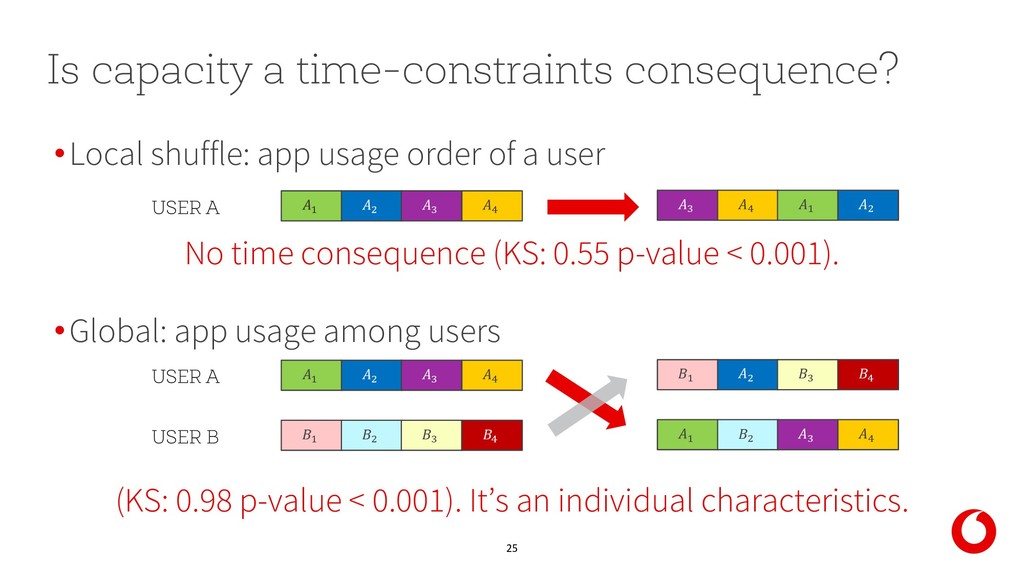
    time consequence (KS: 0.55 p-value < 0.001). •Global: app usage among users (KS: 0.98 p-value < 0.001). It’s an individual characteristics. Is capacity a time-constraints consequence? < B D T USER A D T < B < B D T USER A < B D T < B D T USER B < B D T
  16. 26 The app strategy • EXPLORERS (M ≫ ) •

    KEEPERS (M ≪ ) • Explorers adopt 1 new app every 28 weeks • Keepers always keep using the same apps M = M / M
  17. 30 People are focused on few apps, but keep exploring.

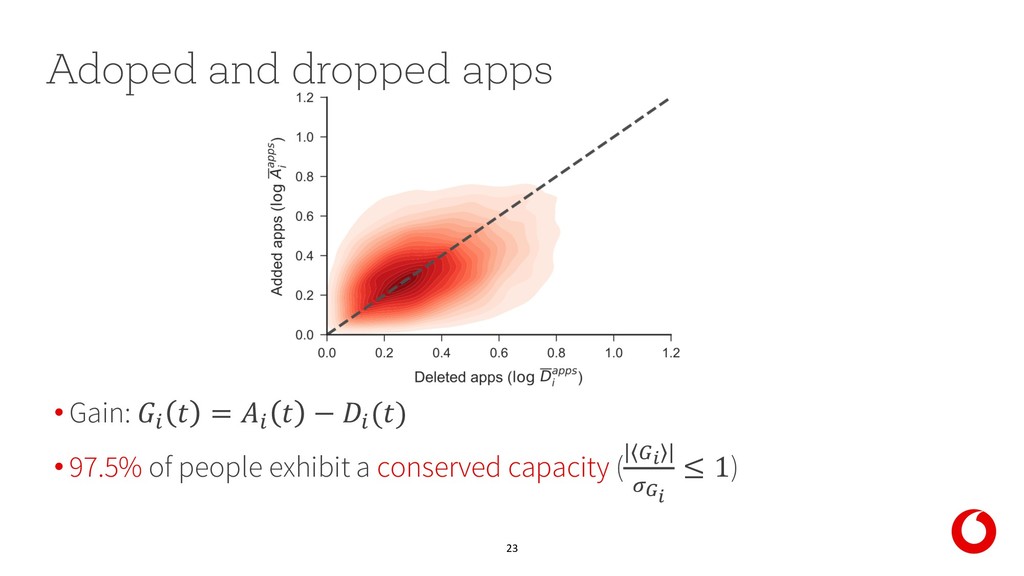
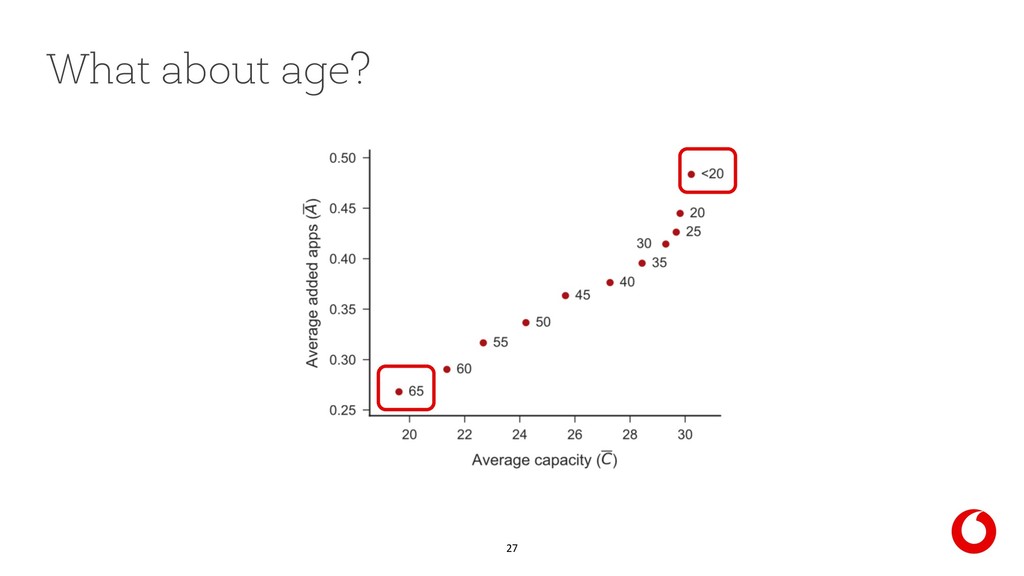
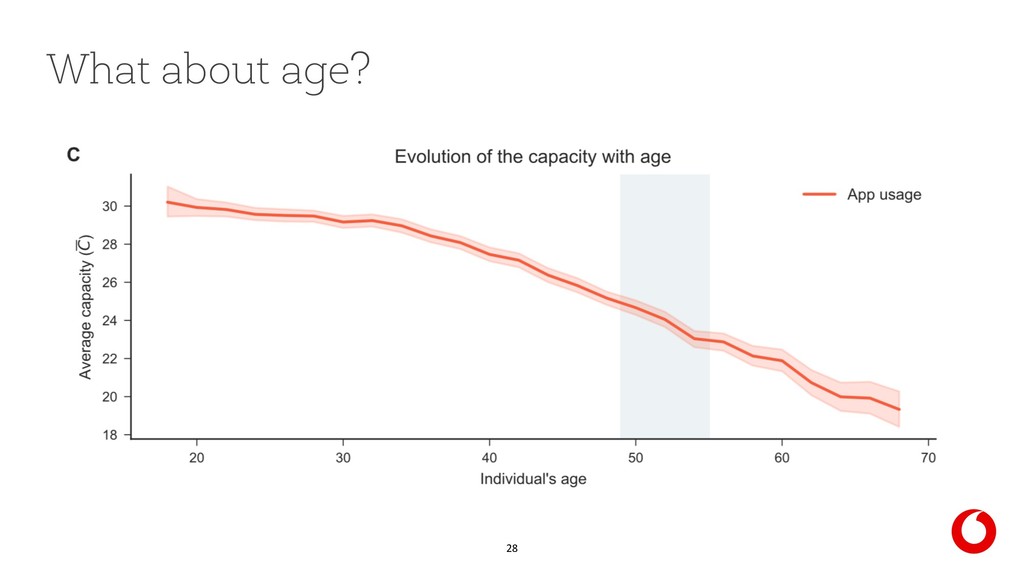
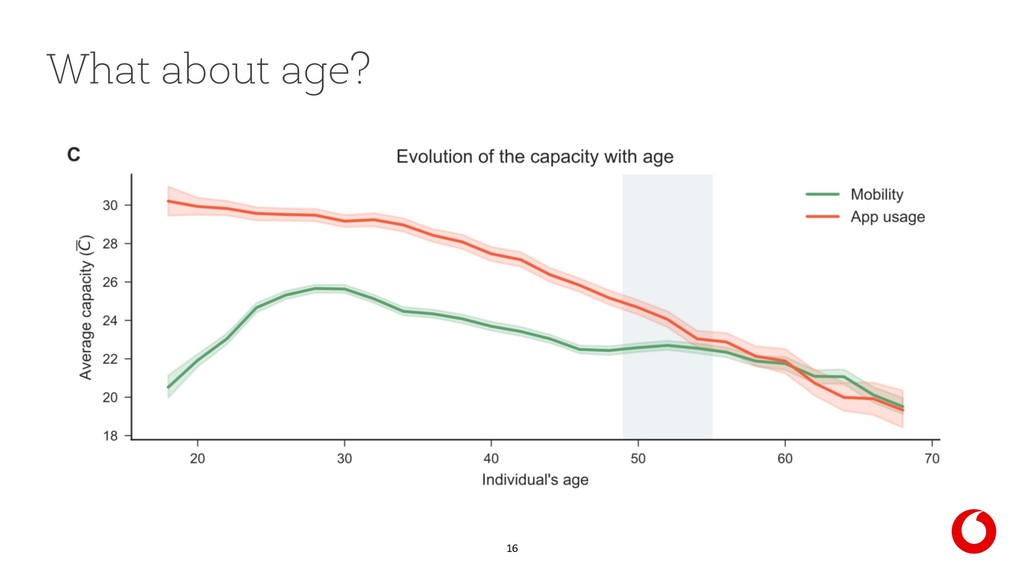
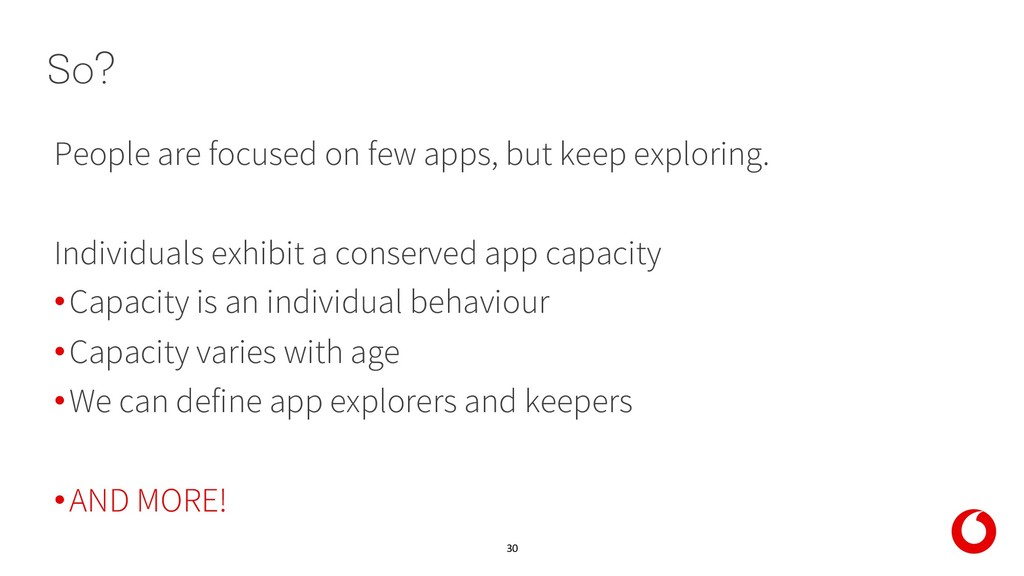
    Individuals exhibit a conserved app capacity •Capacity is an individual behaviour •Capacity varies with age •We can define app explorers and keepers •AND MORE! So?
  18. 35 • Alessandretti, Laura, et al. "Evidence for a conserved

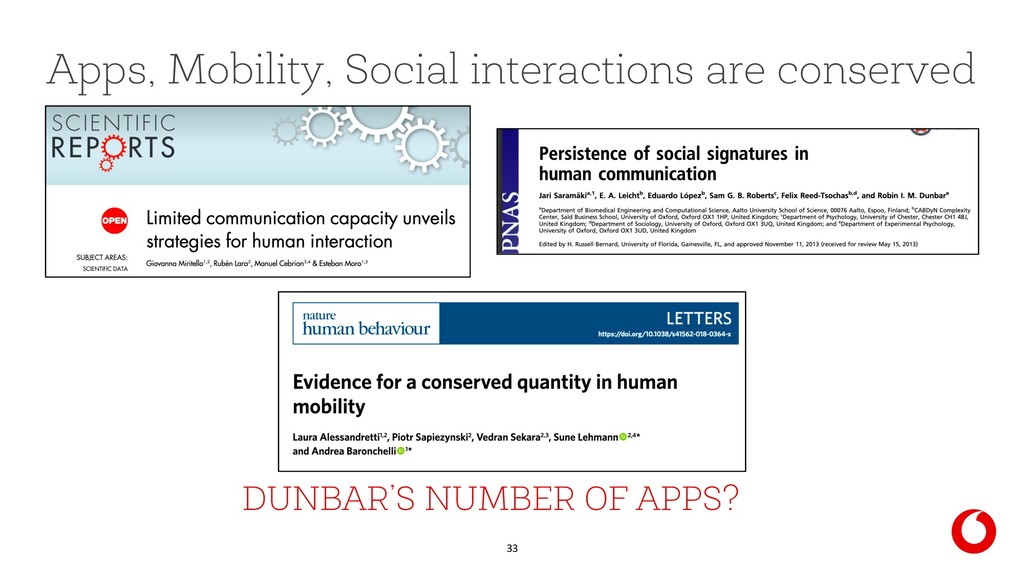
    quantity in human mobility." Nature human behaviour 2.7 (2018): 485. • Alessandretti, Laura, Sune Lehmann, and Andrea Baronchelli. "Understanding the interplay between social and spatial behaviour." EPJ Data Science 7.1 (2018): 36. • Pappalardo, Luca, et al. "Returners and explorers dichotomy in human mobility." Nature communications 6 (2015): 8166. • Miritello, Giovanna, et al. "Limited communication capacity unveils strategies for human interaction." Scientific reports 3 (2013): 1950. References
  19. 36 Apps that stay the most ~10% of apps are

    always kept ~17.5% are continuosly changed