Upgrade to Pro — share decks privately, control downloads, hide ads and more …

DevOpsPorto Meetup5: The Road to Monitoring Nirvana by Pedro Araújo

DevOpsPorto Meetup5: The Road to Monitoring Nirvana by Pedro Araújo

Talk delivered by Pedro Araújo

DevOpsPorto

June 13, 2017
Tweet

More Decks by DevOpsPorto

Other Decks in Technology

Transcript

  1. Who am I? Studied Computer Engineering Did web development for

    a couple of years Moved to systems administration for a couple of years Had a run at build and automation engineering Landed in SRE, <3 it
  2. 135 million daily transactions 4.7 billion daily API calls most

    weeks (55k/s, 100k/s peak) 2.5 terabytes of daily log data output 250,000-per-second time series data points 14k nagios checks
  3. RSS_URI="/rss" LOG_FILE="/var/log/httpd/access_log" LOG_DATE_FORMAT="%d/%b/%Y" DATE="-1 day" LOG_FDATE=`date -d "$DATE" "+${LOG_DATE_FORMAT}"` #

    Unique IPs requesting RSS, except those reporting "subscribers": IPSUBS=$( fgrep "$LOG_FDATE" "$LOG_FILE" \ | fgrep " $RSS_URI" \ | egrep -v '[0-9]+ subscribers' \ | cut -d' ' -f 1 \ | sort \ | uniq \ | wc -l ) # Other user-agents reporting "subscribers", for which we'll use the entire # user-agent string for uniqueness: OTHERSUBS=$( fgrep "$LOG_FDATE" "$LOG_FILE" \ | fgrep " $RSS_URI" \ | fgrep -v 'subscribers; feed-id=' \ | egrep '[0-9]+ subscribers' \ | egrep -o '"[^"]+"$' \ | sort -t\( -k2 -sr \ | awk '!x[$1]++' \ | egrep -o '[0-9]+ subscribers' \ | awk '{s+=$1} END {print s}' ) (from: https://gist.github.com/marcoarment/3783146 (abbr.))
  4. Named value at some time. Metric identity name dimensions Metric

    value Timestamp os.filesystem.size 1486469296 961130496 mount=/ type=Used os.filesystem.size 1486469296 8903143424 mount=/ type=Free os.filesystem.size 1486469296 1143103488 mount=/var type=Used os.filesystem.size 1486469296 249068044288 mount=/var type=Free os.filesystem.size 1486469296 0 mount=/dev/shm type=Used os.filesystem.size 1486469296 50682404864 mount=/dev/shm type=Free os.filesystem.size-inodes 1486469296 18862 mount=/ type=Used os.filesystem.size-inodes 1486469296 2602578 mount=/ type=Free os.filesystem.size-inodes 1486469296 14518 mount=/var type=Used os.filesystem.size-inodes 1486469296 66504522 mount=/var type=Free os.filesystem.size-inodes 1486469296 1 mount=/dev/shm type=Used os.filesystem.size-inodes 1486469296 12373633 mount=/dev/shm type=Free
  5. Example histogram sample # HELP The number of chunks persisted

    per series. # TYPE prometheus_local_storage_series_chunks_persisted histogram prometheus_local_storage_series_chunks_persisted_bucket{le="1"} 3.205911e+06 prometheus_local_storage_series_chunks_persisted_bucket{le="2"} 3.652375e+06 prometheus_local_storage_series_chunks_persisted_bucket{le="4"} 4.405614e+06 prometheus_local_storage_series_chunks_persisted_bucket{le="8"} 5.66866e+06 prometheus_local_storage_series_chunks_persisted_bucket{le="16"} 8.226382e+06 prometheus_local_storage_series_chunks_persisted_bucket{le="32"} 8.73615e+06 prometheus_local_storage_series_chunks_persisted_bucket{le="64"} 8.770525e+06 prometheus_local_storage_series_chunks_persisted_bucket{le="128"} 8.770525e+06 prometheus_local_storage_series_chunks_persisted_bucket{le="+Inf"} 8.770525e+06 prometheus_local_storage_series_chunks_persisted_sum 5.5495433e+07 prometheus_local_storage_series_chunks_persisted_count 8.770525e+06
  6. You can roll your own instrumentation. @contextmanager def op(what): start

    = time.time() yield increment('hitcount.total_s', value=(time.time() - start), tags=["op:" + what]) while True: with op('receive'): req = queue.pop() with op('compute_route'): route = compute_route(req) with op('update'): db.execute(''' UPDATE hitcount WHERE route = ? SET hits=hits + 1 ''', (route, )) with op('finish'): req.finish() (from: https://honeycomb.io/blog/2017/01/instrumentation-measuring-capacity-through-utilization/)
  7. Aspects help instrumentation. @Controller public class MyController { @RequestMapping("/") @TimeMethod(name

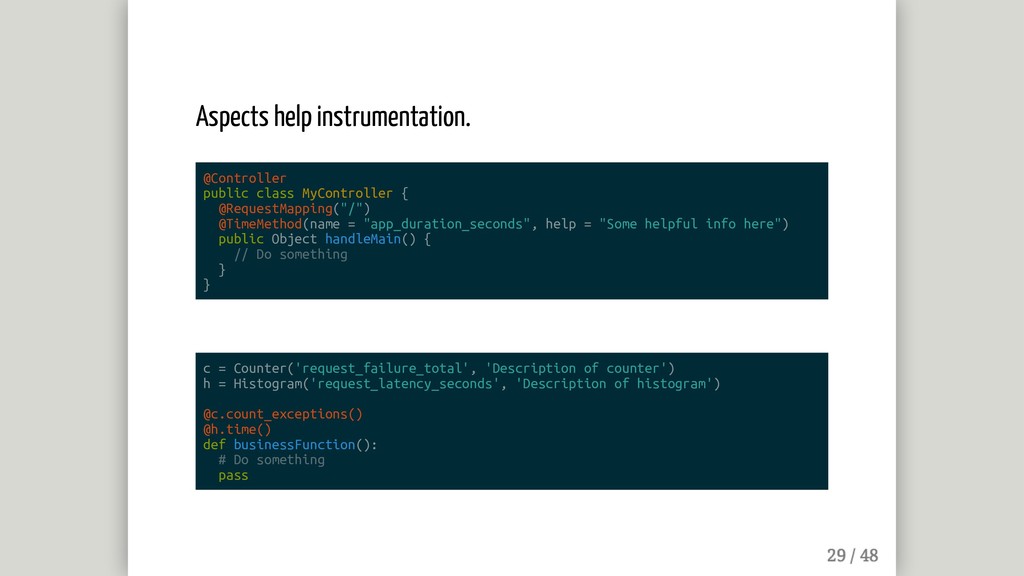
    = "app_duration_seconds", help = "Some helpful info here") public Object handleMain() { // Do something } } c = Counter('request_failure_total', 'Description of counter') h = Histogram('request_latency_seconds', 'Description of histogram') @c.count_exceptions() @h.time() def businessFunction(): # Do something pass