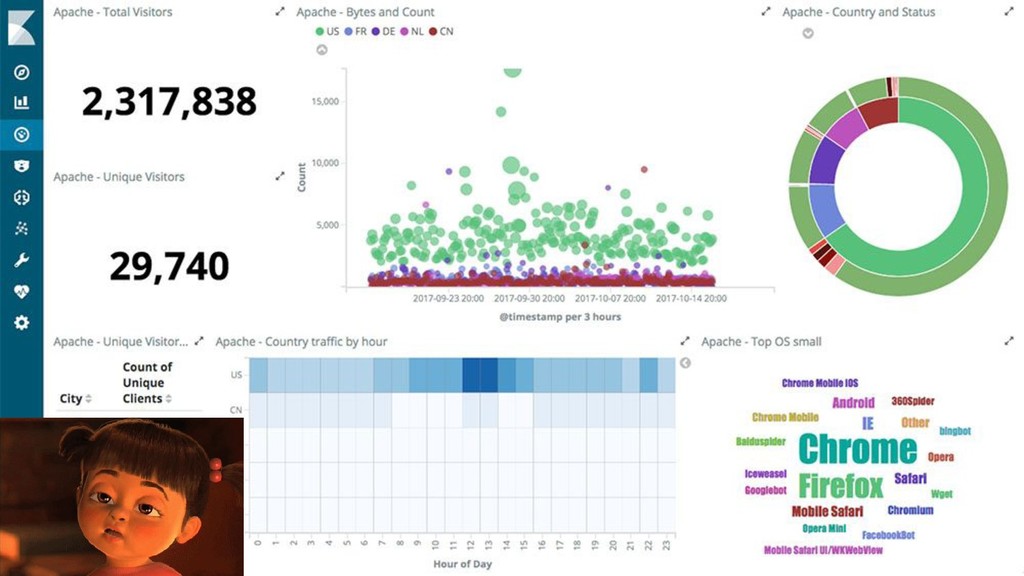
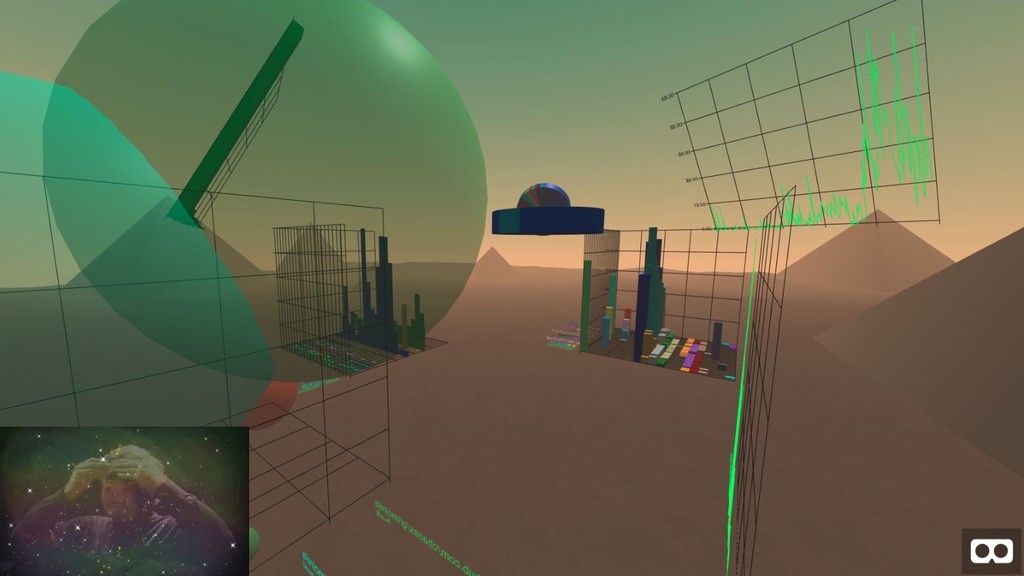
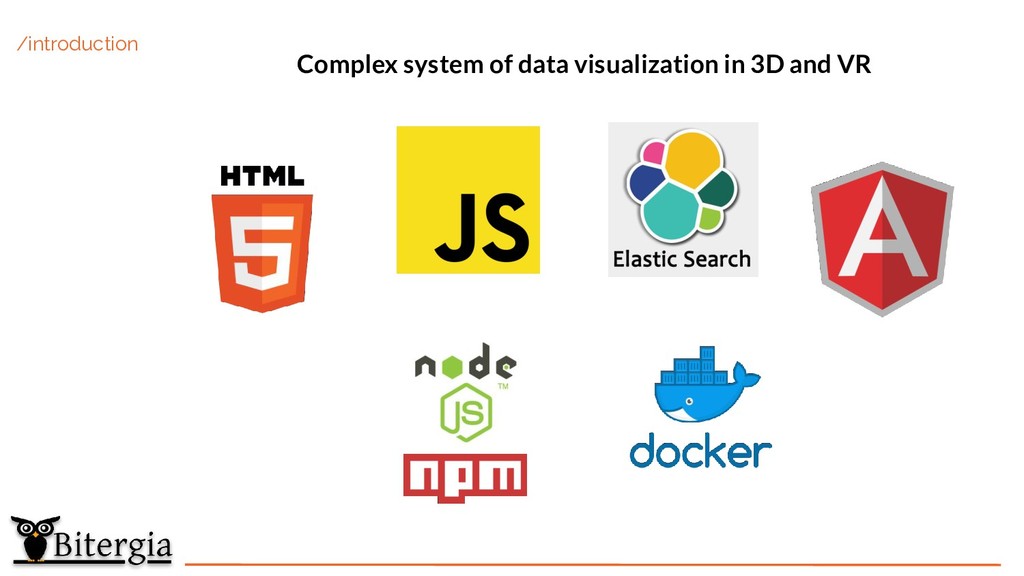
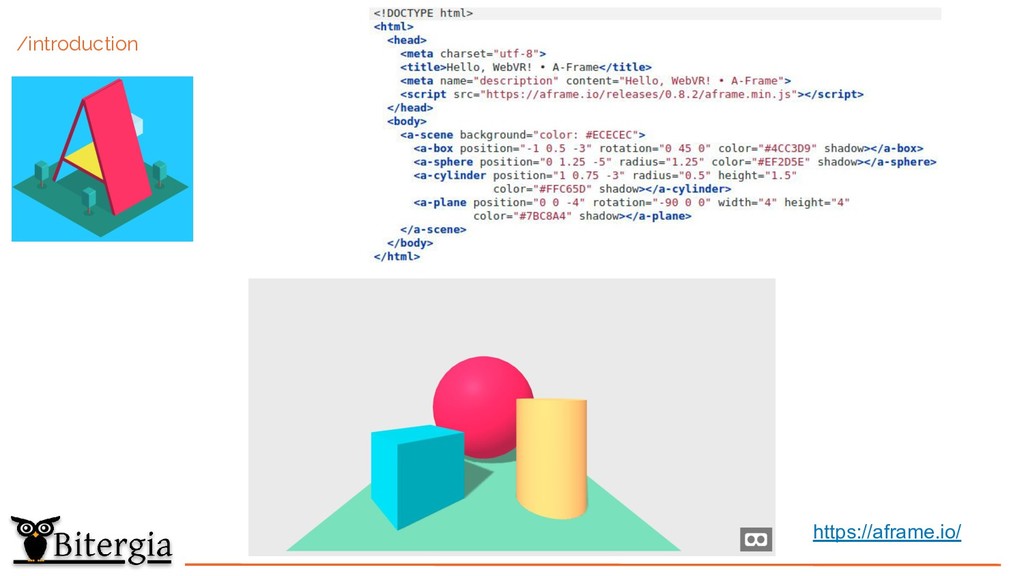
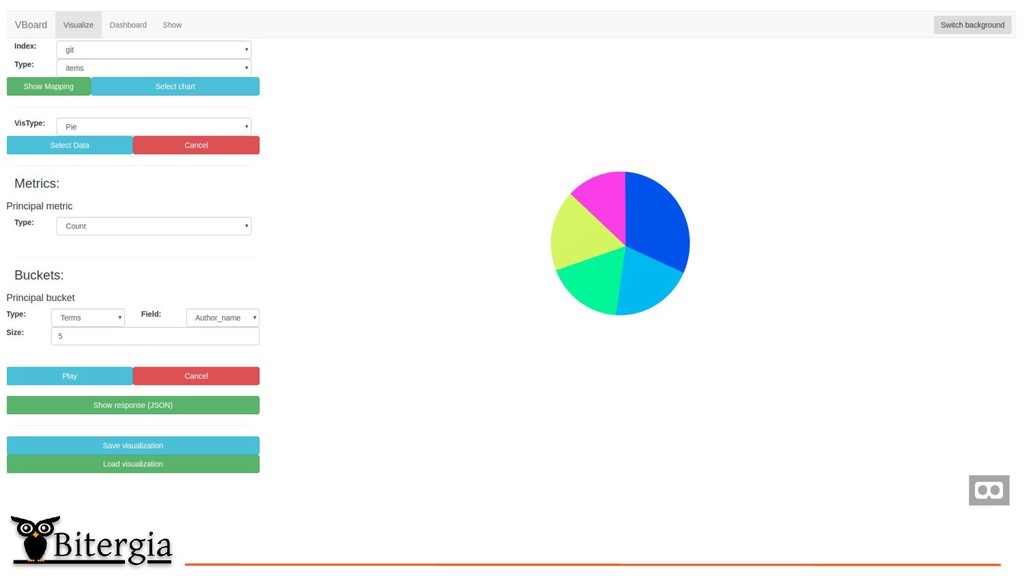
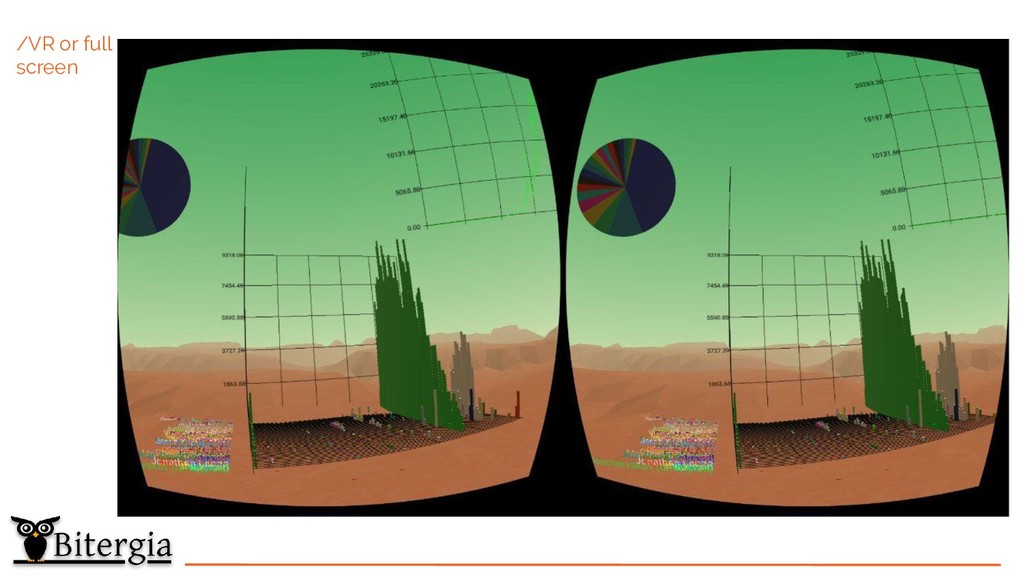
There are plenty of tools that can analyze data in many ways, but just a few of them try to visualize this data in new ways. This is the aim of VBoard, a 100% open source web application that allows building visualizations and dashboards in 3D and VR using A-Frame as its core render library. The data is retrieved in real time using a ElasticSearch, and VBoard saves its objects (visualizations, dashboards) in it.
![VBoard David Moreno @dlumbrer1 [email protected] & [email protected] Making web dashboards](https://files.speakerdeck.com/presentations/37c06103a0904234ad968c668f432e7c/slide_0.jpg)
![David Moreno @dlumbrer1 Front end and Researcher at Bitergia [email protected]](https://files.speakerdeck.com/presentations/37c06103a0904234ad968c668f432e7c/slide_22.jpg)