Upgrade to Pro — share decks privately, control downloads, hide ads and more …

All Quiet on the Digital Front: Security Analytics at USAA

Elastic Co
February 18, 2016

All Quiet on the Digital Front: Security Analytics at USAA

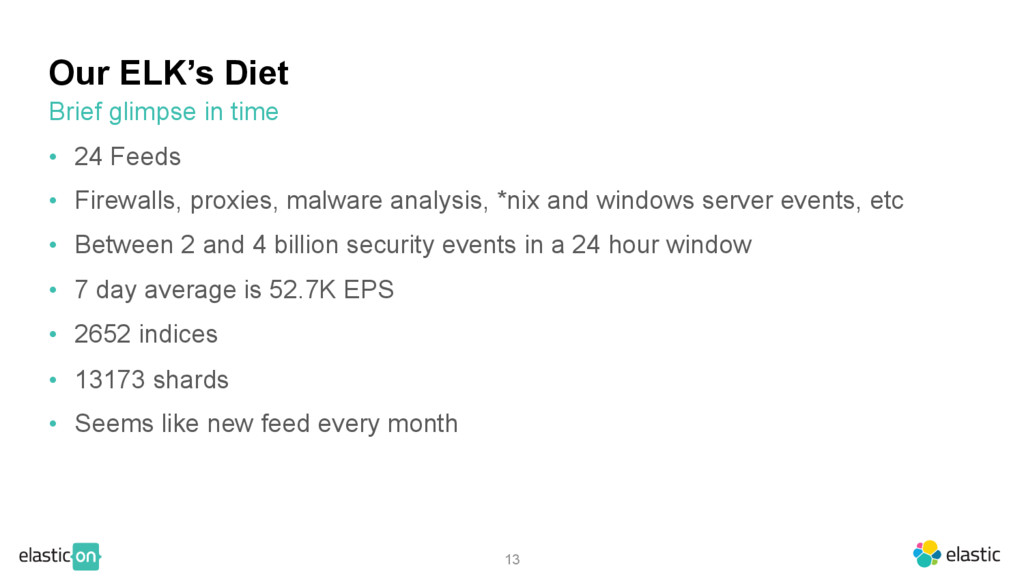
Find out how USAA remediates security incidents by analyzing 3-4 billion security events a day, running Python scripts, building custom applications to mine the data, and utilizing Watcher, the Elasticsearch alerting and notification extension, to make their lives easier – and more enjoyable!

Elastic Co

February 18, 2016
Tweet

More Decks by Elastic Co

Other Decks in Technology

Transcript

  1. 1 Neelsen Cyrus, Senior Security Analyst Feb 18, 2016 All

    Quiet on the Digital Front Security Analytics @ USAA
  2. 2 About Me •  Various operational roles at USAA since

    1997 ‒  WebSphere farm support for external and internal web applications ‒  Configuration Management Database ‒  Cyber Threat Operations Center (CTOC) •  Dual hats in the (CTOC) •  Usually behind the scenes and not on stage with real people watching me
  3. 3 Personal Disclaimer •  We discuss technical infrastructure and applications

    during this presentation, but all observations and opinions presented are mine and do not reflect those of my employer, USAA •  If you do have concerns with content presented, please use my personal address and we can discuss in more detail This presentation is not an endorsement of any specific product, but rather an explanation of my use, proposed best practices, and experiences.
  4. 4 CTOC Infrastructure Early Days (B.E.) •  SIEM installed to

    check a compliance box. No/little expertise in it’s care and feeding •  Official SOC formed and staff added the specialized in managing a SIEM and analysts were added to respond to alerts •  To mark another compliance and/or regulatory box, log management appliances from the same vendor were added
  5. 5 CTOC Analyst Early Days (B.E.) •  Log management appliance

    queries could take minutes, even hours •  SIEM provided some pivoting capabilities •  First responders performed almost all their analysis in Excel going through CSV exports •  Our SIEM did provide a good correlation engine and a not so good case management system
  6. 6 Timeline of the Great ELK Migration •  How to

    turn our analysts from gatherers (reactive) to hunters (proactive) •  Our insightful boss added a task to our 2014 project list to identify better visualization tools for our data that would improve our analysts capabilities •  Within a short couple of months, by mid 2014, we had a couple different touch points that led us to the ELK stack
  7. 7 Timeline of the Great ELK Migration •  Long running

    Skizzle Sec thread - SECURITY ANALYSTS DISCUSS SIEM’S – ELASTICSEARCH/LOGSTASH/KIBANA VS ARCSIGHT, SPLUNK, AND MORE •  Conference call with Raffael Marty of pixlcloud (and Security Visualization fame) asking his opinions on tools that could improve our analysts toolset •  In house written tools were backed by Apache Solr and various blogs, how tos, etc mentioned ELK as an alternative (Continued)
  8. 8 Timeline of the Great ELK Migration •  After hearing

    about ELK from multiple sources… •  Install full ELK stack in LAB. Get a feel for how things work •  Interesting for us from an infrastructure perspective, but time to see what our real users would thing. •  Let’s see what one of the ‘real’ security analysts thinks of it (Continued)
  9. 9 Timeline of the Great ELK Migration •  No training,

    our guinea pig analyst had some awesome visualizations up and running within an hour or two. •  She demonstrated the use of filters to quickly slice and dice our proxy data in ways we’ve always wanted to but never could •  After that came some dashboards that brought new insights to the data ‒  Top web users ‒  Successful requests that we assumed were blocked by policy •  Time for some smack talk (Continued)
  10. 10 Selling the ELK •  But it’s open source… • 

    Elastic provides subscription support so we have someone to bail us out when we mess up •  And it improves our analysts productivity 10x or more over waiting for Log management appliances to spit out csv files for Excel manipulation. •  Boss was sold, took it up the food chain and we got the green light •  Let’s start setting up a production environment
  11. 11 Our ELK’s Dimensions •  Seven clusters (grouped by feed

    type) •  60+ Linux virtual servers •  12 TB usable of SSD •  192 TB usable of SAN •  1.6 PB of other (more on this in a later slide) Typical data node server is 12 core, 96 GB, 6TB filesystem for Elasticsearch
  12. 12

  13. 13 Our ELK’s Diet •  24 Feeds •  Firewalls, proxies,

    malware analysis, *nix and windows server events, etc •  Between 2 and 4 billion security events in a 24 hour window •  7 day average is 52.7K EPS •  2652 indices •  13173 shards •  Seems like new feed every month Brief glimpse in time
  14. 14 ELK Herd •  Seven clusters for event feeds ‒ 

    now through day-30 indices (but variable depending on retention needs ‒  All SAN storage except two backed by SSD storage •  TRIBE ‒  Federate all of the clusters (except our Archive cluster) into common Kibana instance •  CTOCTOOL ‒  Marvel monitoring of all clusters ‒  Metrics - Logstash metrics filter, beats from our servers •  CTOCARCH ‒  day-31 through ??? ‒  Atmos storage accessible via NFS (shoutout to Jeff Bryner@Mozilla) Microclusters
  15. 15 Moving Data and Archiving •  As a single cluster,

    we used curator and tags (ssd, san, atmos) to let Elasticsearch shift our shards around within a single cluster. •  Now we just use curator optimize/snapshot ‒  Optimize day-1 ‒  Snapshot day-2 ‒  Once snapshot is available, restore to our CTOCARCH cluster
  16. 16 Logstash Tier •  Four logstash servers (we call them

    our shipper boxes) behind a load balanced IP •  Logstash instance per feed responsible for getting the events off the wire and into Kafka topics (feed name) •  Also threw the metrics filter in so we can track EPM at the shipping layer Shippers
  17. 17 Logstash Tier •  Twelve logstash servers (we call them

    our indexer boxes) •  Logstash instance per feed responsible for getting the events from the Kafka topics (feedname) •  Parse the events into our standard document schema similar to CEF (gave away what SEIM we are using, didn’t I) to faciliate shipping events to our SIEM •  Perform enrichments (cidr, translate, geoip, etc) •  Also tacked in the metrics filter to get EPM at the indexing layer •  Put the events back onto Kafka topics (feedname-out) Indexers
  18. 18 Logstash Tier •  Same Twelve indexing logstash servers • 

    Logstash instance per feed responsible for getting the events from the Kafka topics (feedname-out) and shipping to Elasticsearch •  Also tacked in the metrics filter to get EPM at the out layer Out
  19. 19 Kafka Cluster •  Four Kafka servers (same specs as

    a ES Data node) •  Three zookeeper servers (same specs as a ES Master node) •  Most topics are set for 24 partitions •  Tuning our largest feeds, we’ve expanded some to 96 partitions
  20. 20 Early Proof that ELK was a Fit •  Internal

    vulnerability scanning traffic (from somewhere) was leaving the network, then hitting our member facing website •  Two analysts start working the case •  One uses our log management appliances to get the events needed into Excel •  Second used Kibana •  Guess who won... Story of two analysts
  21. 21 Now for the SOC’y Stuff •  In the old

    days (until 2014), the general idea was we would feed all of our data to our SIEM (this might be why it struggled most of the time just because of the volume). Our vendor then switched licensing models to GB/day, followed by another change to EPS. •  We could no longer justify the massive check that would be written for a tool that just seemed to annoy our analysts and was not giving us the ‘bang for the buck’ that our ELK stack was.
  22. 22 Let’s Just Send What’s Needed •  Since we still

    had correlation rules in our SIEM that had to be fed in order to generate cases for our analysts, let’s change how we do things. •  ELK already has every event, let’s just forward on the events that have rules •  Even better, with Watcher, lets convert 80% of our SIEM rules (which are fairly simple) to watches. Now we just need to forward on events for the remaining 20% •  Our end goal is to migrate those remaining correlation rules, but it is lower on our priority list
  23. 23 Connecting ELK and our SIEM •  Mine Elasticsearch for

    events of interest with Watcher, Python scripts, etc •  Turn those into alert documents that are of potential interest •  Now we need to get those into cases in front of the analysts •  Watcher webhook posts events to a home-grown webservice that converts JSON document into CEF and forwards on to the SIEM •  Simple rule on the SIEM takes whatever events come in and generate cases (events->alerts->cases)
  24. 24 Connecting ELK and our SIEM •  Because of volume,

    our SIEM struggles with some of our highest volume feed •  Our ELK stack handles them like a champ though •  Forward a subset of those events from ELK to our SIEM using Logstash and Kafka (event feeds)
  25. 25 Security Use Cases and Our Implementation •  How do

    we know that we are getting security events from all of the devices on our network ‒  Use a combination of devices identified by our vulnerability scanners and devices sending events into ELK and keep track of when we first/last saw them ‒  We are now able to identify devices not being scanned for vulnerabilities and also devices that stop sending security events •  This makes the start of a good asset model for use in enriching future events ‒  Let’s enrich that list of devices with asset information (CMDB, server inventory), application information and POCs ‒  Now we can enrich events going into ELK with sourceAsset and destinationAsset information (enclave, database, linux)
  26. 26 Security Use Cases and Our Implementation •  New domain

    identification (similar to previous use case) ‒  Use a combination of our DNS and web proxy events ‒  Keep track of when we first saw a domain and last saw a domain ‒  As we see new domains being accessed from our network, bounce those domains off our intelligence provider •  Dashboards to slice this data various ways: ‒  Top new domains today plus intel matches ‒  DNS Exfil ‒  And many more (Continued)
  27. 27 Security Use Cases and Our Implementation •  Our analysts

    receive a veritable truckload of emails from various sources to help with situational awareness ‒  One analyst uses Outlook as their intel database. I’ve seen it in action and it works ‒  Corporate policy on our mailbox sizes, however, means we can’t keep everything •  Let’s store these emails in Elasticsearch ‒  Forward all our intel emails to a Linux mailbox. ‒  Quick and dirty Python to parse the emails and attachments into Elasticsearch ‒  Parse emails and attachments for Indicators of Compromise (IOCs) and forward off to our intel provider (Continued)
  28. 28 Security Use Cases and Our Implementation •  Besides mailing

    list emails, our analysts run numerous samples through one or more analysis sandboxes such as Cuckoo •  Similar to the email use case, capture the reports from the various sandboxes, normalize and feed back into ELK (Continued)
  29. 29 Visibility into Security Appliance Investments •  The same analyst

    I mentioned early on who helped kick start ELK into a production tool for us also created a Dashboard that is displayed on one of the screens in the SOC. •  The whole goal for this dashboard is to highlight what our bosses investments in security appliances are doing at a high level on a weekly basis ‒  How many times has our web proxy denied a user’s request because of X ‒  How many emails are our inbound security appliances dropping because of Y ‒  What are the drop rates on our next-gen firewalls (both internally and from a perimeter perspective) ‒  And many more Worth it???
  30. 30 Visibility into Current Security Projects •  Our firewall team

    recently decided to implement the blocking of TOR traffic to our member facing website. •  Not only did they use Kibana to perform the analysis on the impact this change would cause, but they also created a high level dashboard showing insights into the security appliance that could report on the TOR Connections •  This allowed everyone to marvel at the impact that one small security change made and see a before/after picture of the change’s effect
  31. 31 Eye candy (the obligatory globe/map) •  Every SOC needs

    a spinning globe/map of doom on one of the screens within the SOC •  Once we had ELK, no need for a separate datastore ‒  Simple Elasticsearch queries ‒  Or if you are queuing (Kafka/Redis), just feed from there •  Or you could just put threatbutt.com/map up on your screen
  32. 32 Enrich Events with more than GeoIP NOT sourceAddress:[10.0.0.0 TO

    10.255.255.255] OR sourceAddress: [192.168.0.0 TO 192.168.255.255] OR sourceAddress:[172.16.0.0 TO 172.31.255.255] OR sourceAddress:[167.24.0.0 TO 167.24.255.255]) AND (destinationAddress:[10.0.0.0 TO 10.255.255.255] OR destinationAddress: [192.168.0.0 TO 192.168.255.255] OR destinationAddress:[172.16.0.0 TO 172.31.255.255] OR destinationAddress:[167.24.0.0 TO 167.24.255.255]) •  Use the CIDR filter and enrich the events with a tag or field •  Update the MaxMind with your RFC1918 addresses
  33. 33 Analyst Workflow – Improved but still work to do

    •  Excel - analyst tool by neccessity not choice in the past •  Fourteen log management appliances with two or three feeds on each •  Web frontend developed to abstract the analyst from which appliance they had to query for particular events (HappyCat) •  CSV files generated and how best to look at those than with Excel Part I
  34. 34 Analyst Workflow – Improved but still work to do

    •  Web frontend from previous slide was forked to use Elasticsearch (hcElk). •  For those analysts that we could never convince to use Kibana’s awesome query/filter/visualization capabilities, hcELK became the tool of choice for them. •  CSVs will always have a place in our SOC, however, with training and demonstrating the capabilities in Kibana, we may be able to diminish the need to rely on CSVs and Excel so much Part II
  35. 35 Another Tool We’ve Added to Our Arsenal •  The

    guys at BlackHills have an awesome tool open source tool called RITA. •  During one of our recent hunting parties, one analyst grabbed input files (csv) out of Elasticsearch while another analyst fed those files into RITA •  RITA then used the power of math to identify potential beaconing behavior, look for unusually long URLs, etc
  36. 36 Additional Tools We’ve Added •  NLPChina’s SQL plugin for

    those analysts who find SQL easier than Lucene Query Syntax •  Apache Hive to expose Elasticsearch indexes to simple SQL clients as well as Tableau (for advanced exploration and visualization of the data)
  37. 37 Hunting ELK •  Start a wiki page, spreadsheet, whatever

    and just document ‘i wonder if’ ideas ‒  Are we seeing clear text passwords floating around the network ‒  Are there rogue DHCP servers anywhere on our network •  ELK makes a wonderful platform to help answer the 20 or 1000 questions you end up documenting •  Schedule downtime for your analysts (and others) to just poke through the data looking for answers to those questions
  38. 38 Hunting ELK •  Use existing data or load some

    of your own •  Use Kibana and/or scripts until you have answers to your questions •  If you find issues, fix the problem. While you are at it, use Watcher to keep an eye going forward to alert the next time one pops up. Create a dashboard for rotating on the big screens showing the before/after effects of remediating a problem you found •  Document what you did, the analysis used and your findings then present to your peers and receive your deserved recognition •  Often times, performing the hunting for one of those topics will lead to other topics that need added to the list for future hunting (Continued)
  39. 39 ELK in Flight •  Capture of all DNS traffic

    and funnel through PacketBeats •  Deploy TopBeats and FileBeats on all CTOC infrastructure •  Integration of Moloch full packet capture •  Feed all honeypot sensor alerts •  Docker for dev/test environments that mirror production •  Containerization to quickly provision/scale clusters
  40. 40 Future ELK •  Hadoop environment (beyond just Hive) to

    perform long term analytics •  Data scientist in a box type software to use that data and help us find interesting events •  More enrichment/sessionization of events (Storm/Spark/Flink?) •  Bring in more feeds •  Work with our IT and Operations teams to highlight the success we have seen with the ELK stack. Architects in that space are now identifying opportunities where Elasticsearch would be a good fit.
  41. 41 Last Minute Updates •  Red team exercise involving phishing

    emails, network shares, ssh, data exfil to Russia, etc •  Analyst request to turn individual email security appliance events into a single event representing the high level details •  Don’t underestimate the translate filter in Logstash. IMO, its freaking awesome
  42. 42 So Long, and Thanks for All the Fish ELK

    Douglas Adams and/or Nelly