Upgrade to Pro — share decks privately, control downloads, hide ads and more …

Elasticsearch in Anger: Stories from the GitHub Search Clusters

Elasticsearch in Anger: Stories from the GitHub Search Clusters

This talk was presented at the inaugural Elastic{ON} conference, http://elasticon.com

Session Abstract:

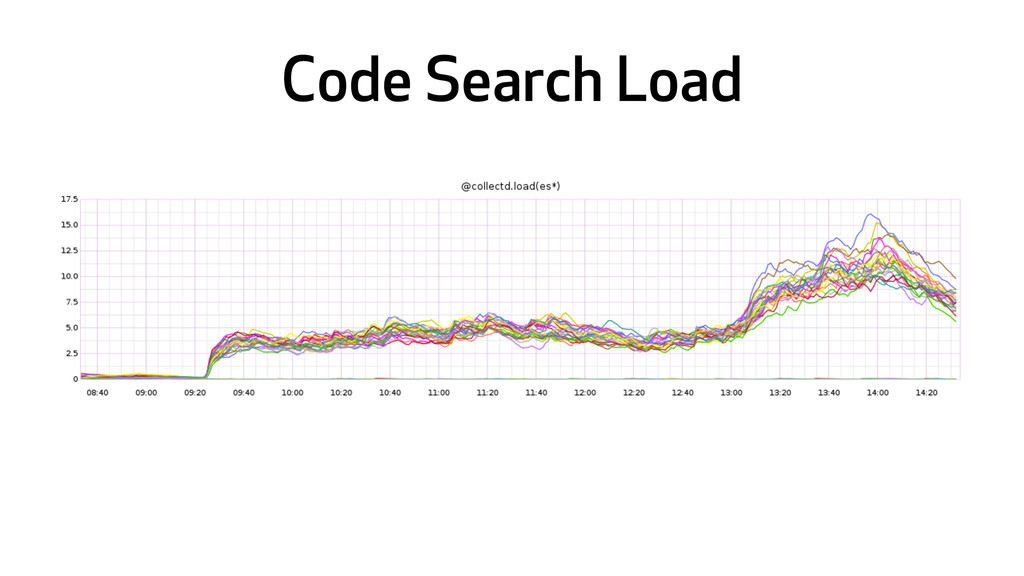
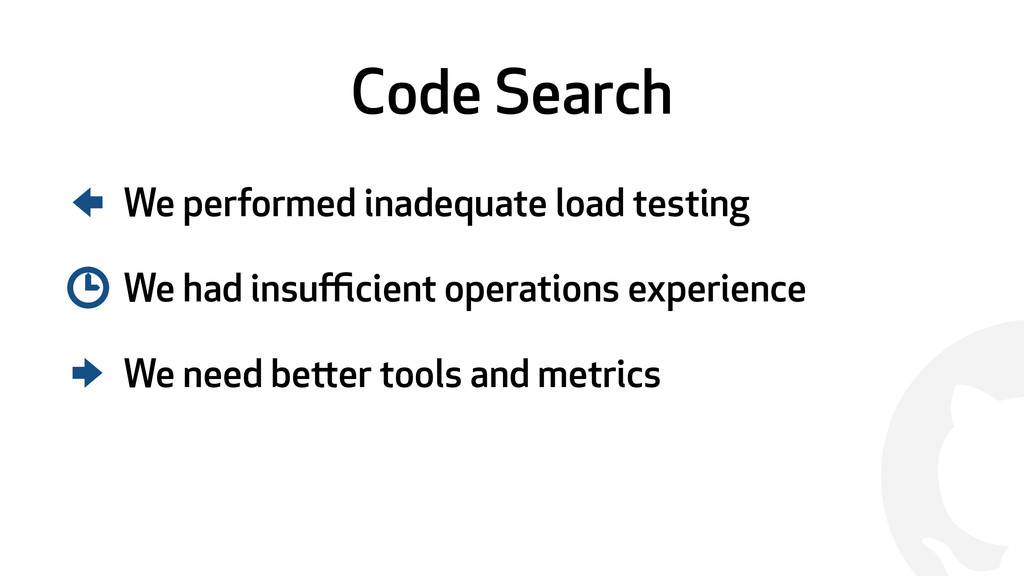
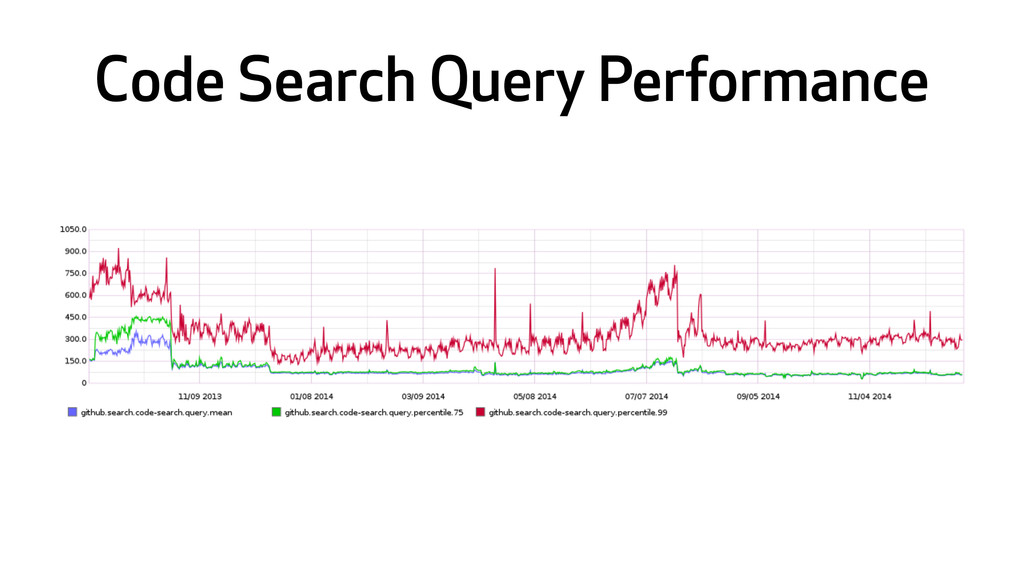
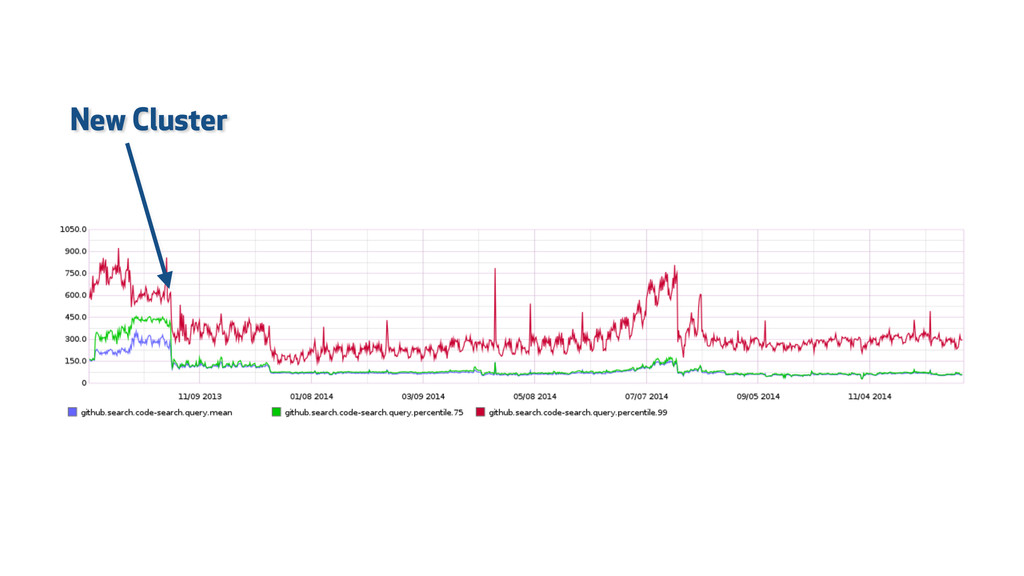
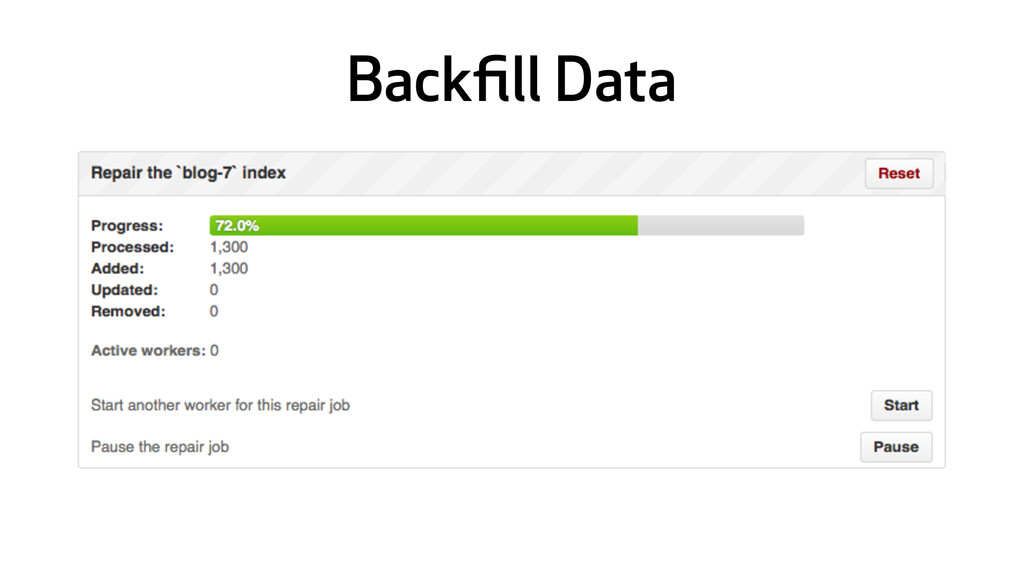
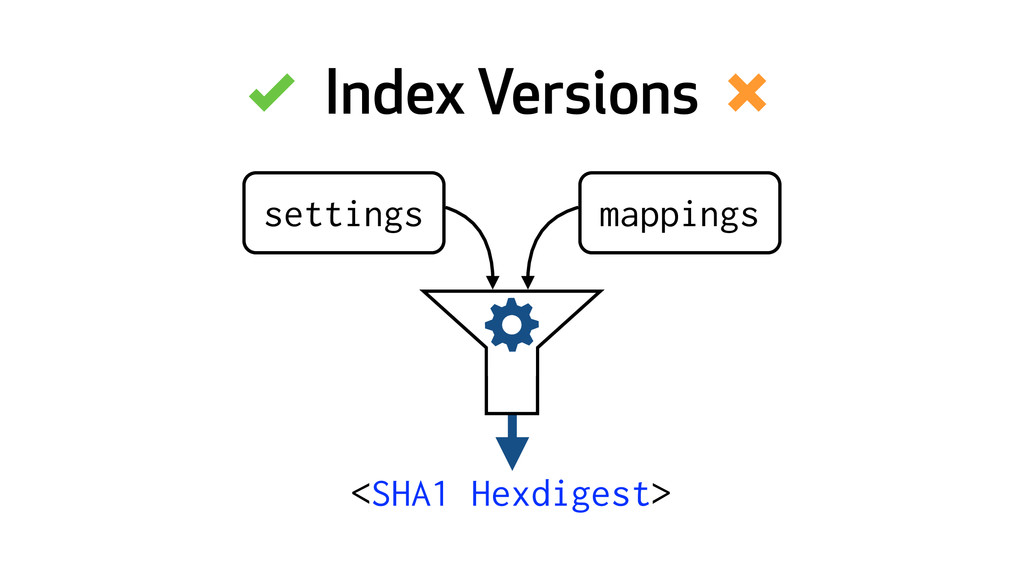
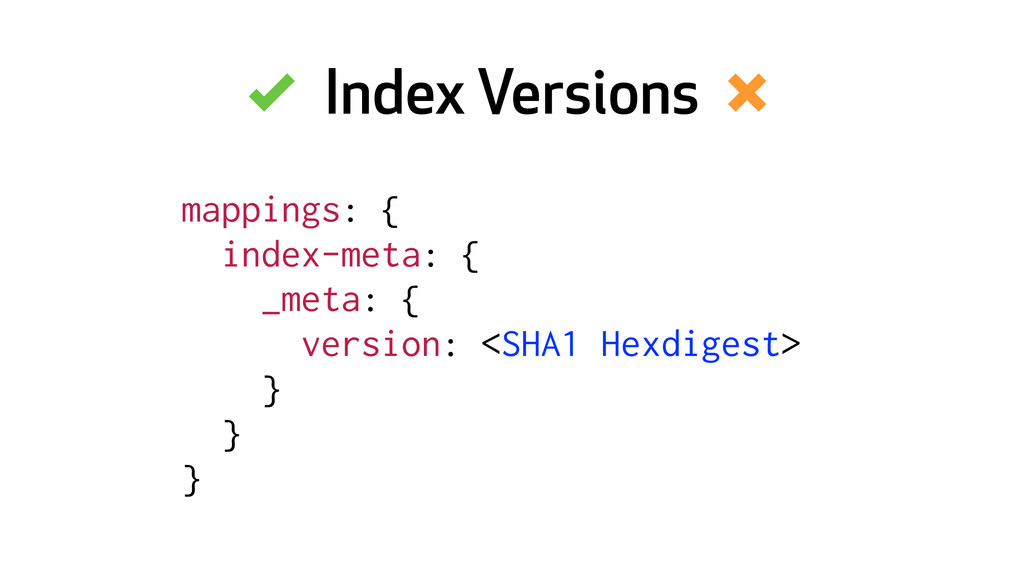
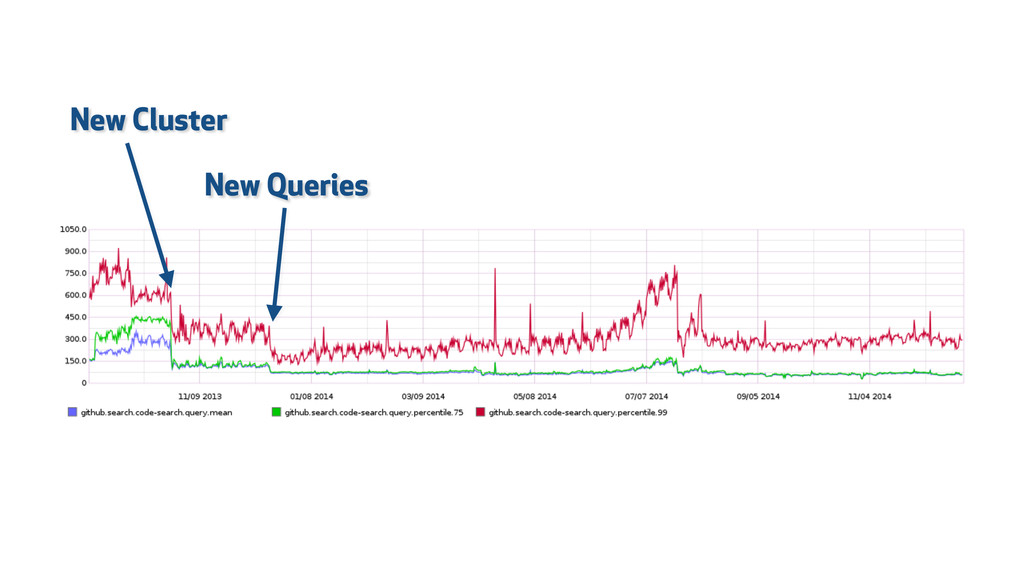
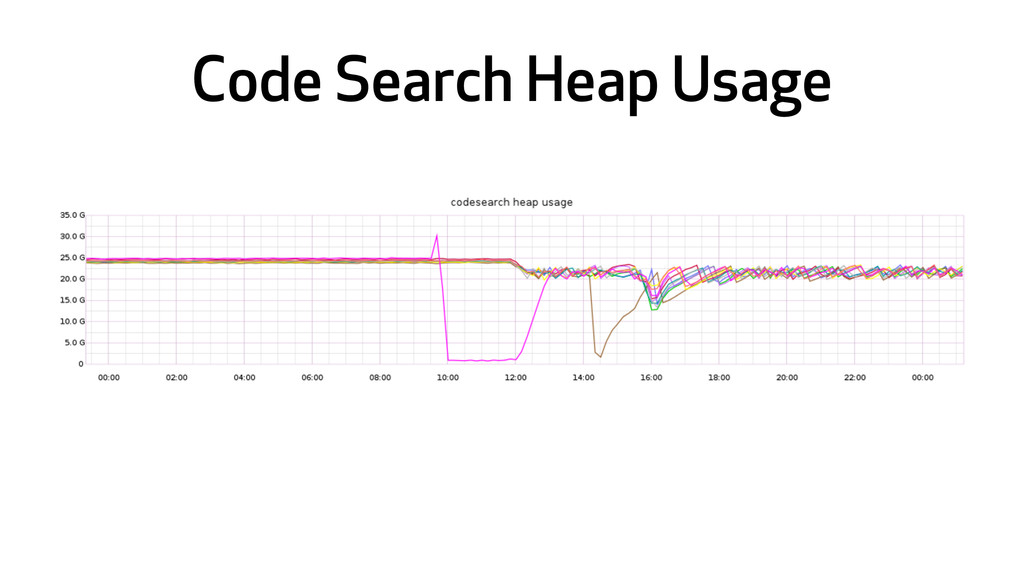
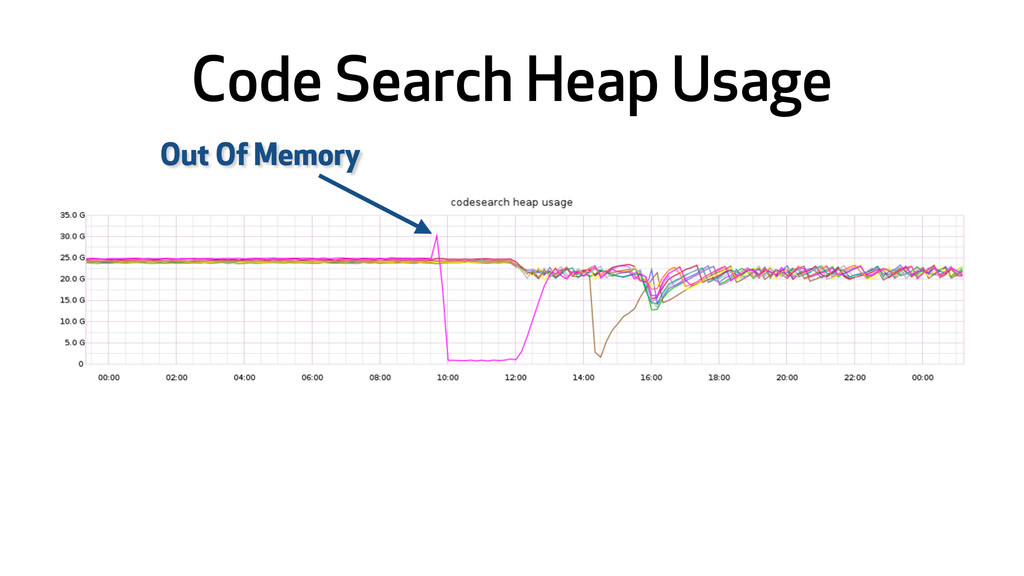
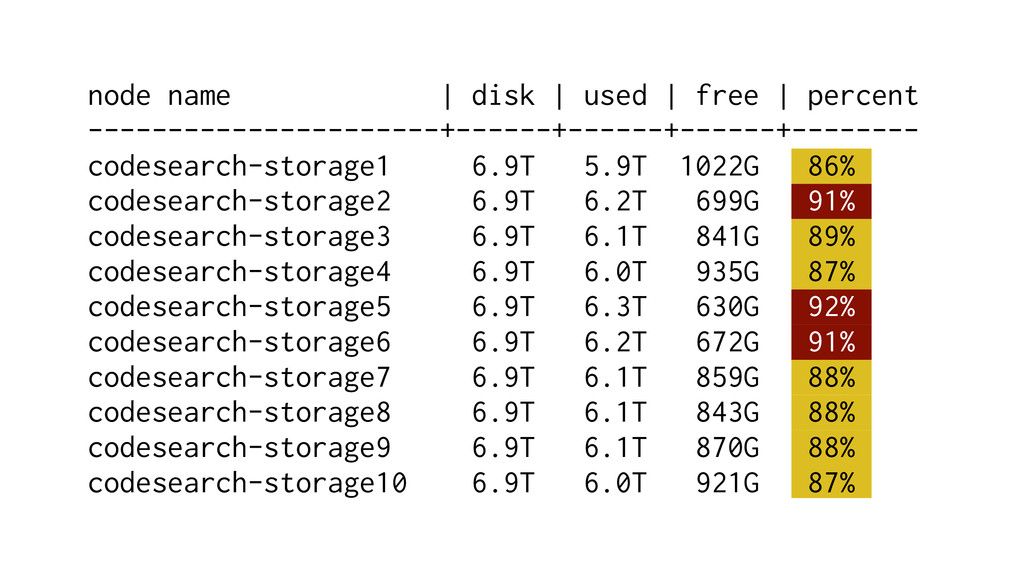
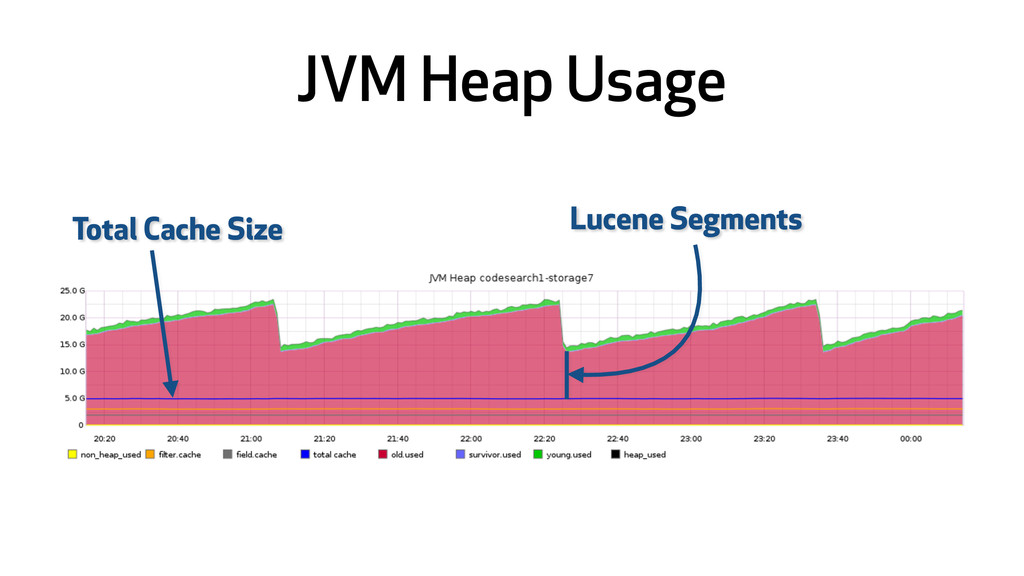
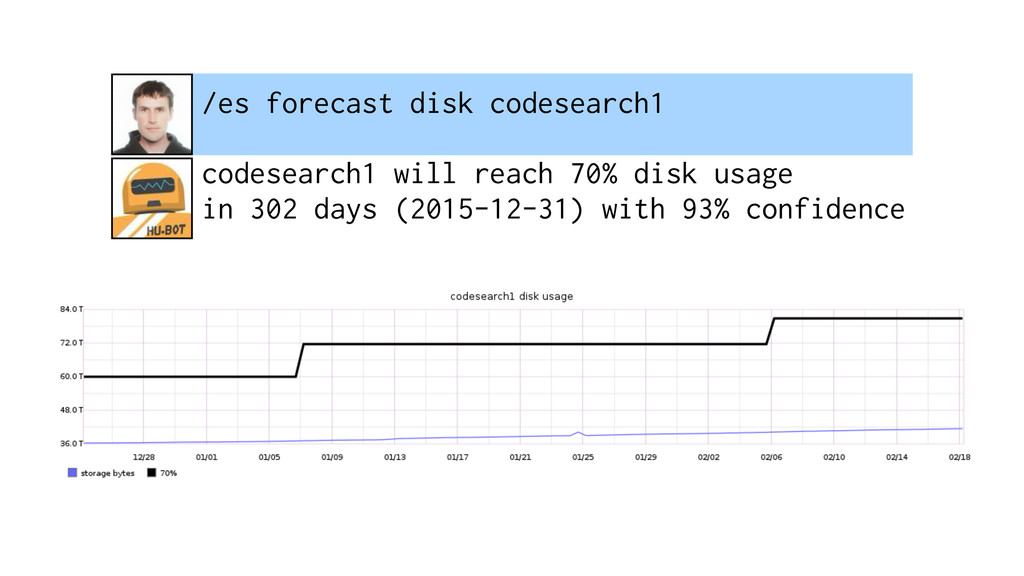
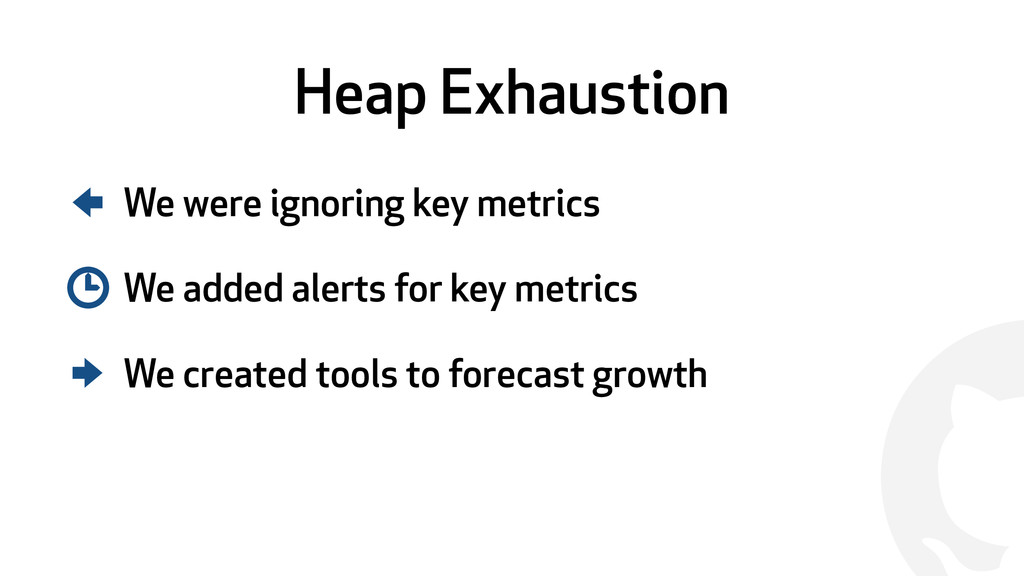
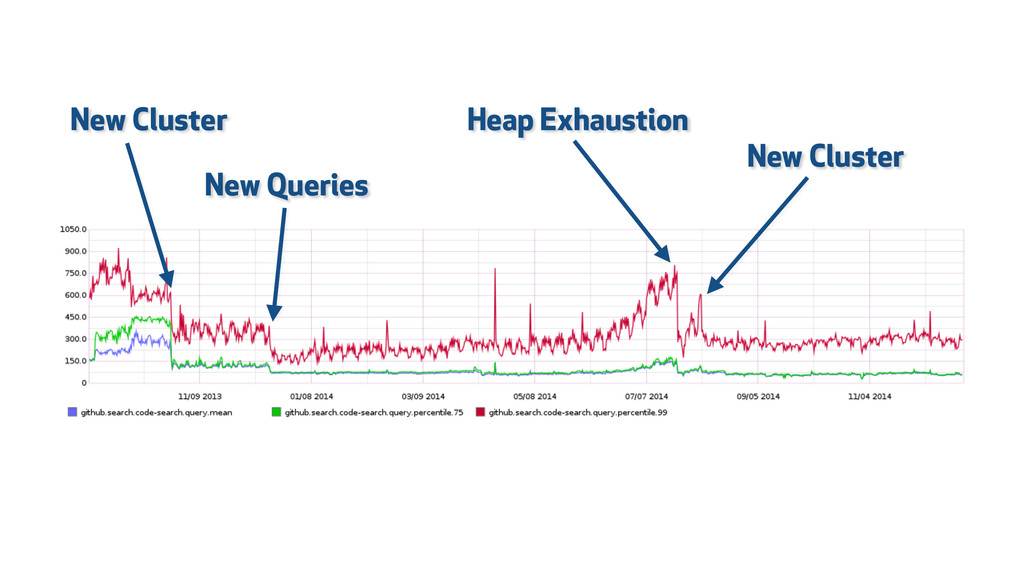
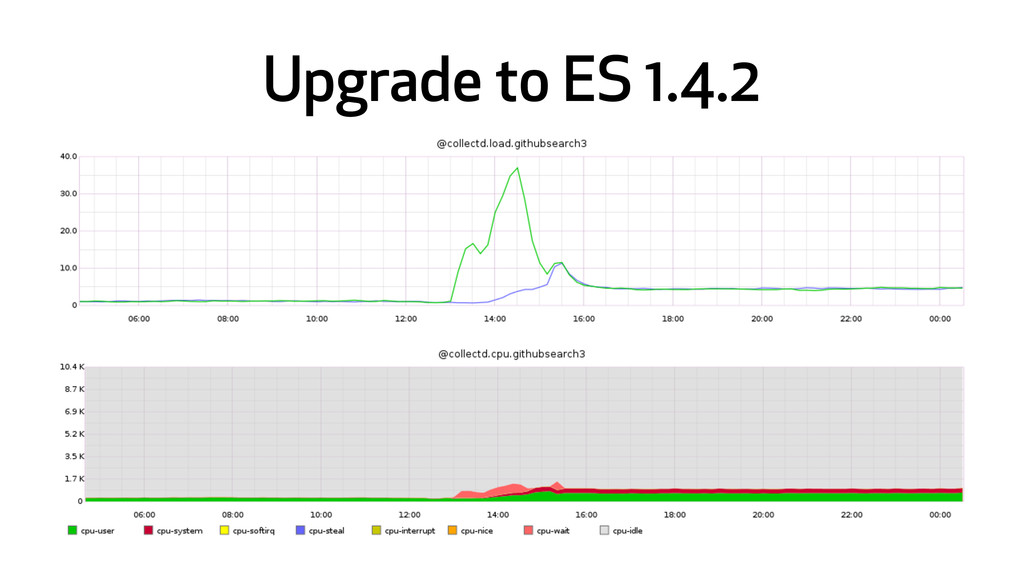
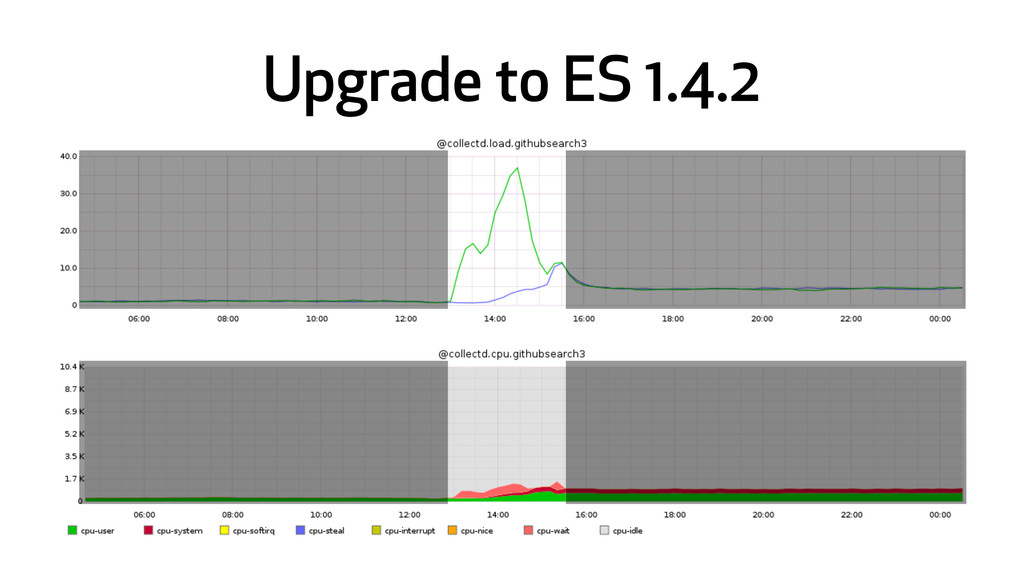
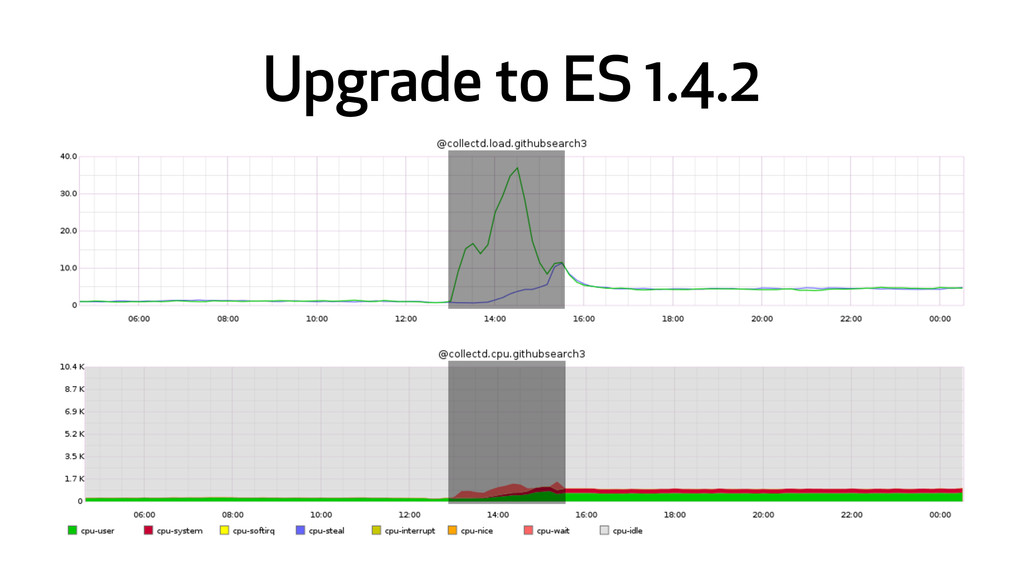
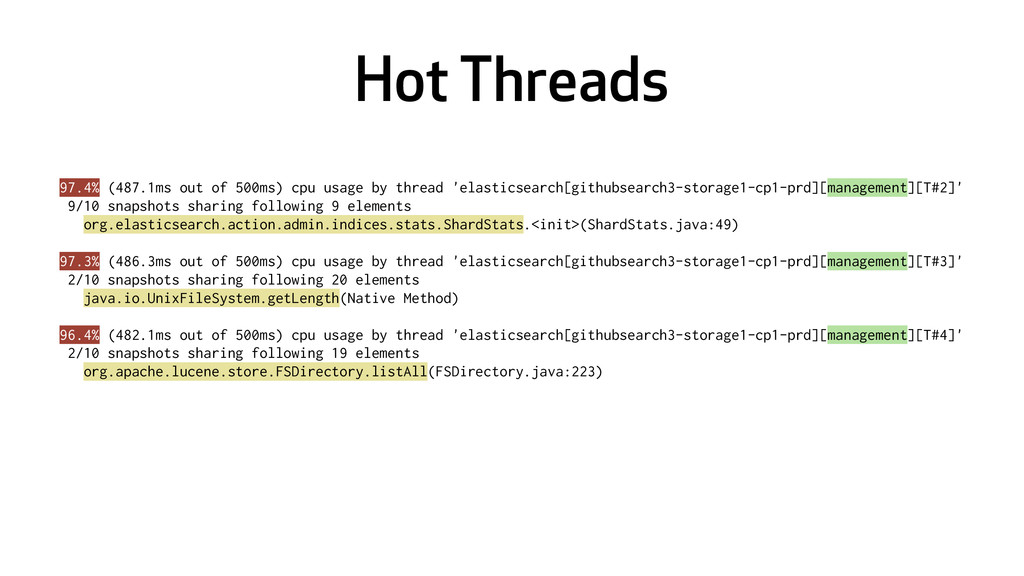
Over the past two years GitHub’s source code search product has grown from a small research project into a very large index containing nearly 4 billion documents. This is an ever changing and continuously growing data set that has presented us with some interesting scaling problems. This talk will cover how they have tackled these scaling problems - from monitoring and alerting, application changes, growing clusters, and tuning Lucene parameters.

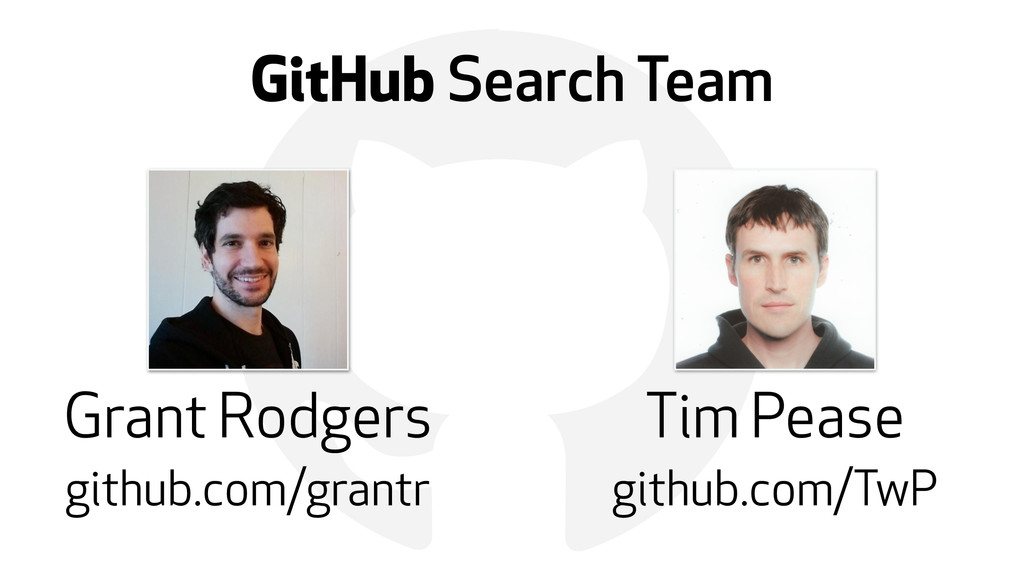
Presented by Tim Pease, GitHub

Elastic Co

March 10, 2015
Tweet

More Decks by Elastic Co

Other Decks in Technology

Transcript

  1. " ‣Where have we come from ‣What we are doing

    now ‣Where we are going # $ %
  2. " ‣We performed inadequate load testing ‣We had insufficient operations

    experience ‣We need better tools and metrics # $ % Code Search
  3. Load Testing require "scientist" def search(query) science "code-search-load-test" do |e|

    e.use { old_index.search(query) } e.try { new_index.search(query) } end end
  4. " ‣We were outgrowing our old cluster ‣We created migration

    tools ‣We used production queries for load testing # $ % New Cluster
  5. { query: {constant_score: { filter: { term: {state: “open"} }

    }} } { query: {match_all: {}}, filter: { term: {state: “open"} } } Tale of Two Queries
  6. " ‣We were able to look at query performance ‣We

    got some education about filters ‣We now enjoy efficient filtered queries # $ % New Queries
  7. node name | disk | used | free | percent

    ----------------------+------+------+------+-------- codesearch-storage1 6.9T 5.9T 1022G 86% codesearch-storage2 6.9T 6.2T 699G 91% codesearch-storage3 6.9T 6.1T 841G 89% codesearch-storage4 6.9T 6.0T 935G 87% codesearch-storage5 6.9T 6.3T 630G 92% codesearch-storage6 6.9T 6.2T 672G 91% codesearch-storage7 6.9T 6.1T 859G 88% codesearch-storage8 6.9T 6.1T 843G 88% codesearch-storage9 6.9T 6.1T 870G 88% codesearch-storage10 6.9T 6.0T 921G 87%
  8. /es forecast disk codesearch1 codesearch1 will reach 70% disk usage

    in 302 days (2015-12-31) with 93% confidence
  9. " ‣We were ignoring key metrics ‣We added alerts for

    key metrics ‣We created tools to forecast growth # $ % Heap Exhaustion
  10. Hot Threads 97.4% (487.1ms out of 500ms) cpu usage by

    thread 'elasticsearch[githubsearch3-storage1-cp1-prd][management][T#2]' 9/10 snapshots sharing following 9 elements org.elasticsearch.action.admin.indices.stats.ShardStats.<init>(ShardStats.java:49) 97.3% (486.3ms out of 500ms) cpu usage by thread 'elasticsearch[githubsearch3-storage1-cp1-prd][management][T#3]' 2/10 snapshots sharing following 20 elements java.io.UnixFileSystem.getLength(Native Method) 96.4% (482.1ms out of 500ms) cpu usage by thread 'elasticsearch[githubsearch3-storage1-cp1-prd][management][T#4]' 2/10 snapshots sharing following 19 elements org.apache.lucene.store.FSDirectory.listAll(FSDirectory.java:223)
  11. " ‣We were missing some important metrics ‣We have an

    entire ecosystem ‣We have confidence in ES 1.4.2 # $ % Upgrade to ES 1.4.2
  12. " ‣Where have we come from ‣What we are doing

    now ‣Where we are going # $ %
  13. Where are we going /es forecast disk codesearch1 codesearch1 will

    reach 70% disk usage in 302 days (2015-12-31) with 93% confidence % %