Upgrade to Pro — share decks privately, control downloads, hide ads and more …

Verizon is Managing Security 700M Events at a Time

Elastic Co
October 06, 2015

Verizon is Managing Security 700M Events at a Time

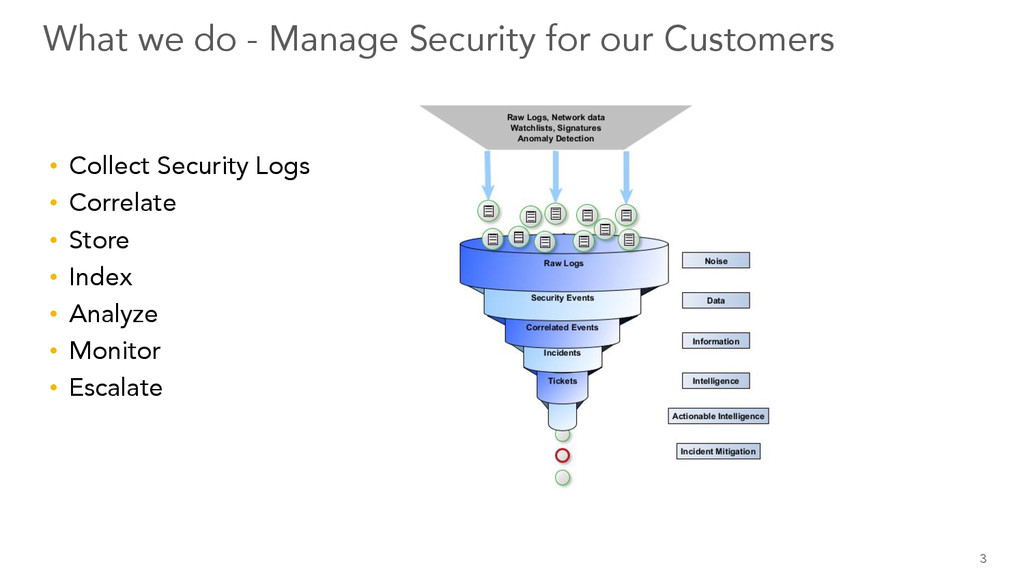
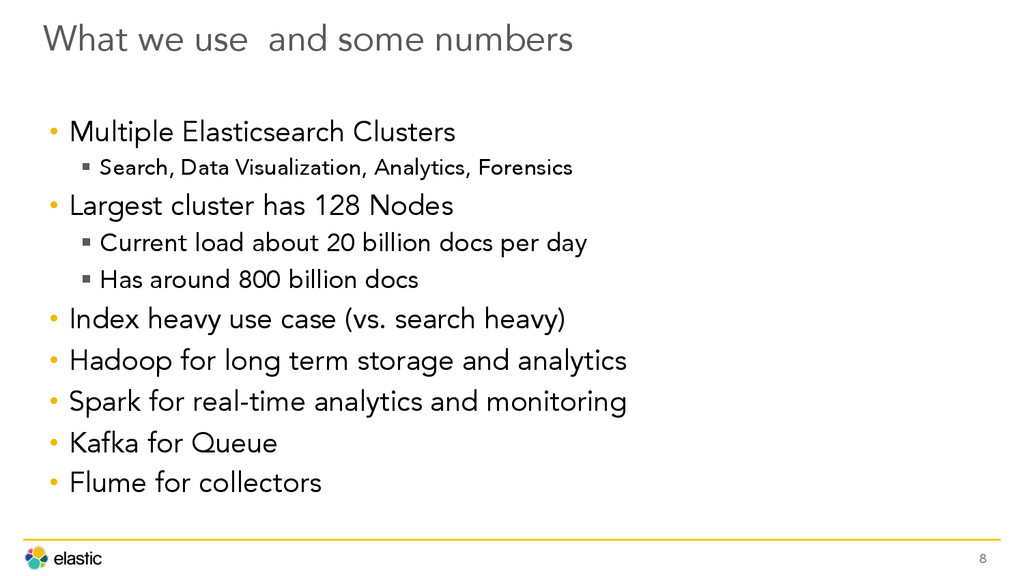
Verizon Managed Security Services (MSS) manages security for our customers dealing with security data collected from firewalls, ids/ips, proxy, and network/backbone. This presentation focuses on lessons learned, problems solved, and solutions implemented while running one of largest Elasticsearch clusters out there. Topics include architecture, investigation of various use cases, and best practices while dealing with 1M events per second and 20B events a day.

Elastic Co

October 06, 2015
Tweet

More Decks by Elastic Co

Other Decks in Technology

Transcript

  1. Introduction •  Senior Big Data Engineer, Tech. Lead @ Verizon

    §  Managed Security Services •  Using Elasticsearch since ver 0.19 •  Aspiring Data Scientist - Who is not ? •  Loves to work with data at scale 2
  2. What we do - Manage Security for our Customers • 

    Collect Security Logs •  Correlate •  Store •  Index •  Analyze •  Monitor •  Escalate 3
  3. Before Elasticsearch •  Traditional RDBMS won’t scale for the billions

    of logs §  filtered logs > events > incidents > tickets •  All raw Logs were on disks •  Requests from customers took days, weeks •  No way to search through billions of Logs •  Advanced analytics not possible 5 h$p://www.li,offit.com    
  4. After Elasticsearch •  Customers §  have access to all their

    logs near real-time J §  can search and download their logs through the Portal §  visualize/analyze using Kibana •  Operations §  No more grep through disks J •  Opens up the data for all kind of Analytics and Monitoring §  Anomaly detection §  Real-time alerting §  Advanced monitoring 6
  5. What we use and some numbers •  Multiple Elasticsearch Clusters

    §  Search, Data Visualization, Analytics, Forensics •  Largest cluster has 128 Nodes §  Current load about 20 billion docs per day §  Has around 800 billion docs •  Index heavy use case (vs. search heavy) •  Hadoop for long term storage and analytics •  Spark for real-time analytics and monitoring •  Kafka for Queue •  Flume for collectors 8
  6. How we progressed •  Earlier §  Co-located with 28 Hadoop

    Data nodes §  12 Core, 128GB RAM, 12 X 3TB Disks §  Elasticsearch 0.19 •  Later §  Ran 2 Elasticsearch Nodes co-located with Hadoop data nodes §  Effectively 56 Elasticsearch Nodes •  Now §  128 dedicated bare metal boxes for Elasticsearch §  8 core, 64GB RAM, 6 X 1TB Disks §  Elasticsearch 1.5.2 (soon to ver 1.7) 9
  7. Know your environment and data •  ENV §  CPU § 

    Memory §  I/O §  Network •  Elasticsearch typically runs in to Memory issues before CPU §  Get the CPU – RAM – Disk ratios correct for your env. §  Too much disk storage – ES may not utilize •  For data nodes prefer physical boxes •  For disks – SSD, RAID0, JBOD 10
  8. Know your environment and data •  Data §  Data ingestion

    rates §  Type of data o Our docs were mostly 1.5k – 2k, rarely 5k o 10% of the customers produced 80% of data o Variety of data §  Volume 11
  9. Storage requirements •  Depends on §  volume §  replication factor

    §  _all §  _source §  analyzed §  doc_values §  _timestamp 12
  10. Things you should change •  change default location of data

    and logs •  change cluster.name •  avoid multicast use unicast •  discover timeouts adjust per your network •  use mapping/templates §  plan your field types number, date, ipv4 •  adjust gateway, discovery, threadpool, recovery settings •  adjust throttling settings •  evaluate breakers •  to analyze or not to 13
  11. Things you should change 14 •  JVM Heap set to

    50% of available memory §  Leave 50% for OS, page caching §  Elasticsearch/Java tends to have issues after 31GB heap •  Disable _all, _timestamp, _source if you don't need it •  No swap - mlockall: true, vm.swappiness = 0 or 1 •  Tune kernel parameters §  file, network, user, process §  vm.max_map_count = 262144 §  /sys/kernel/mm/transparent_hugepage/defrag = never §  10G network tweaks
  12. Dedicated Master, Client, Data Nodes •  Master §  Only cluster

    management (don’t send search or indexing requests) §  3 masters minimum §  Avoid split-brain •  Client §  Coordinators, Aggregation (send all search requests here, will co-ordinate) §  Load balance behind Apache, Nginx, F5 … •  Data nodes §  Indexing, Searches (send all indexing requests direct to data nodes) •  Use Tribe node to search across multiple clusters 15
  13. Effects of shards, replication, indexes on Cluster •  Replication factor

    §  More replicas – searches faster, but more memory pressure §  We had factor 2 initially, later changed to 1 •  Shards §  More shards - better indexing rates, but more memory pressure §  We had 2 per index initially, later as per customer 2 – 35 shards •  Index/Shard sizes •  Number of indexes (one big one, monthly, daily, weekly, hourly …) •  Index naming – performance, access control, data retention, shard size •  Know your data and plan shards and replicas 16
  14. Field data cache 17 •  When you do - sorting,

    facets/aggregation with high cardinality fields §  All unique values are loaded to memory and held on to §  never goes away •  Risks running out of memory §  indices.breaker.fielddata.limit §  indices.fielddata.cache.size •  Use doc_values - writes to a columnar store side of the inverted index §  lives on disk instead of in heap memory (storage, indexing small effect) §  for not_analyzed fields §  default in Elasticsearch 2.0
  15. Indexing •  Use Bulk Indexing §  We use mapreduce, about

    60 - 100 reducers do the indexing §  flush size, find your sweet spot (ours is 5000) §  index.refresh_interval: -1 §  Transport client - tcp vs http client, tcp slightly faster §  Increase thread pool for bulk and adjust merge speed •  More shards better indexing, but watch cluster •  Watch out for Bulk Rejections and Hotspots •  Index direct to data nodes •  Now es-hadoop available 18
  16. Key items for extremely large clusters 19 •  Manage shard

    sizes and counts (including replicas) •  Hotspots - adjust shards per node •  Some Nodes/disks getting full §  adjust disk.watermark low/high settings •  Disk failures (especially when you have multiple disks, striping) §  remove disk from config and restart Node •  Set replication to 0 and adjust throttling for initial Bulk inserts •  Disable allocation for faster restarts •  Adjust throttling settings for recovery and indexing •  Elasticsearch shard is a Lucene index, max docs 2.1 billion
  17. Watch out for 20 •  Use Aliases from Day 1

    •  _type §  use generic - minimize dynamic updating of mappings •  Template dir., all files will be picked up •  Scripting and Updates a bit slow, use carefully •  Node failures •  Disk failures •  Bulk Rejections •  Network timeouts •  ttl performance issues
  18. Monitor and Stats 21 •  Cluster and Node health/stats • 

    Heap •  Stats: clear view on what is going on in your cluster §  intake volumes, when received at edge, when indexed, index rate •  Lots of APIs available for cluster/node health, stats •  Watch for hotspots – nodes, disks •  Watch for safety trips (from ES 1.4 onwards) •  Nagios, Zabbix, custom •  Housekeeping - Use curator or custom •  Use Marvel, Watcher
  19. Get ready for production •  Difficult to recreate production volumes

    in Dev/QA •  Plan a buffering or queuing mechanism •  Be ready to Re-index §  We had data in HDFS for a year and in ES for 6 months •  Monitor and Alert §  With hundreds of machines/disks, something is bound to fail •  Stats §  Find bottle necks, Project storage/processing needs •  Sharing a single config for same Node type helps •  Use automation as much as possible – Puppet, Ansible 22
  20. Security & Access control •  Plan index per customer • 

    Use Aliases •  Control access via APIs •  Use a reverse proxy Apache, Nginx §  Authentication/Authorization §  Client nodes behind proxy •  Now Shield available 23
  21. Tips on Searches 24 •  Use Filters, they are cached

    •  Use match query instead of query_string •  term is not analyzed, match is analyzed •  For large search results – Use Scan search type and Scroll API