Upgrade to Pro — share decks privately, control downloads, hide ads and more …

Data Visualization Tools in the Age of AI

Sponsored · Your Podcast. Everywhere. Effortlessly. Share. Educate. Inspire. Entertain. You do you. We'll handle the rest.

Data Visualization Tools in the Age of AI

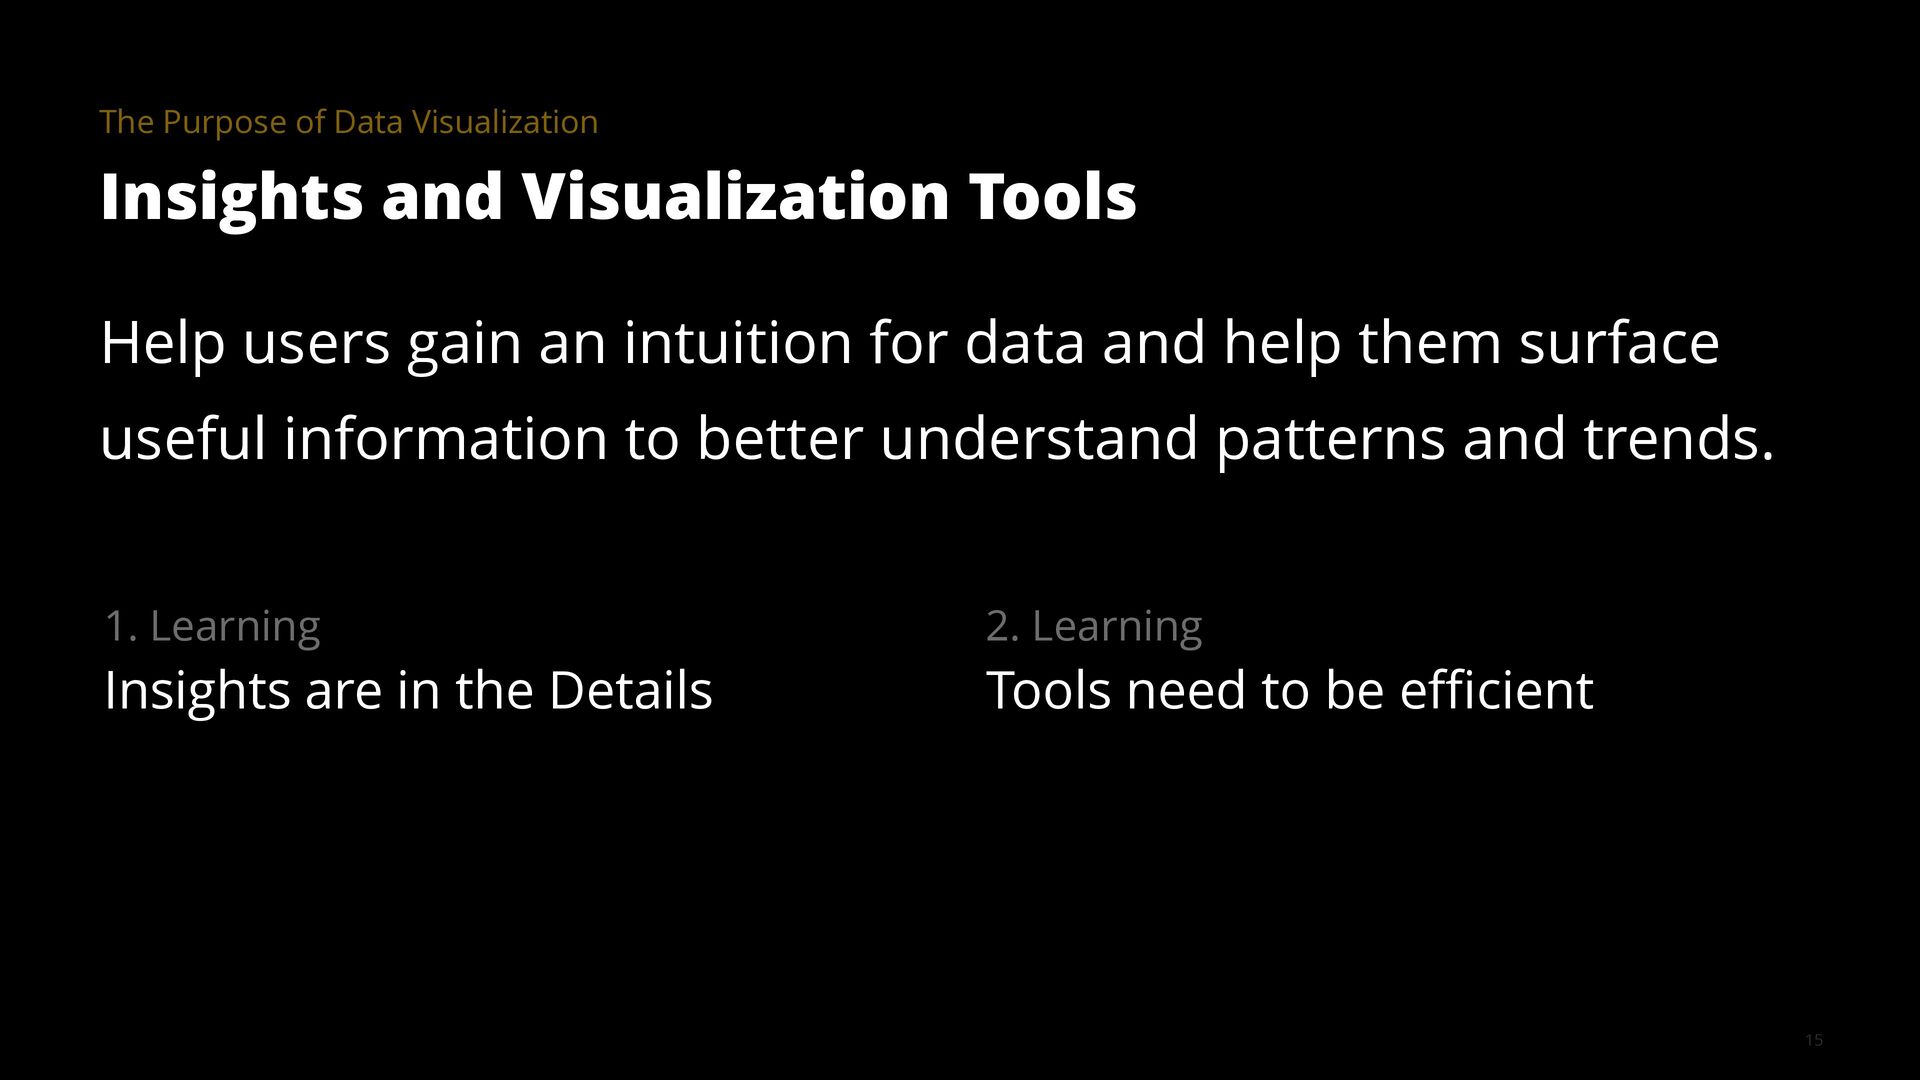
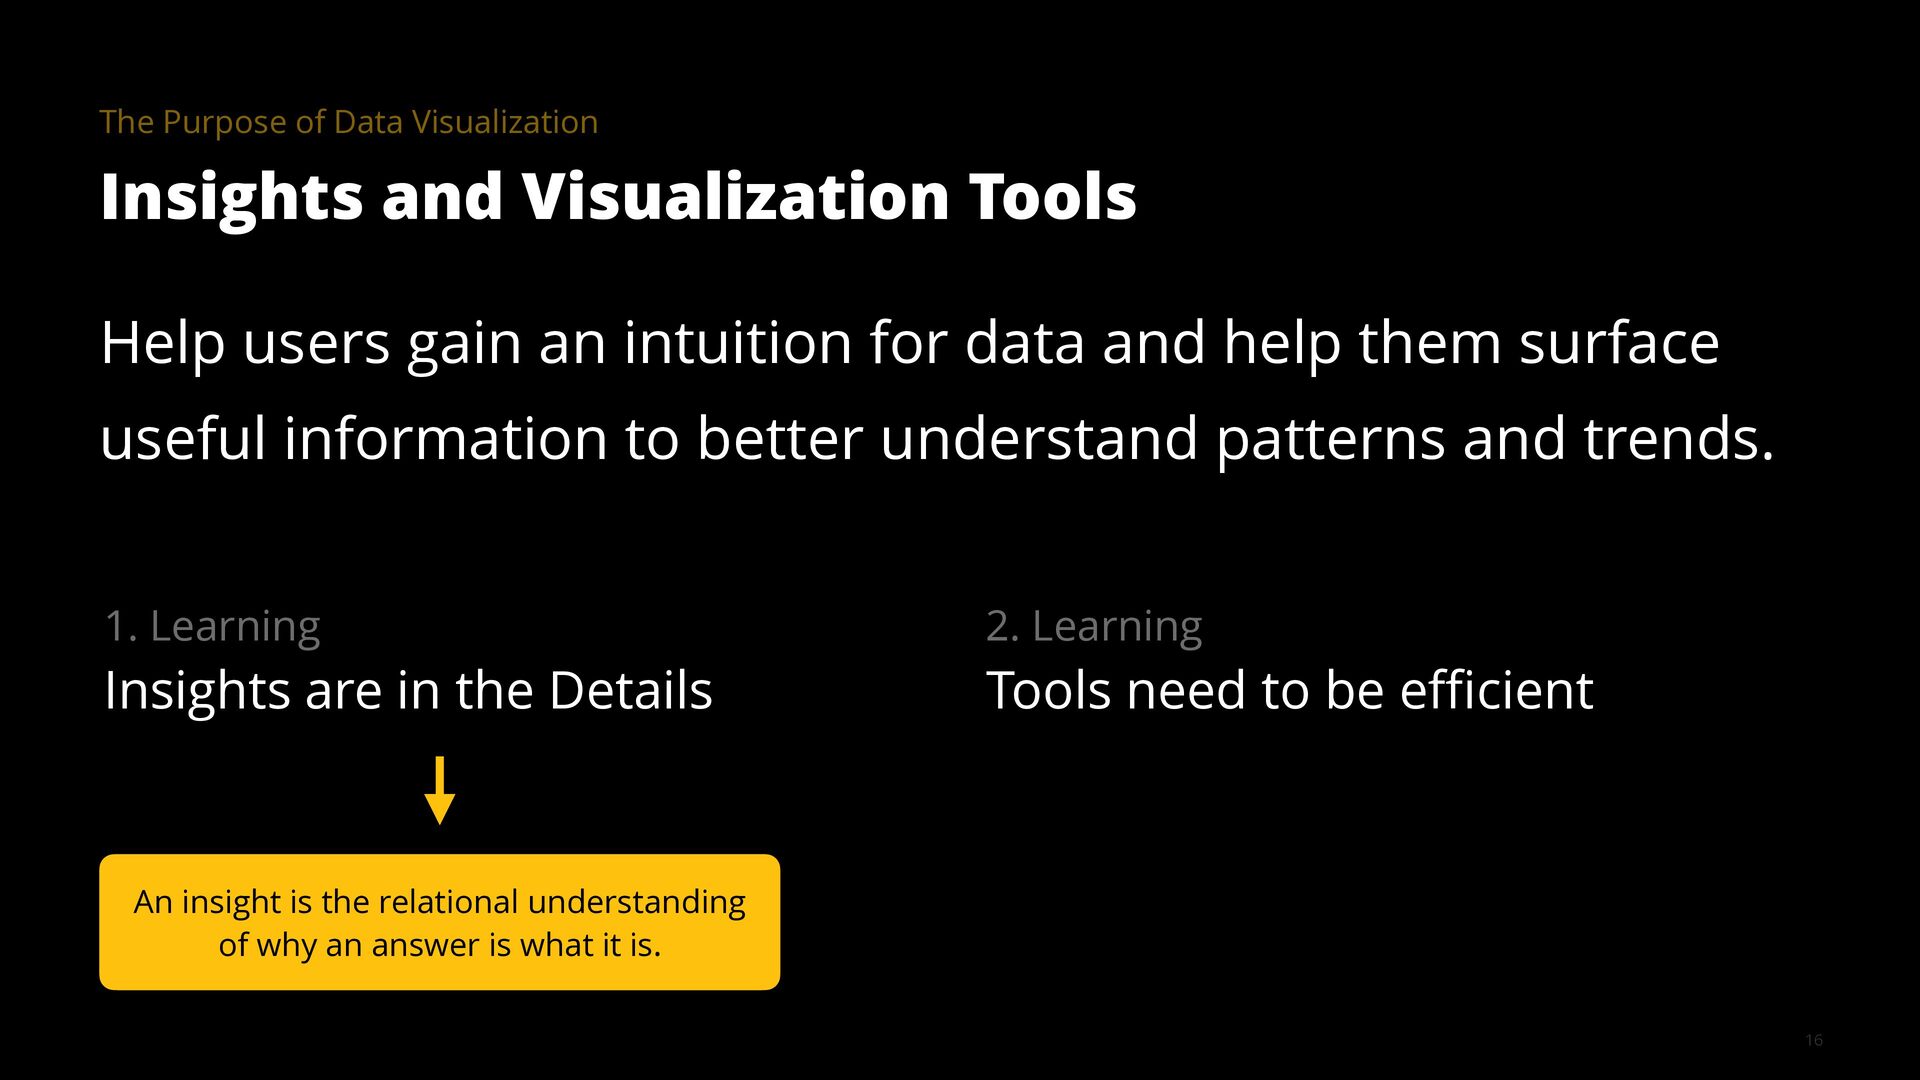
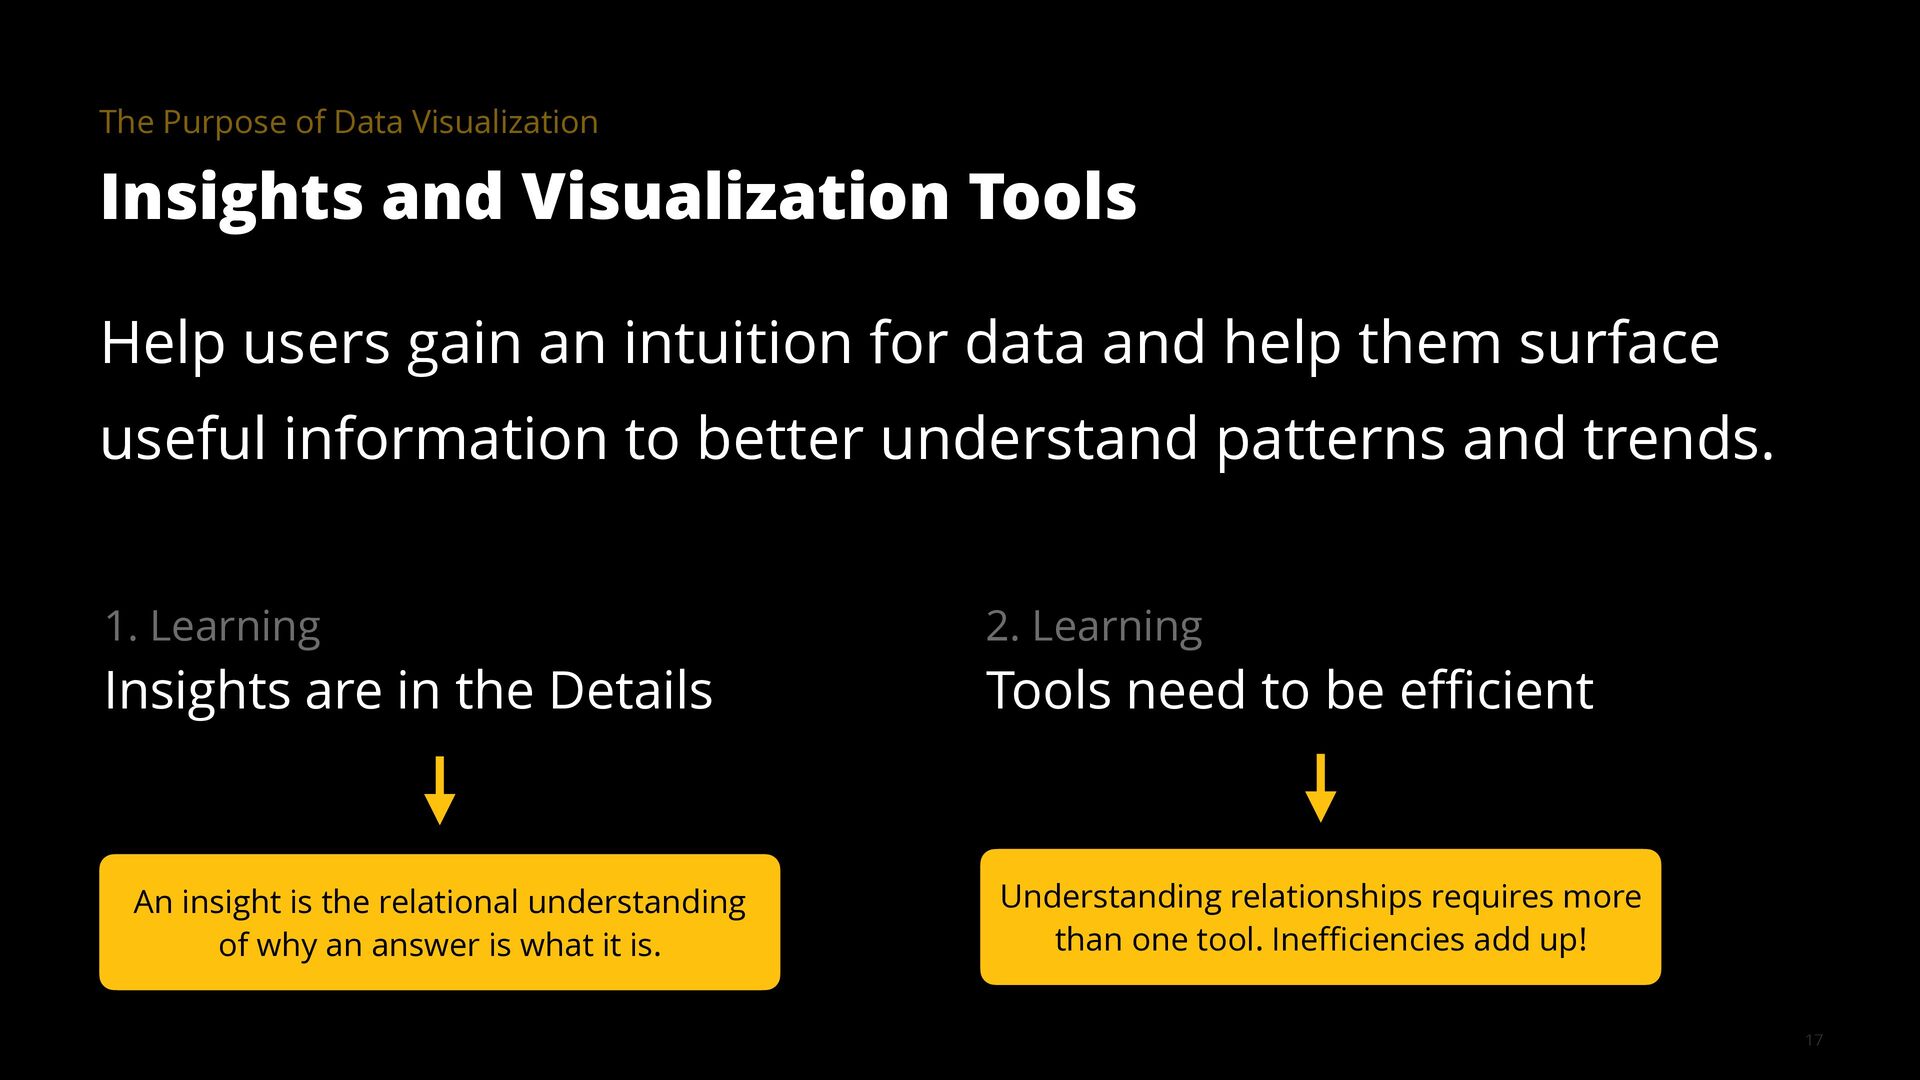
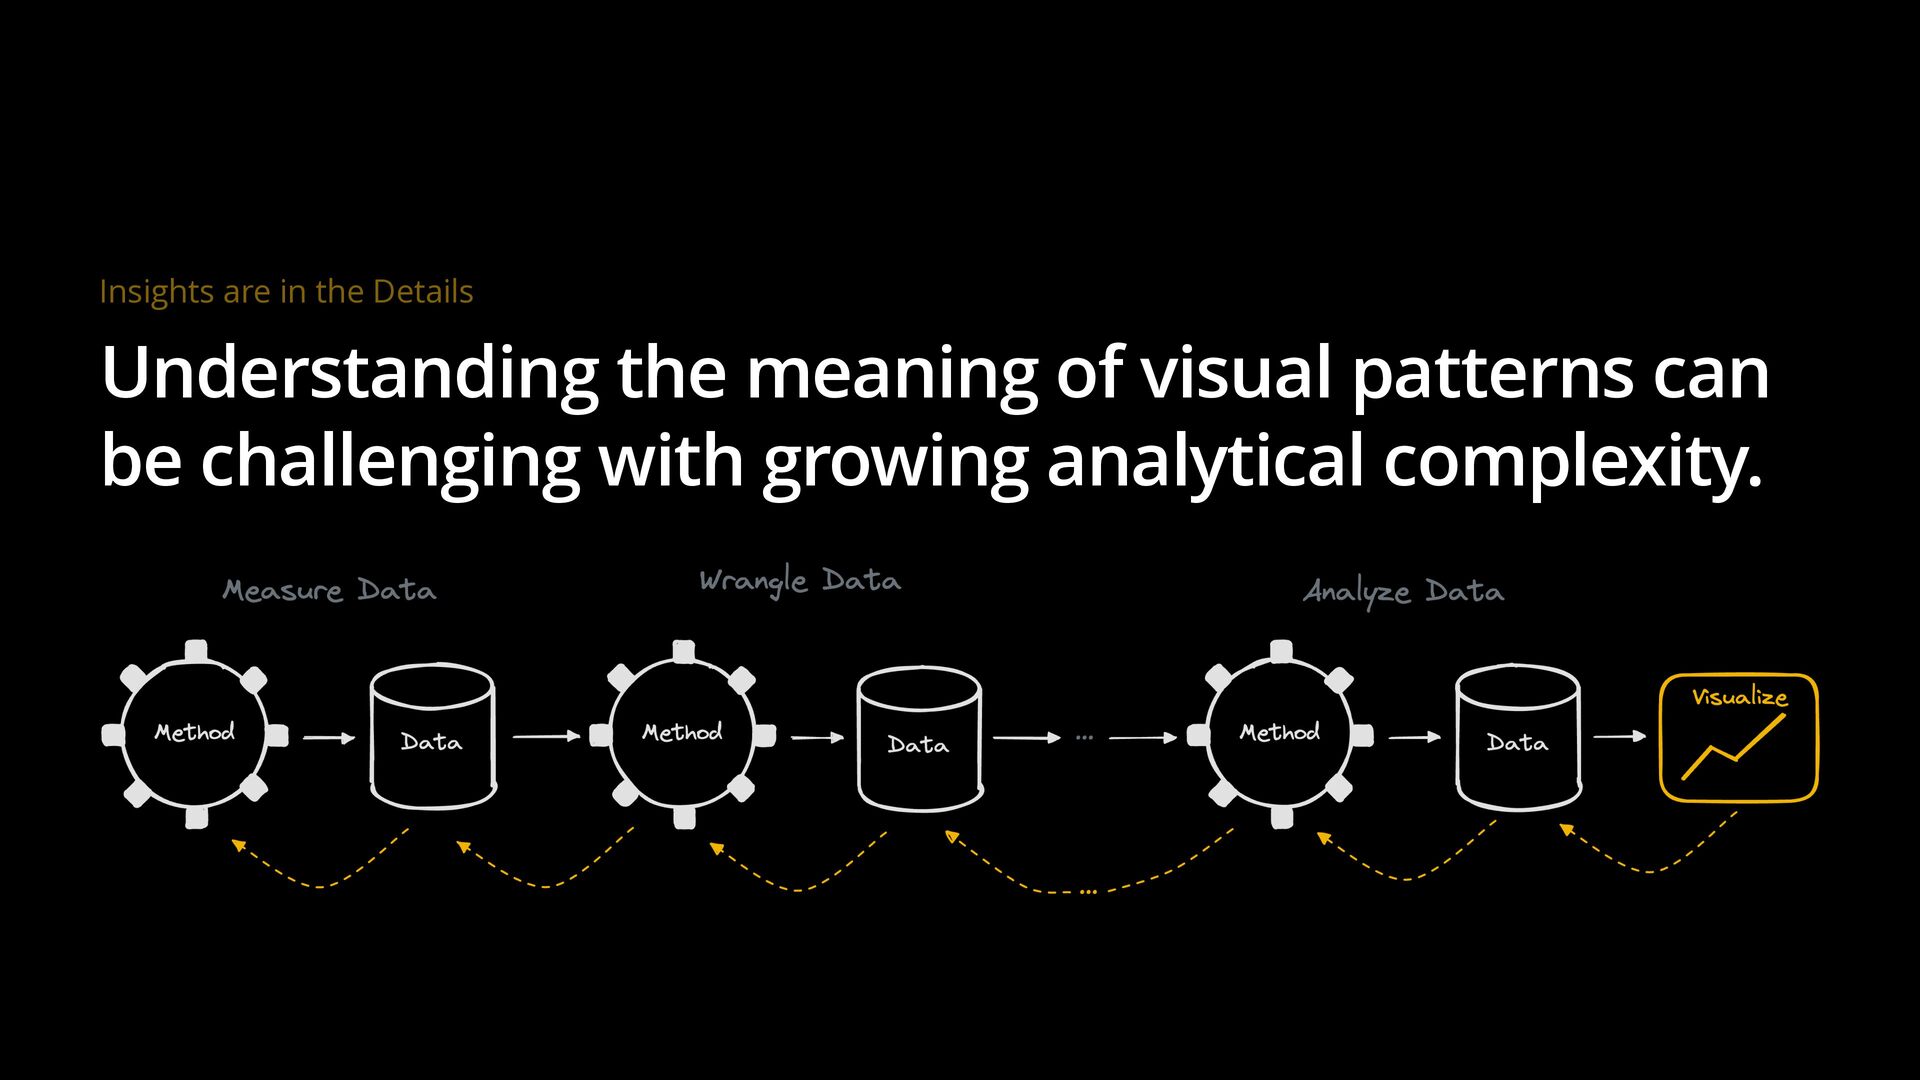
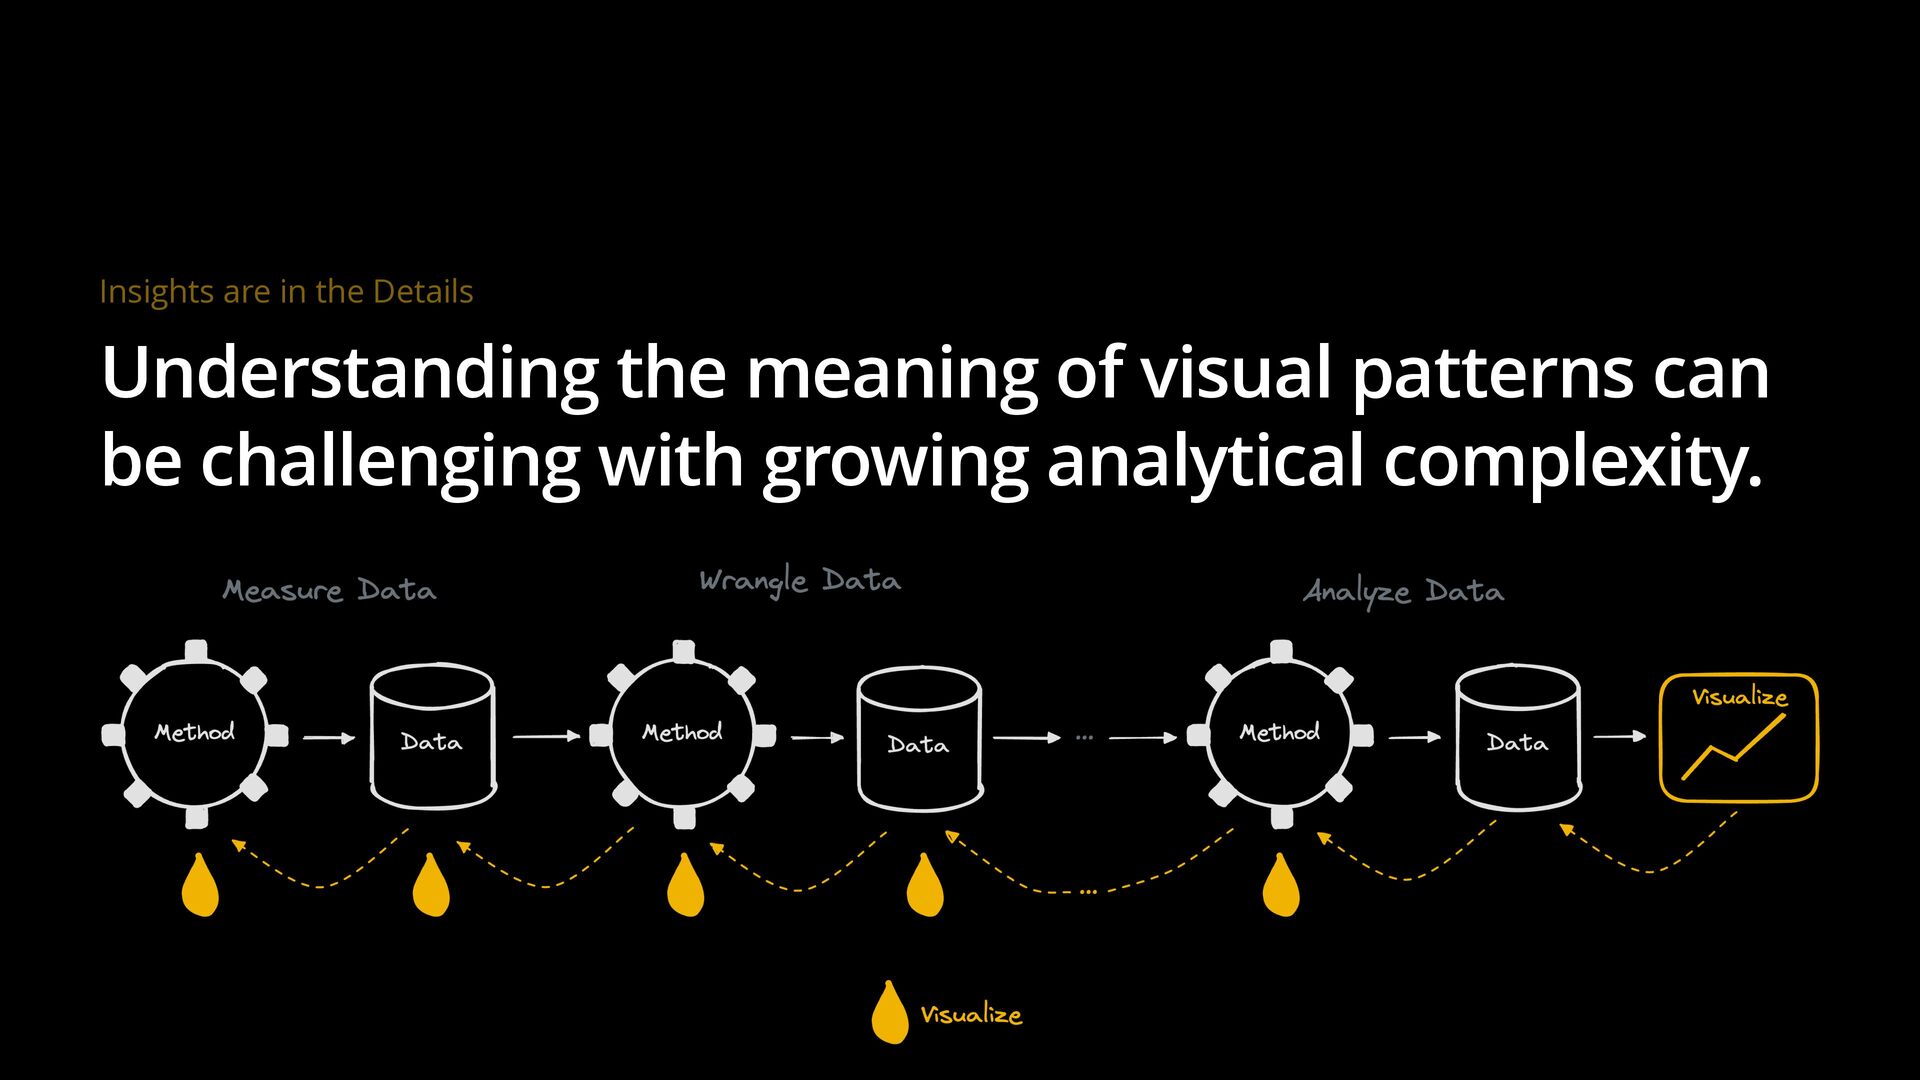
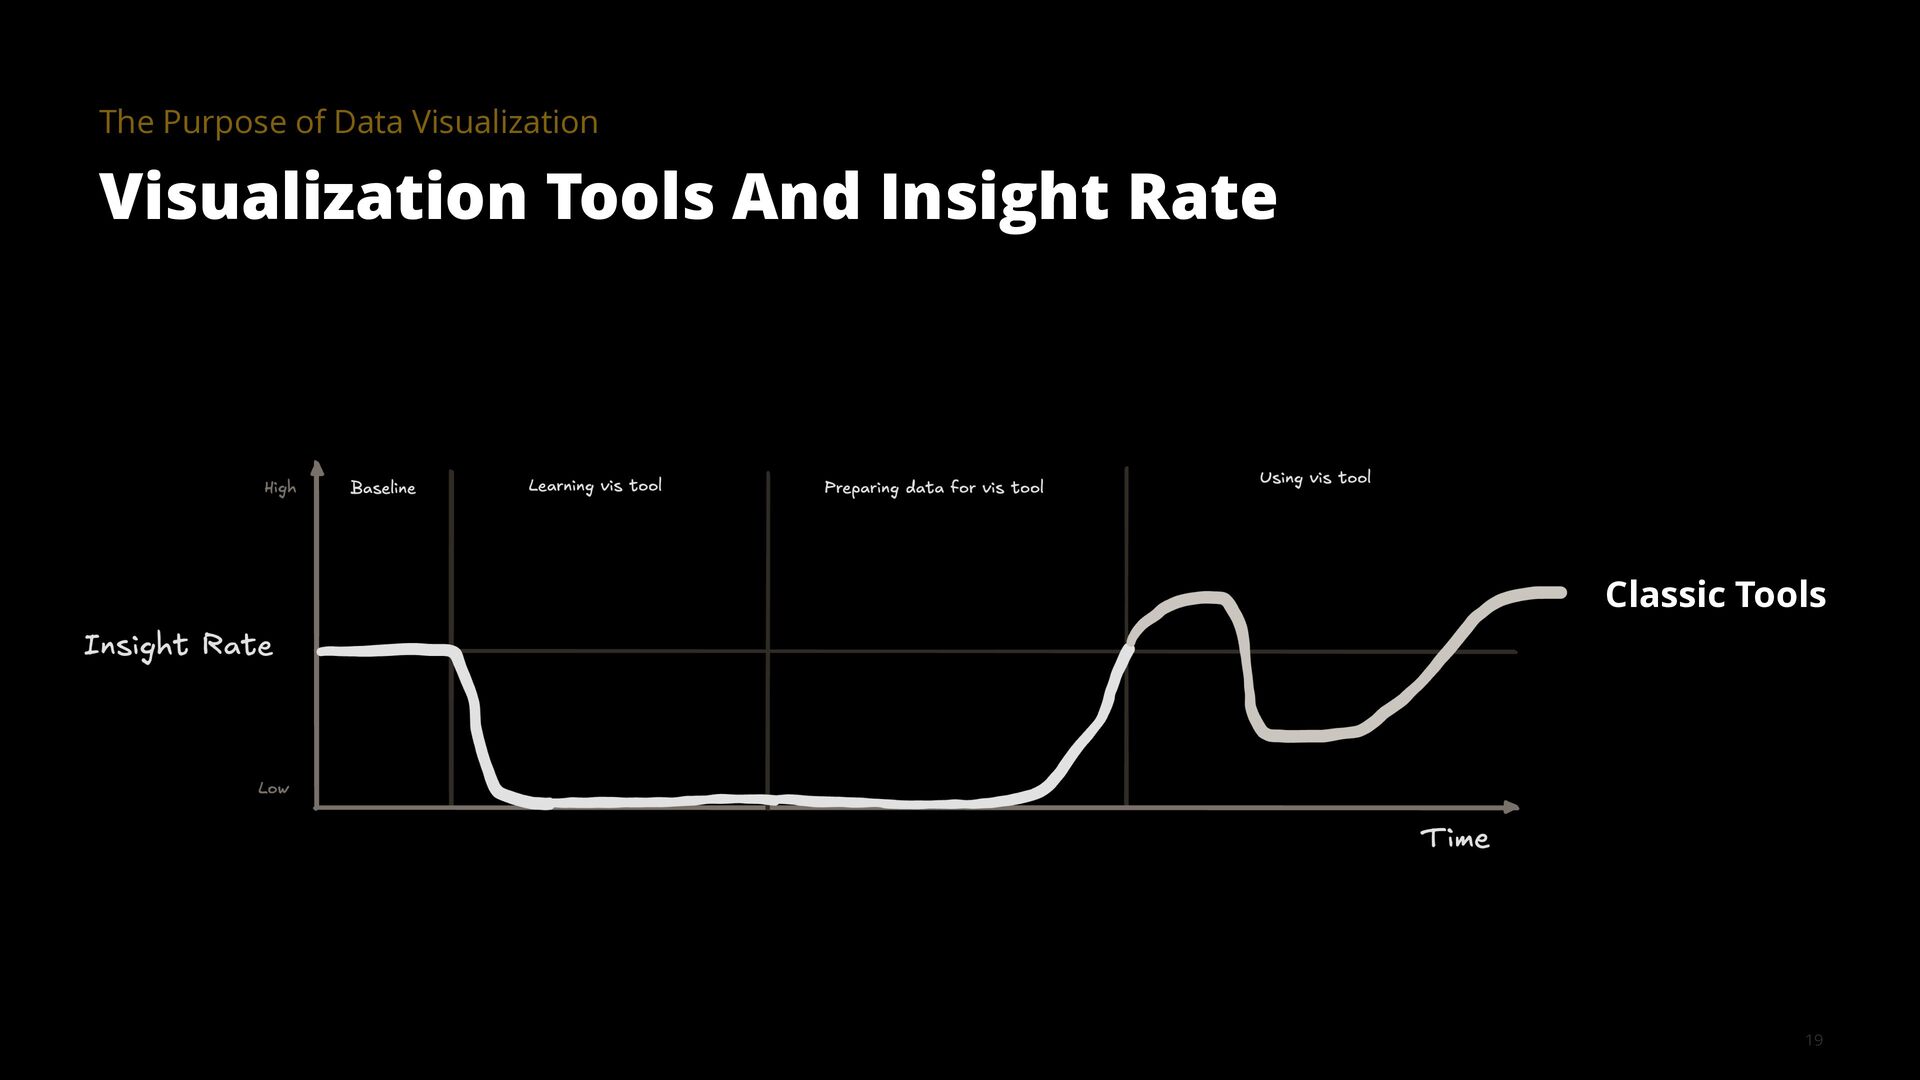
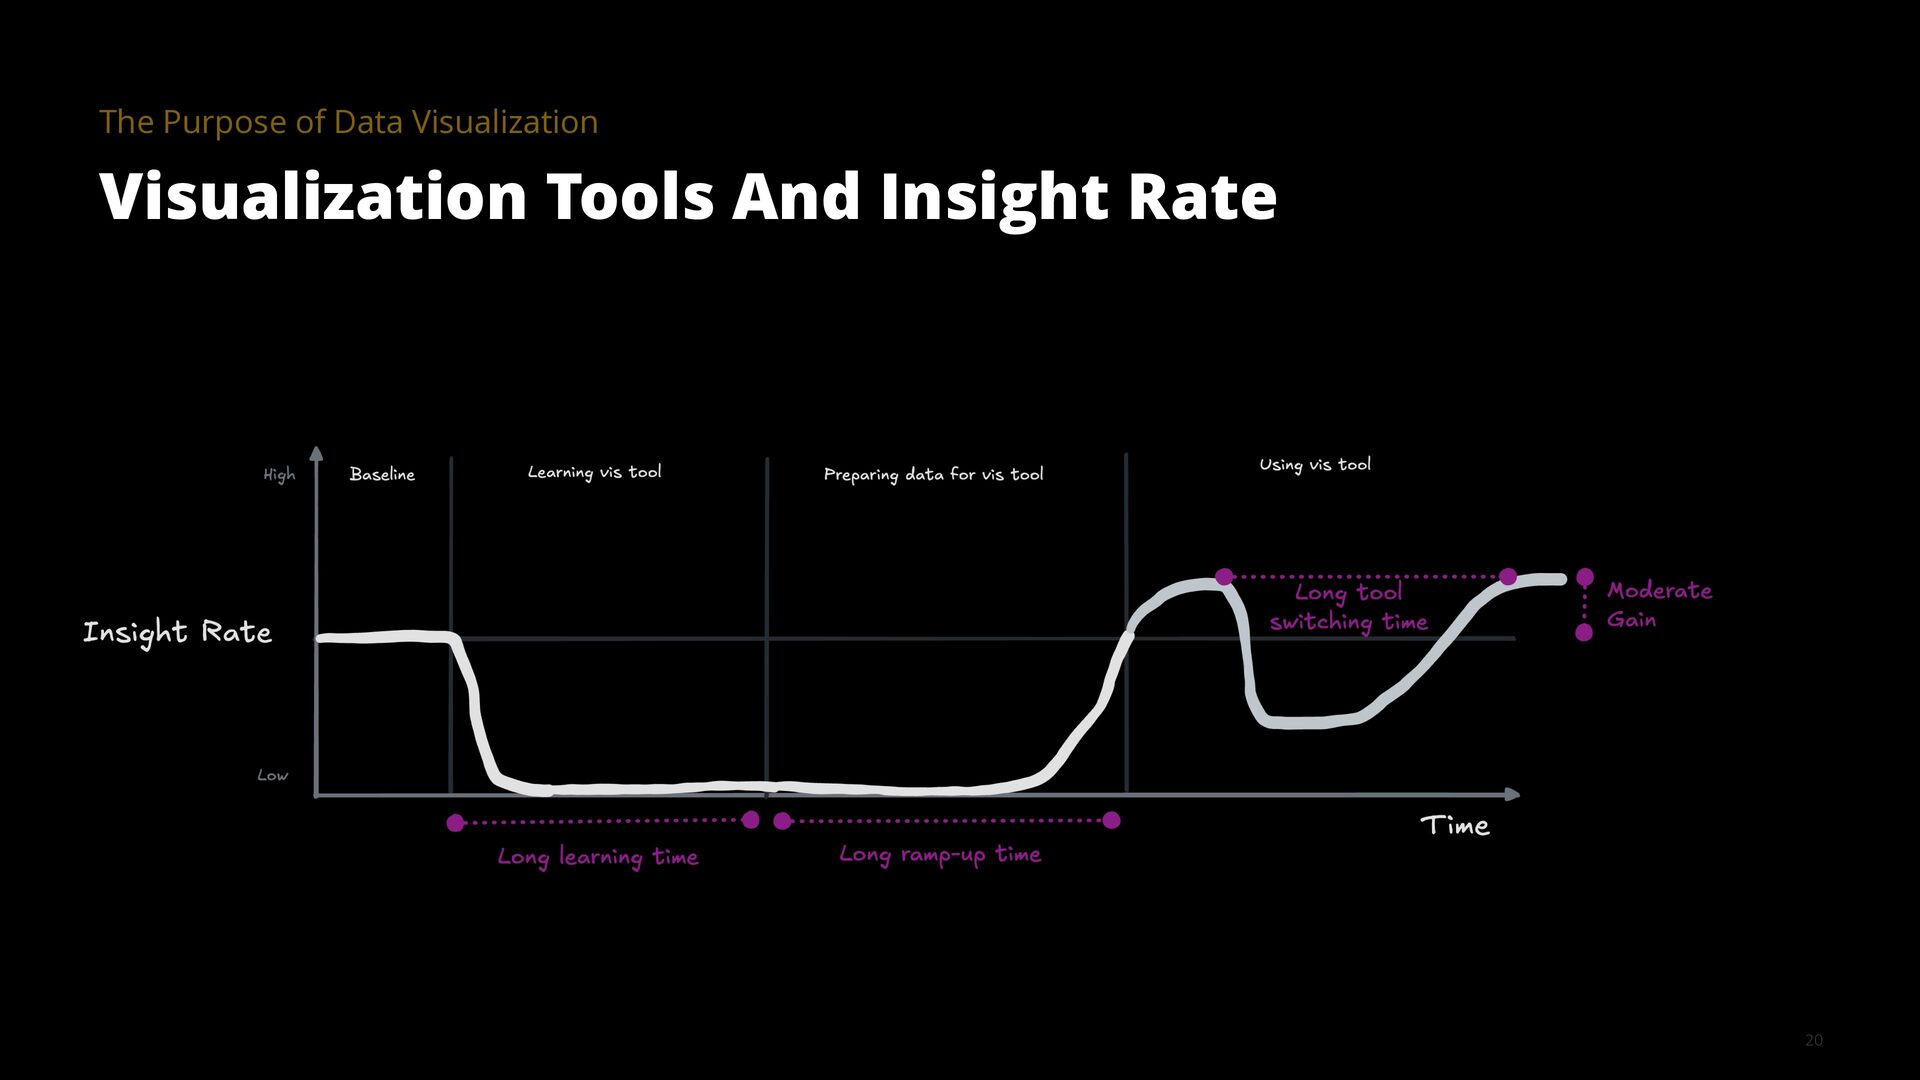
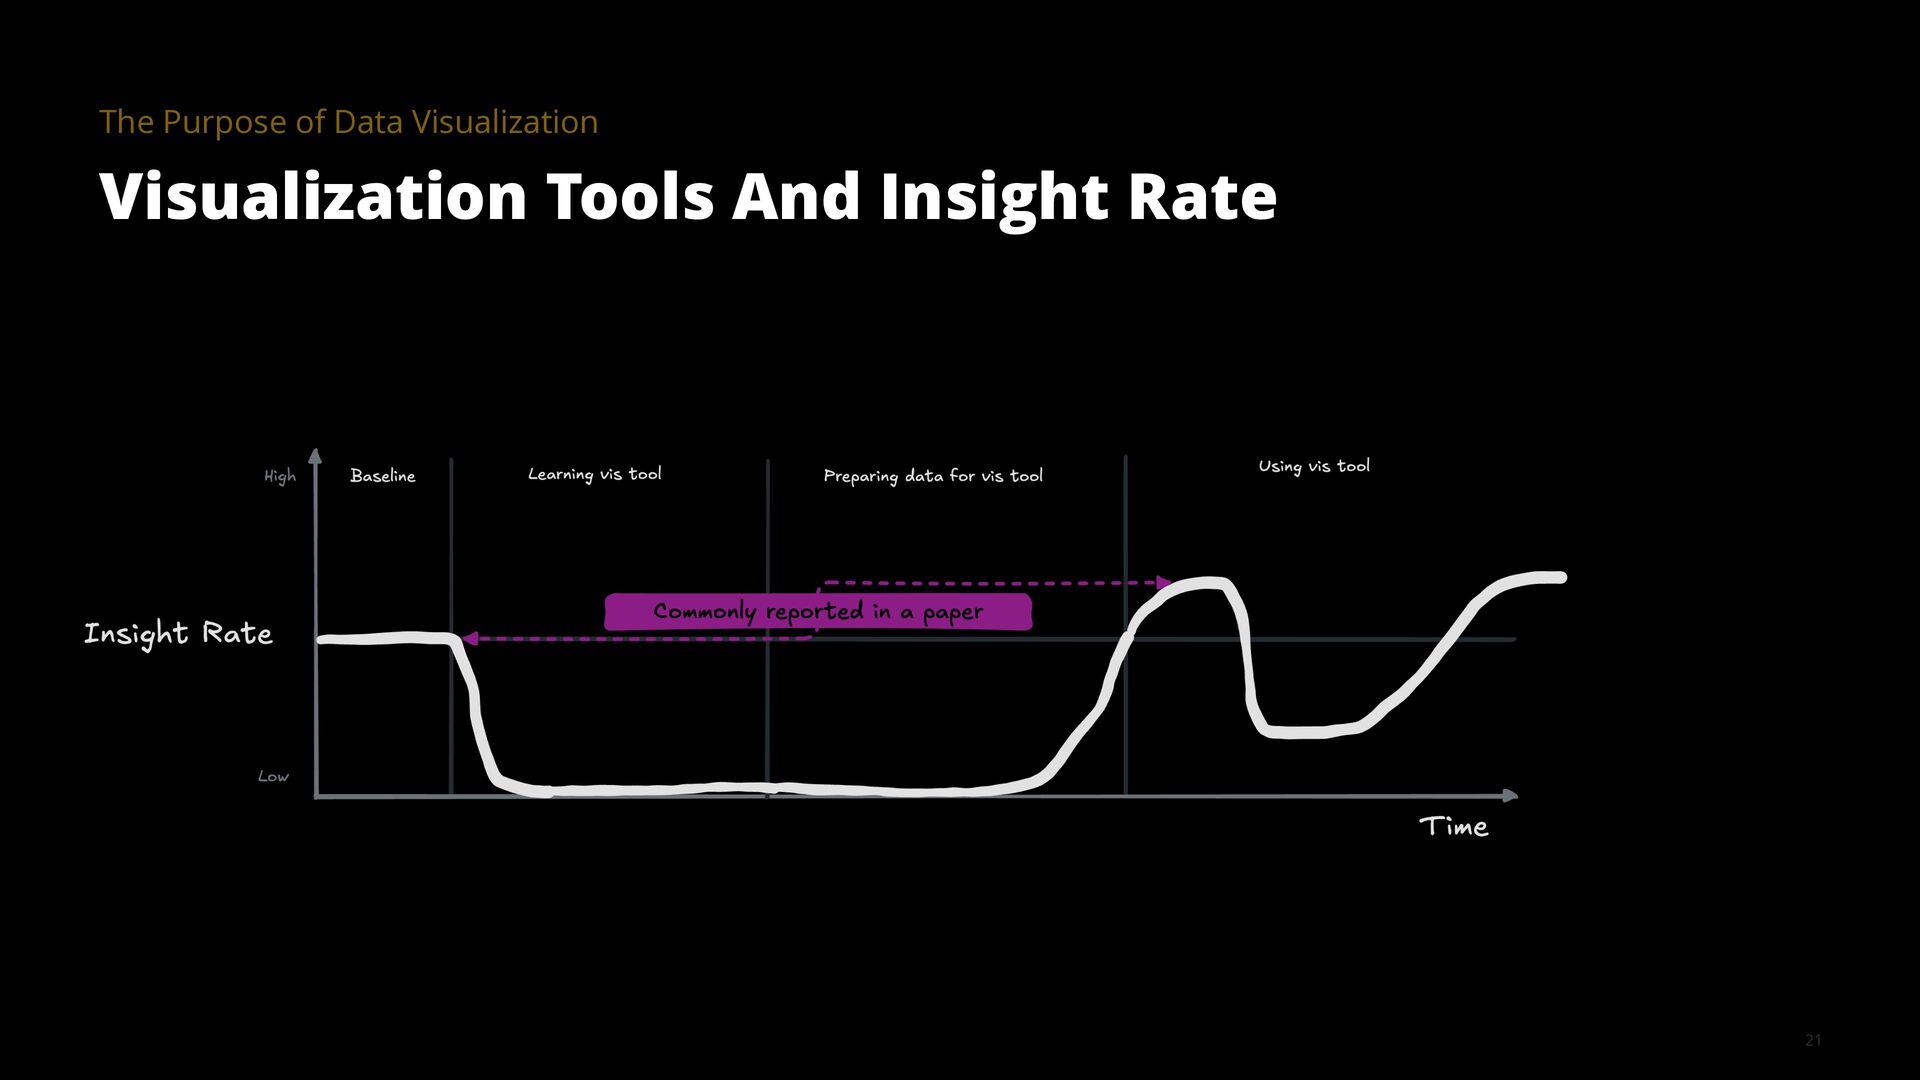
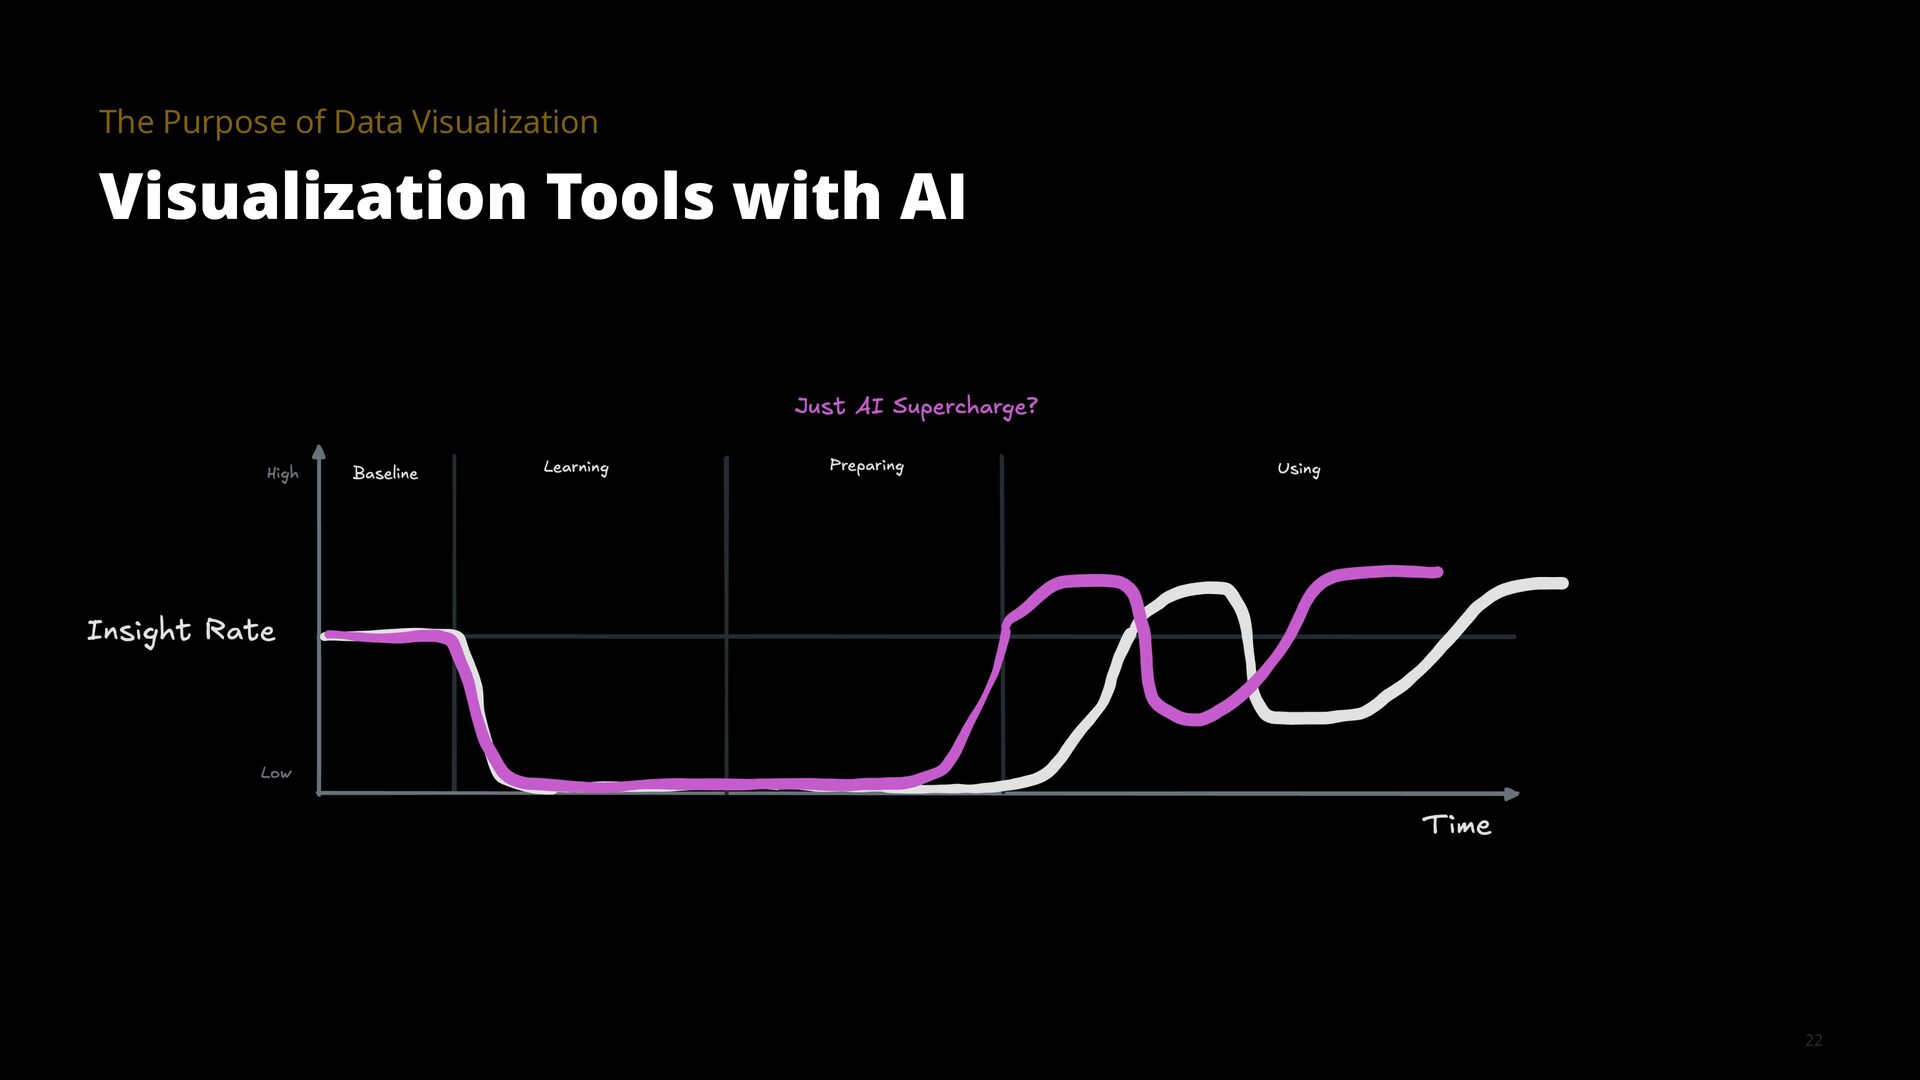
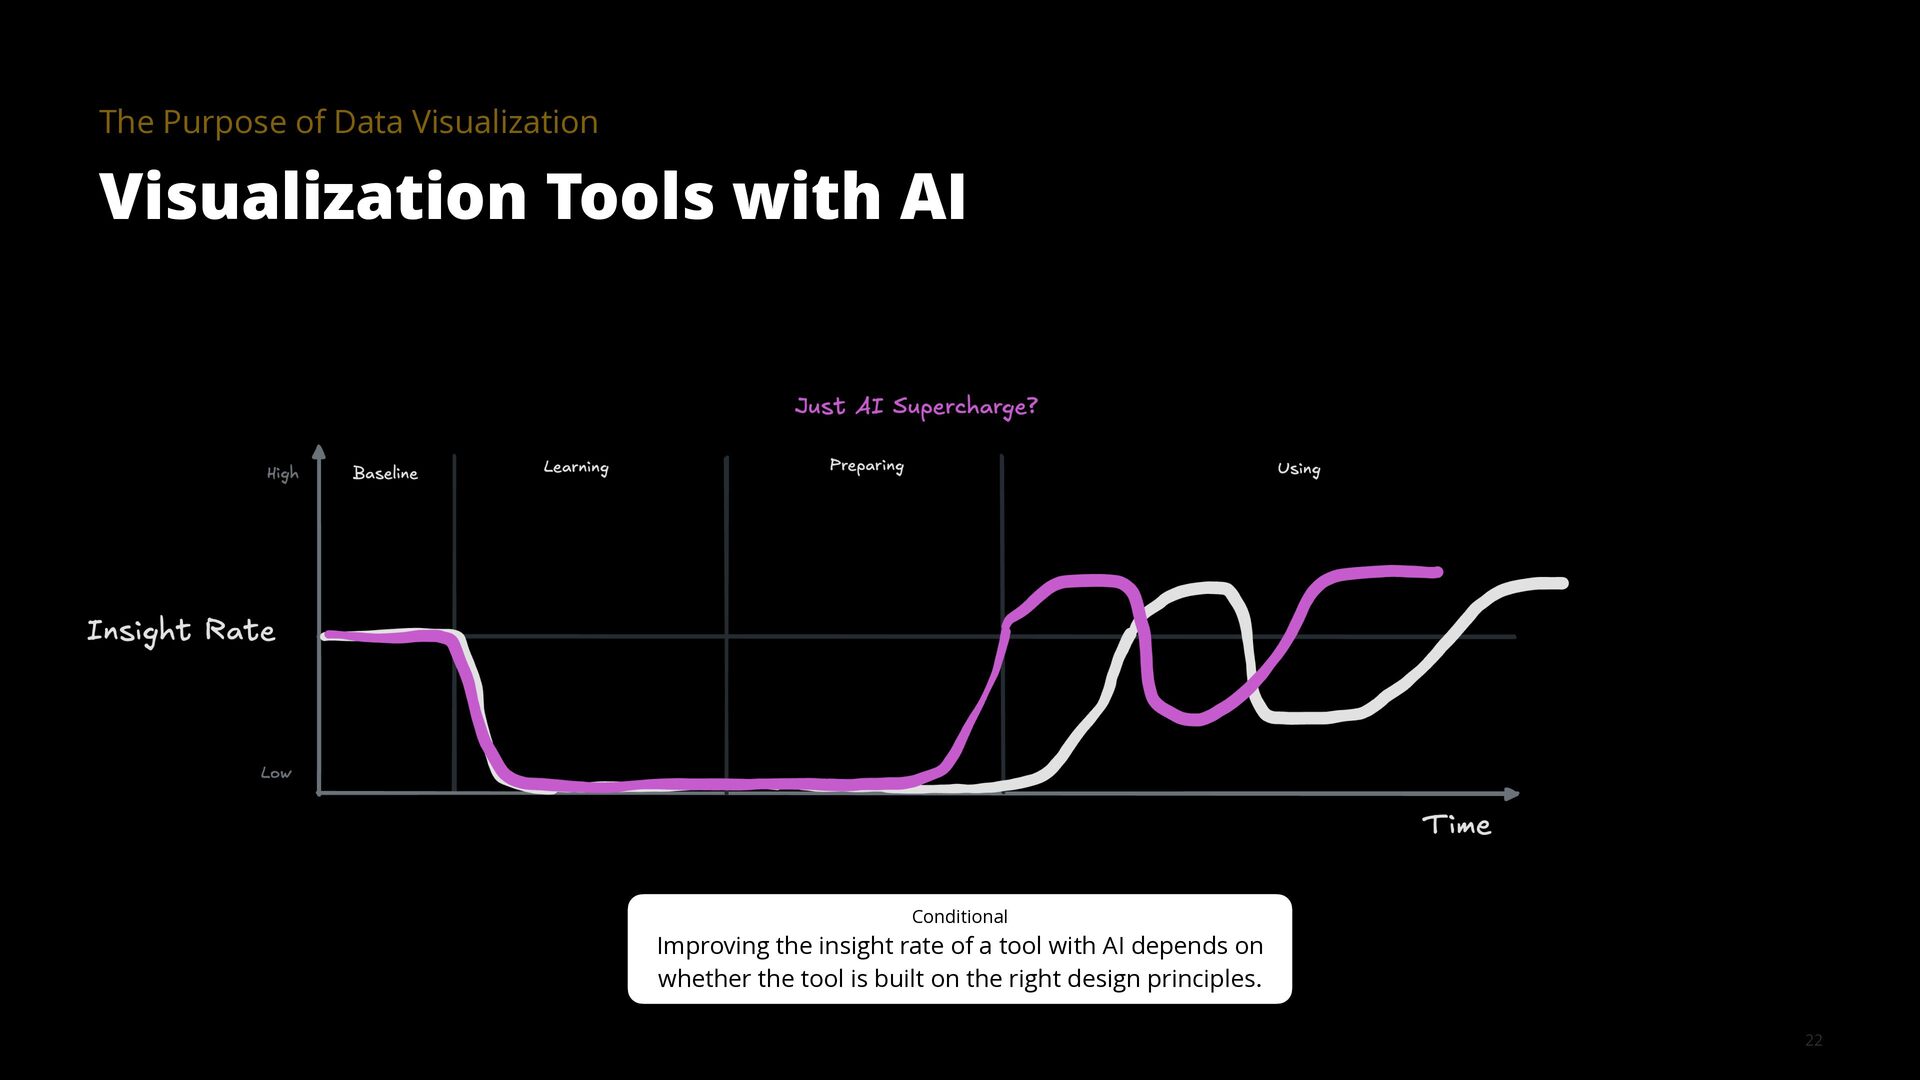
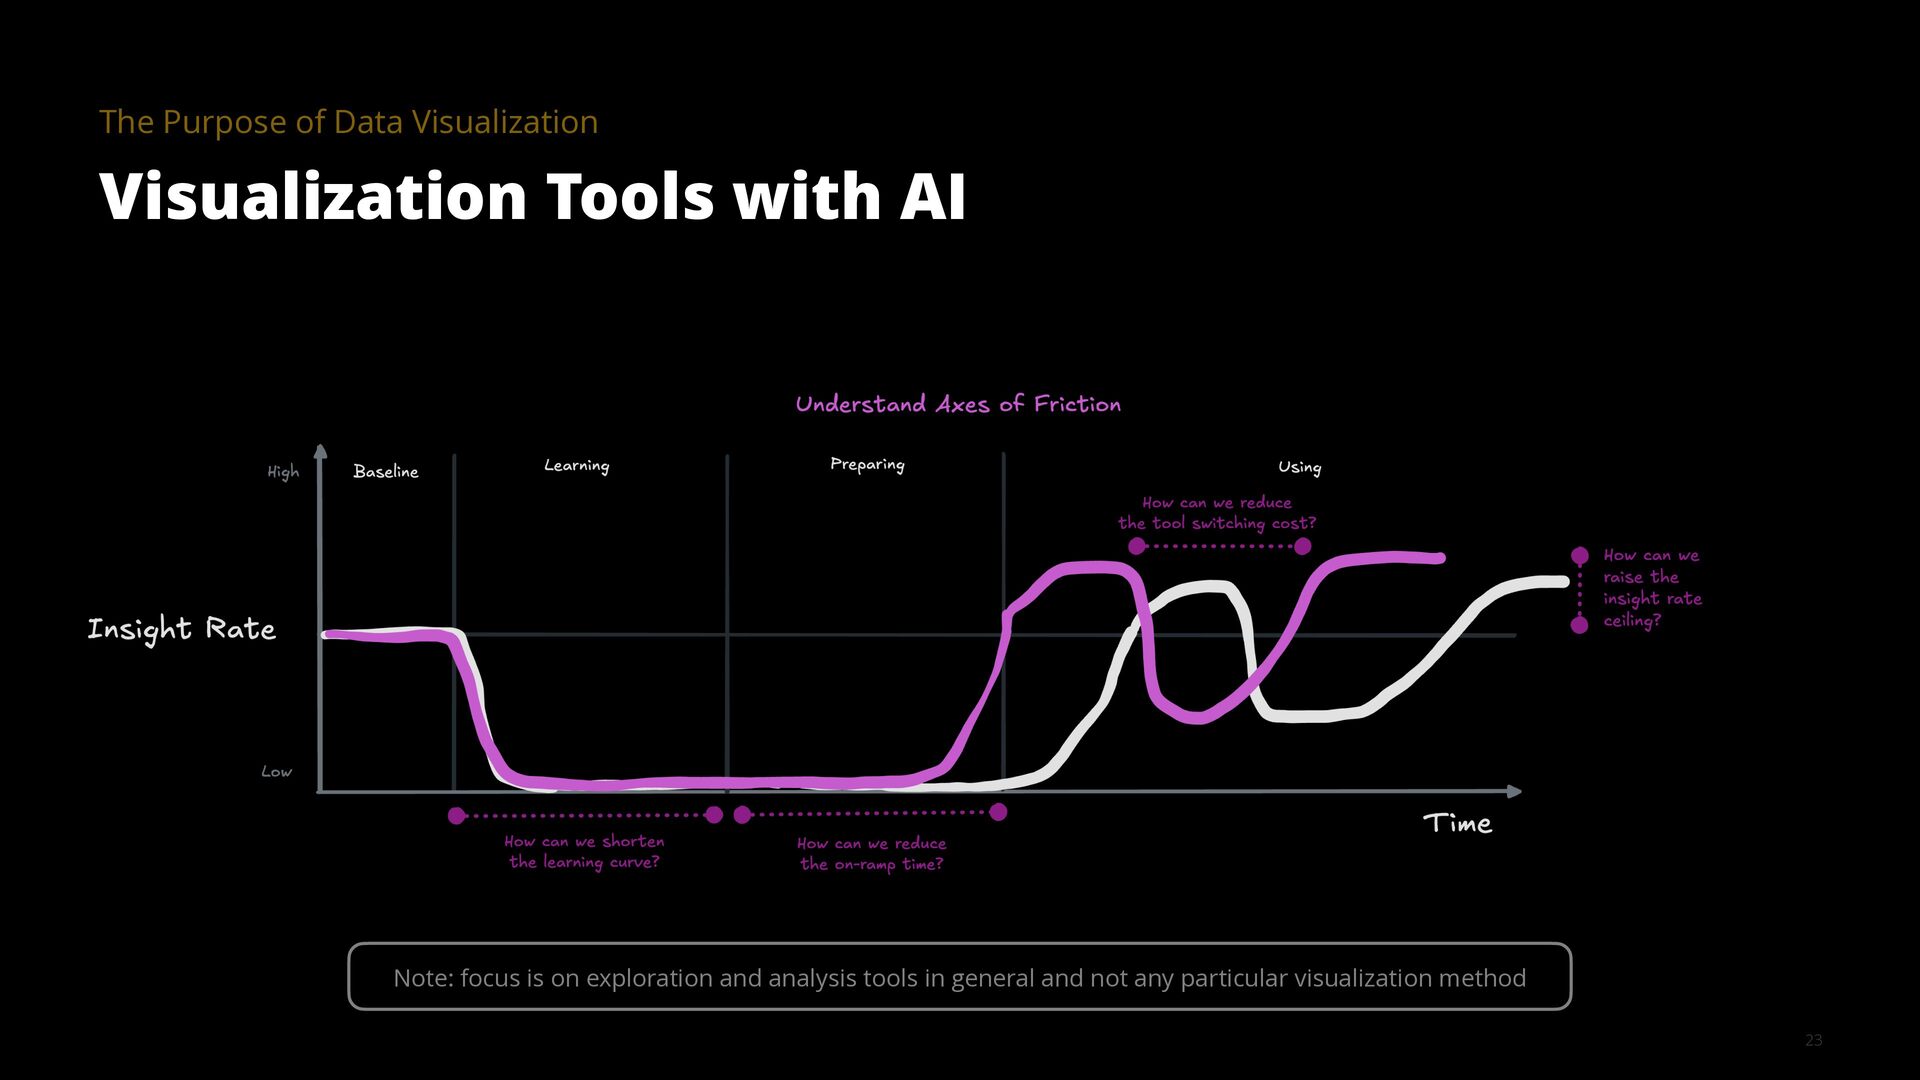
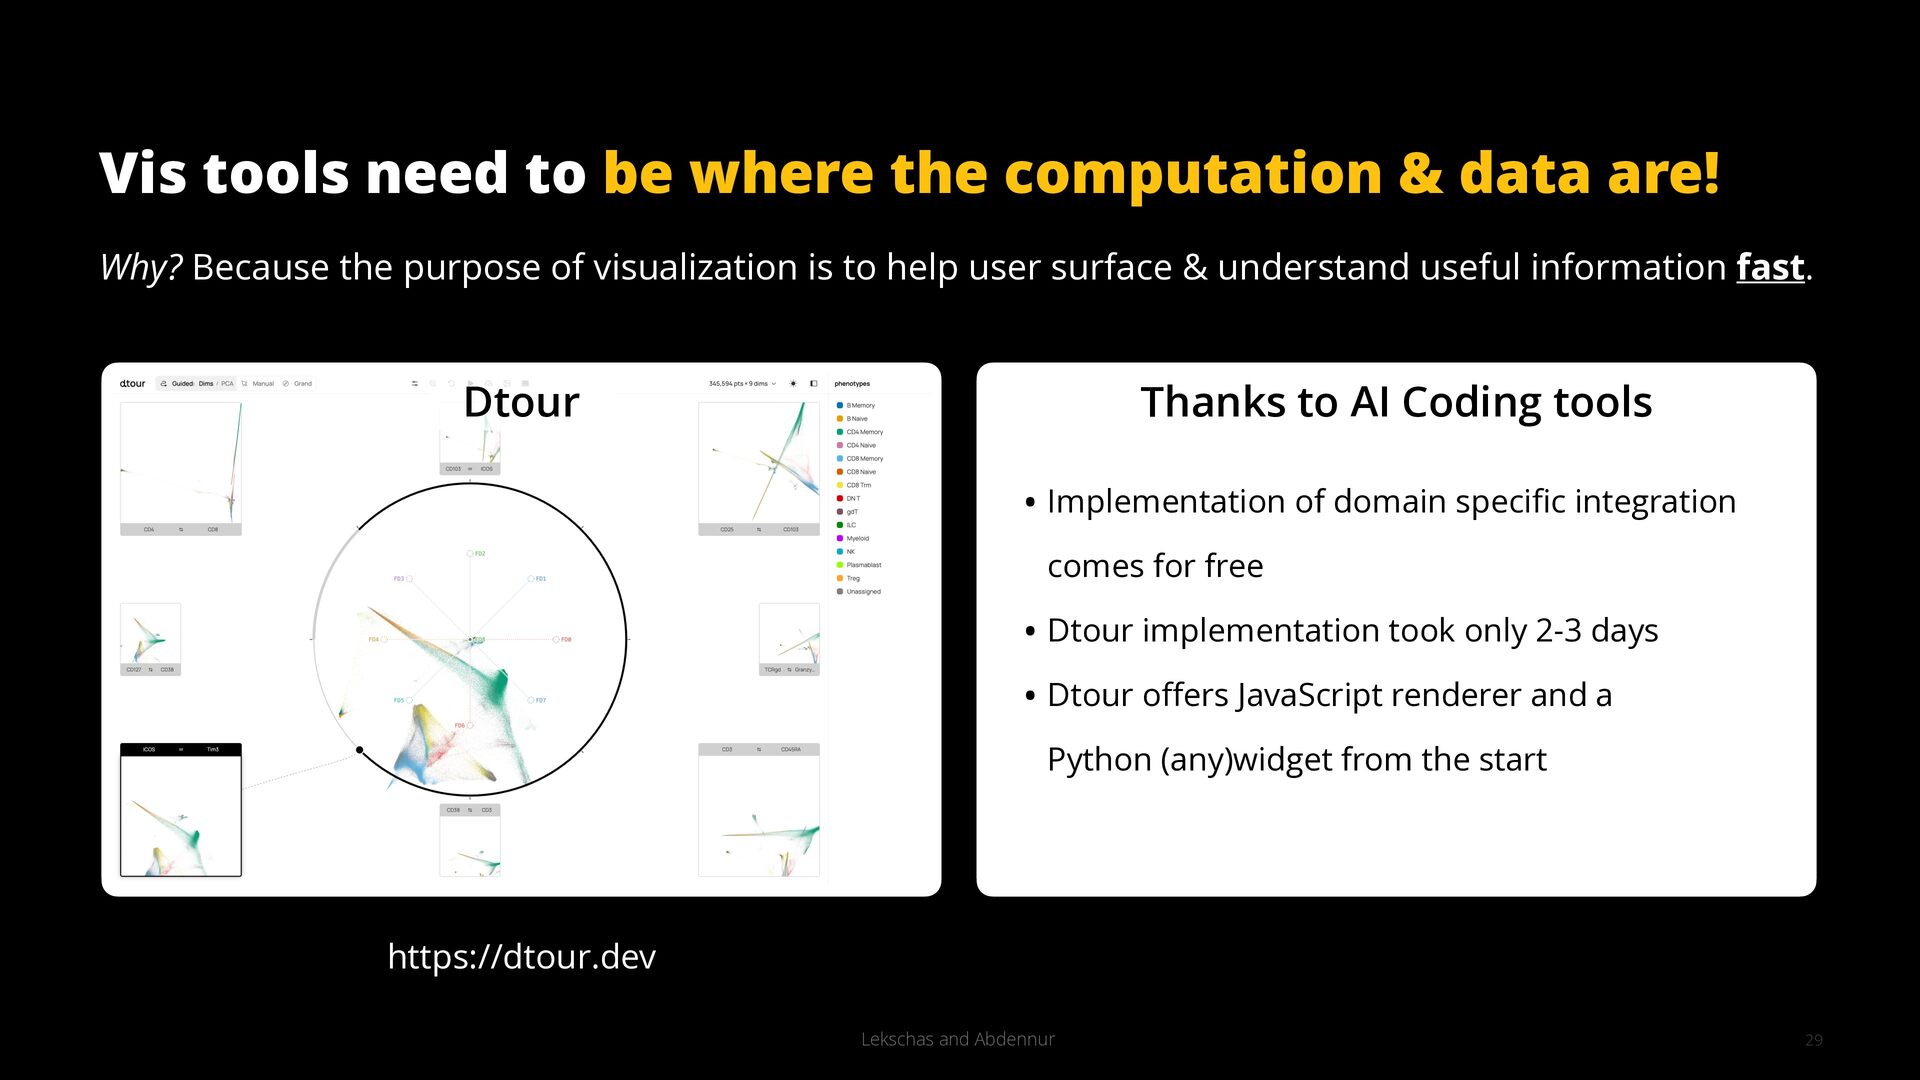
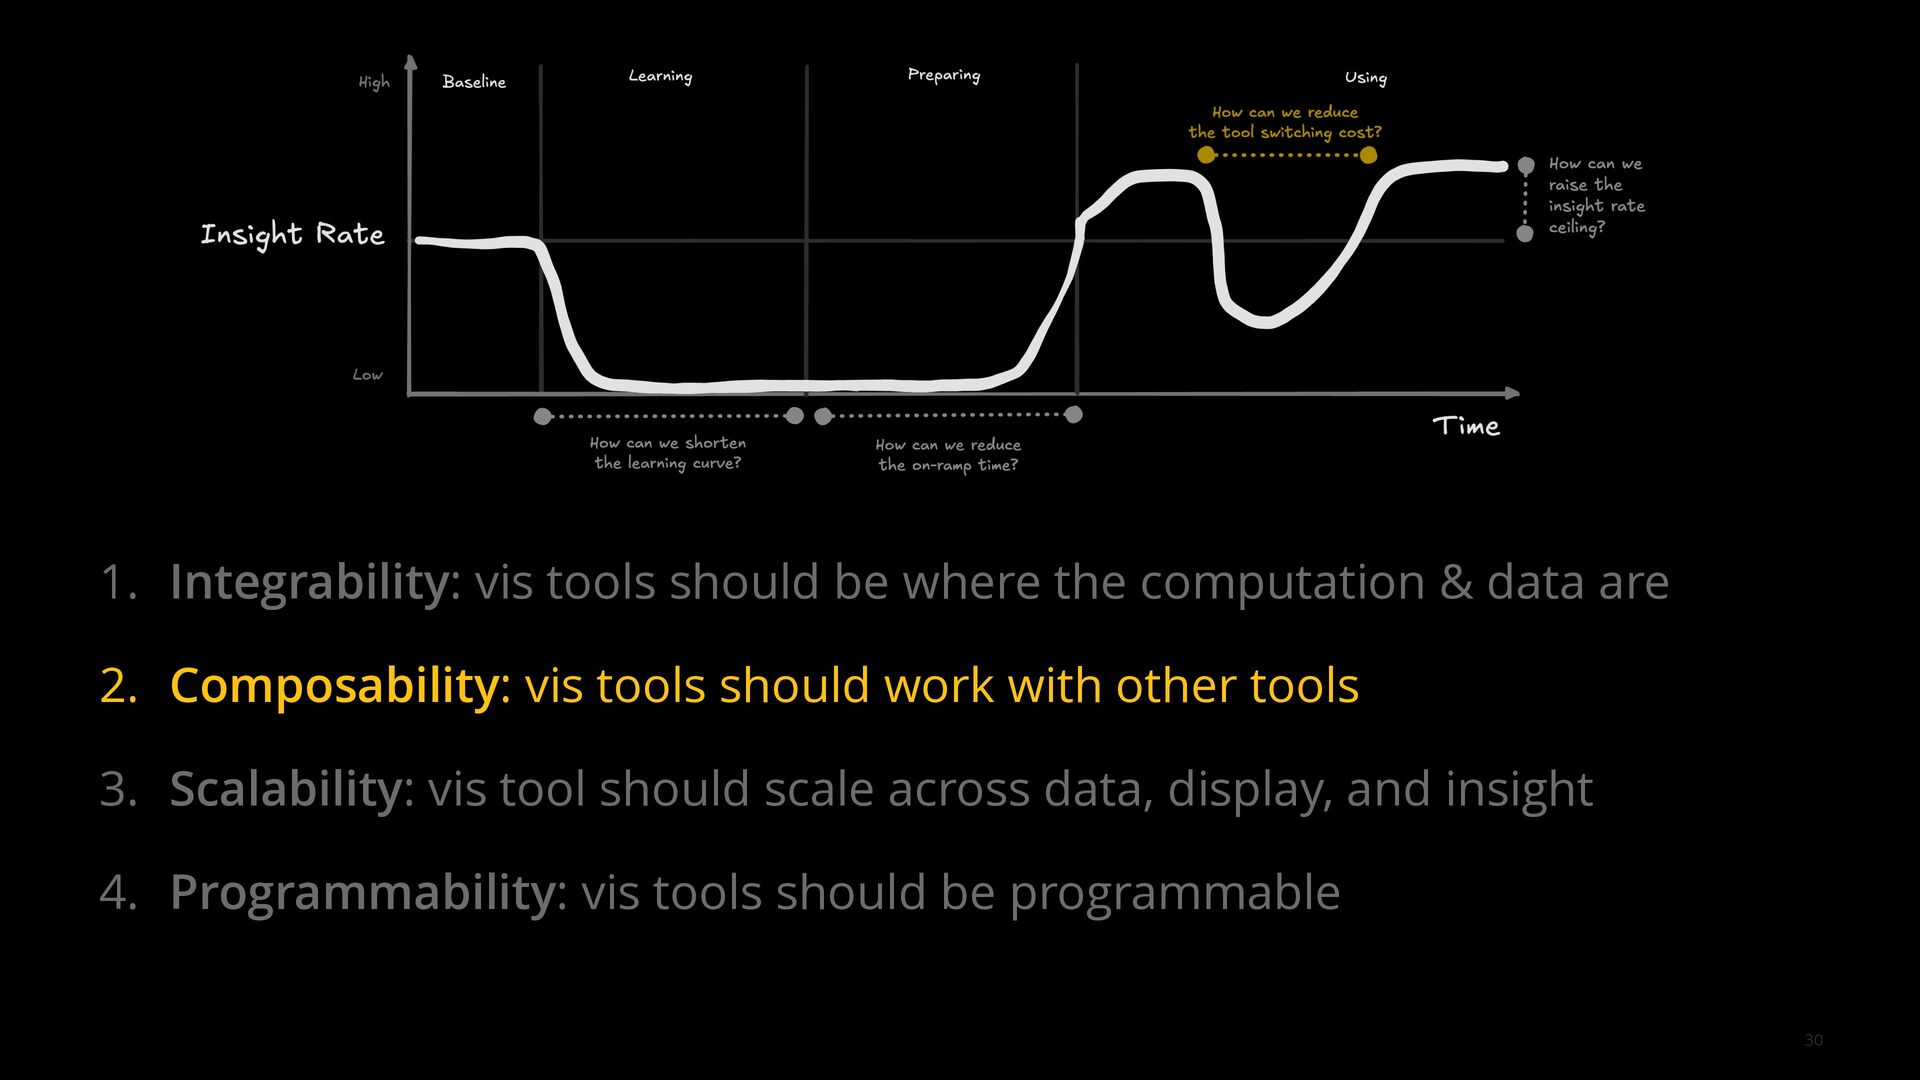
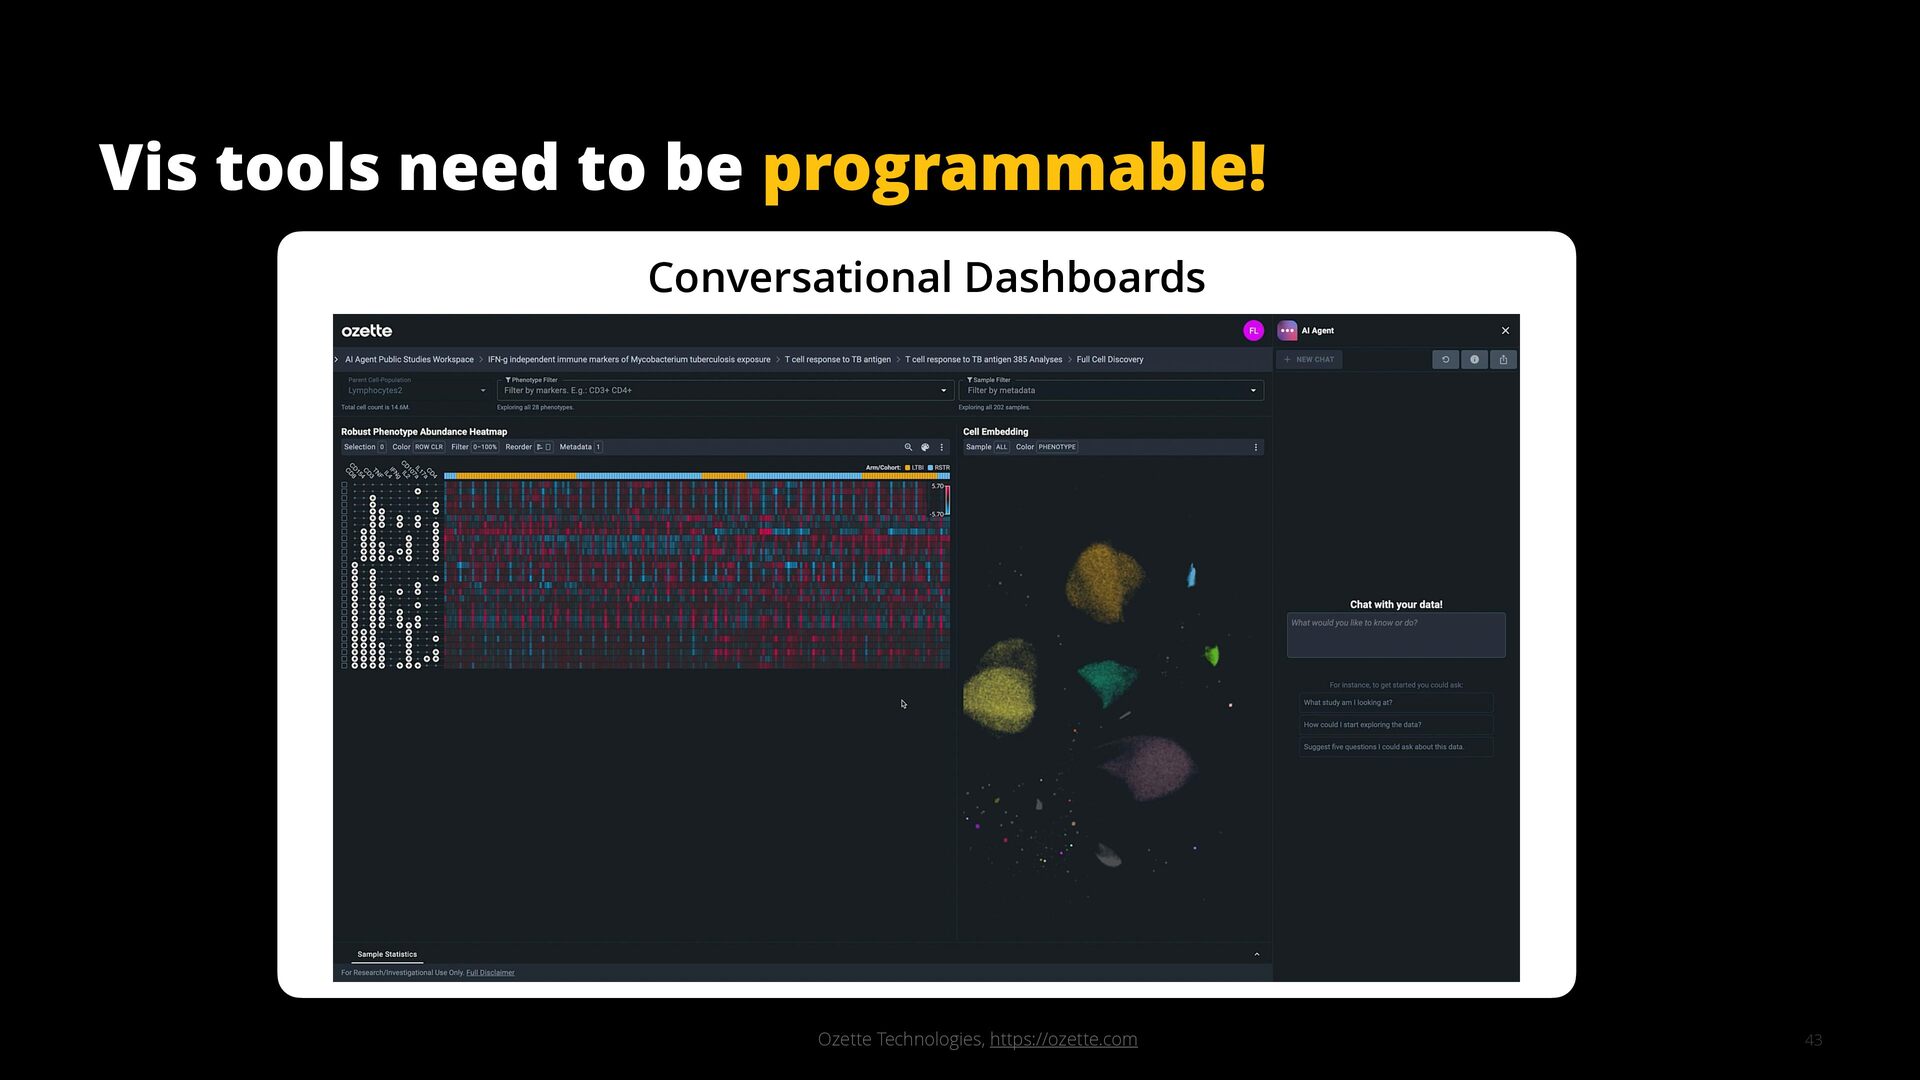
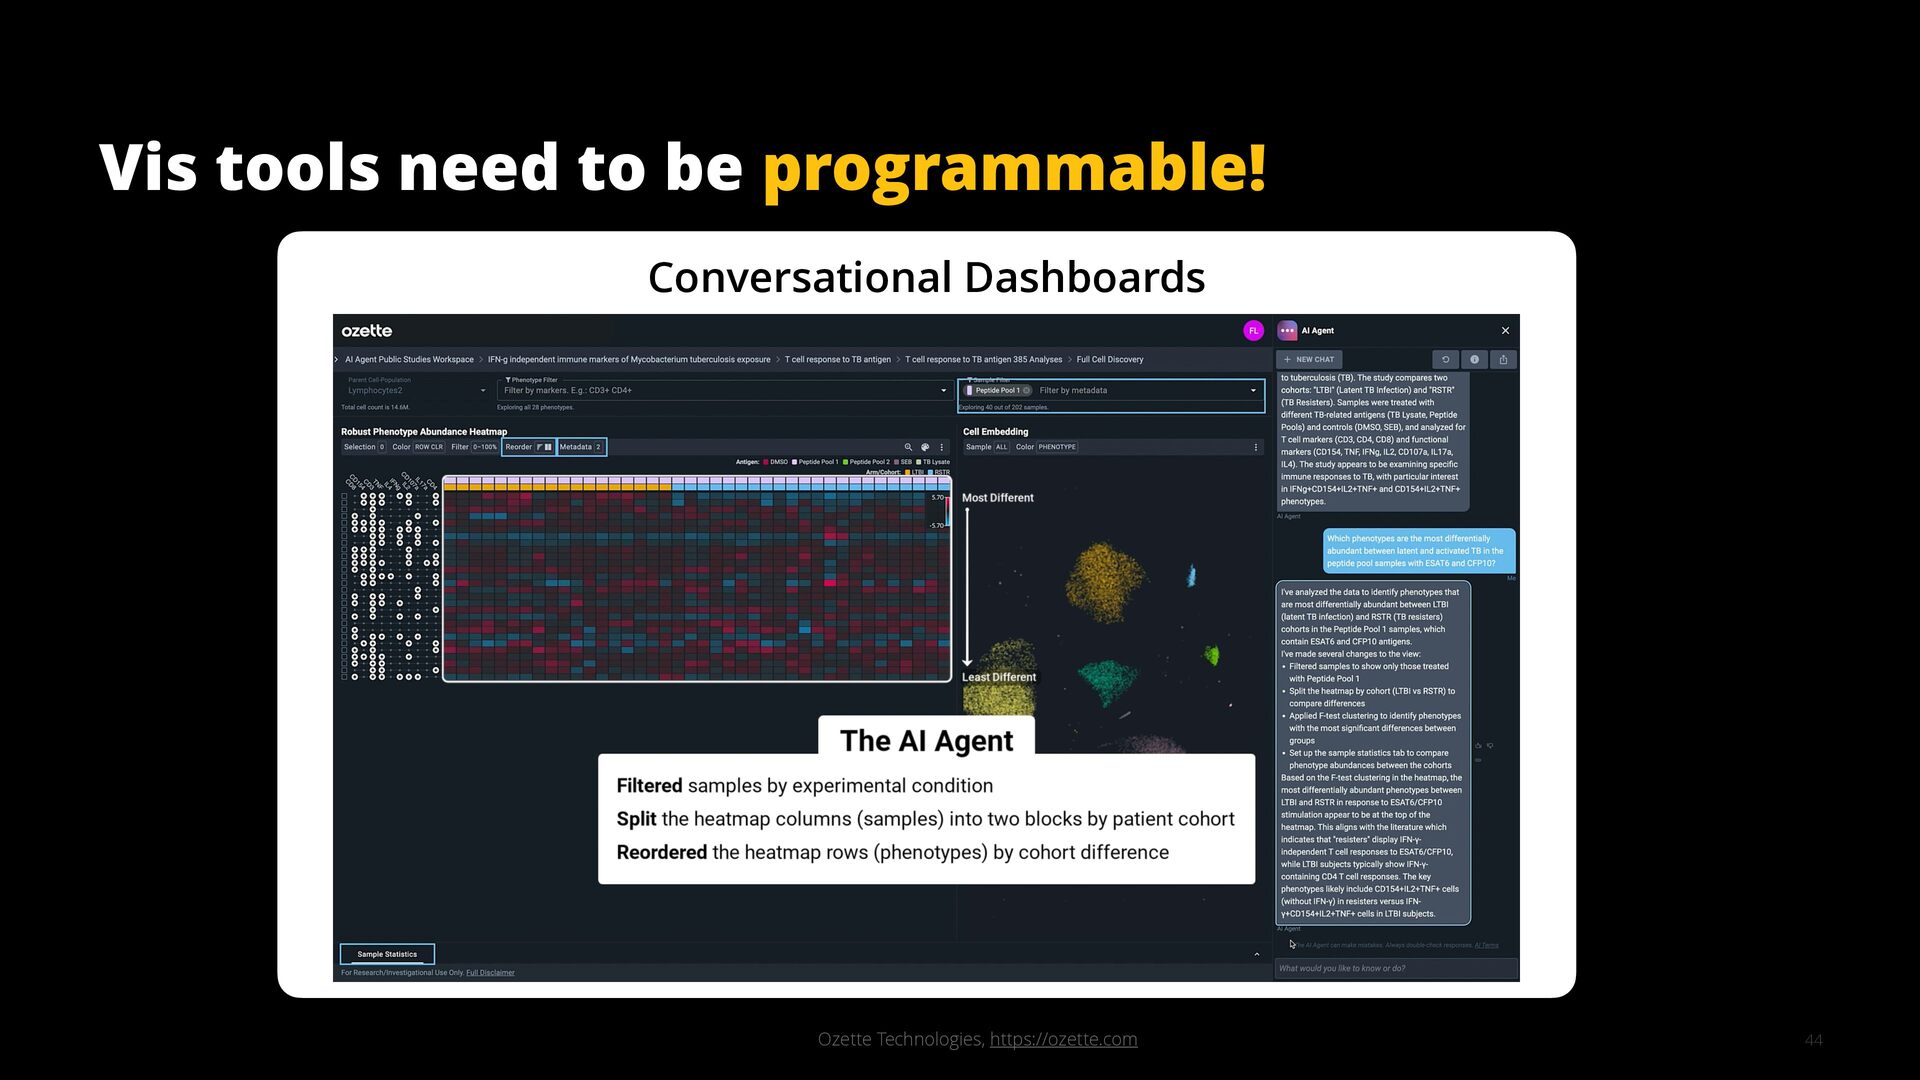
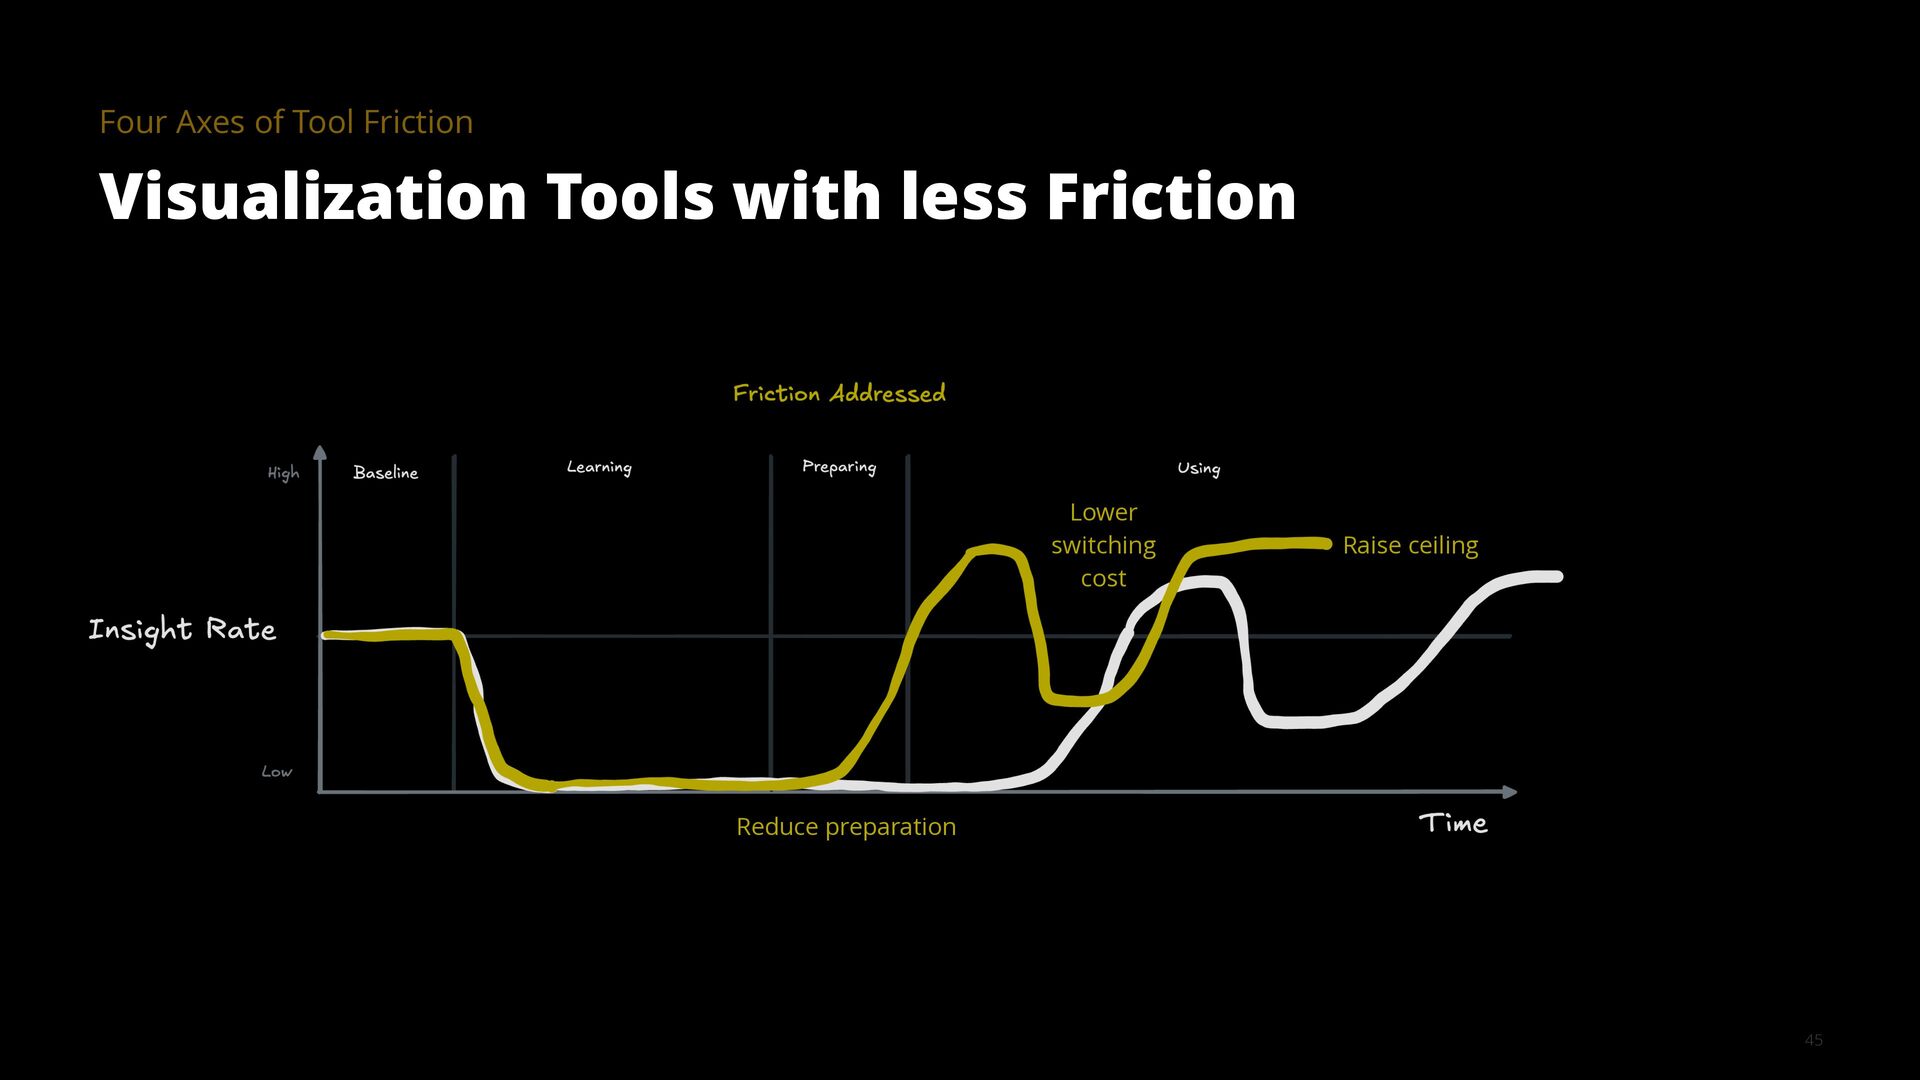
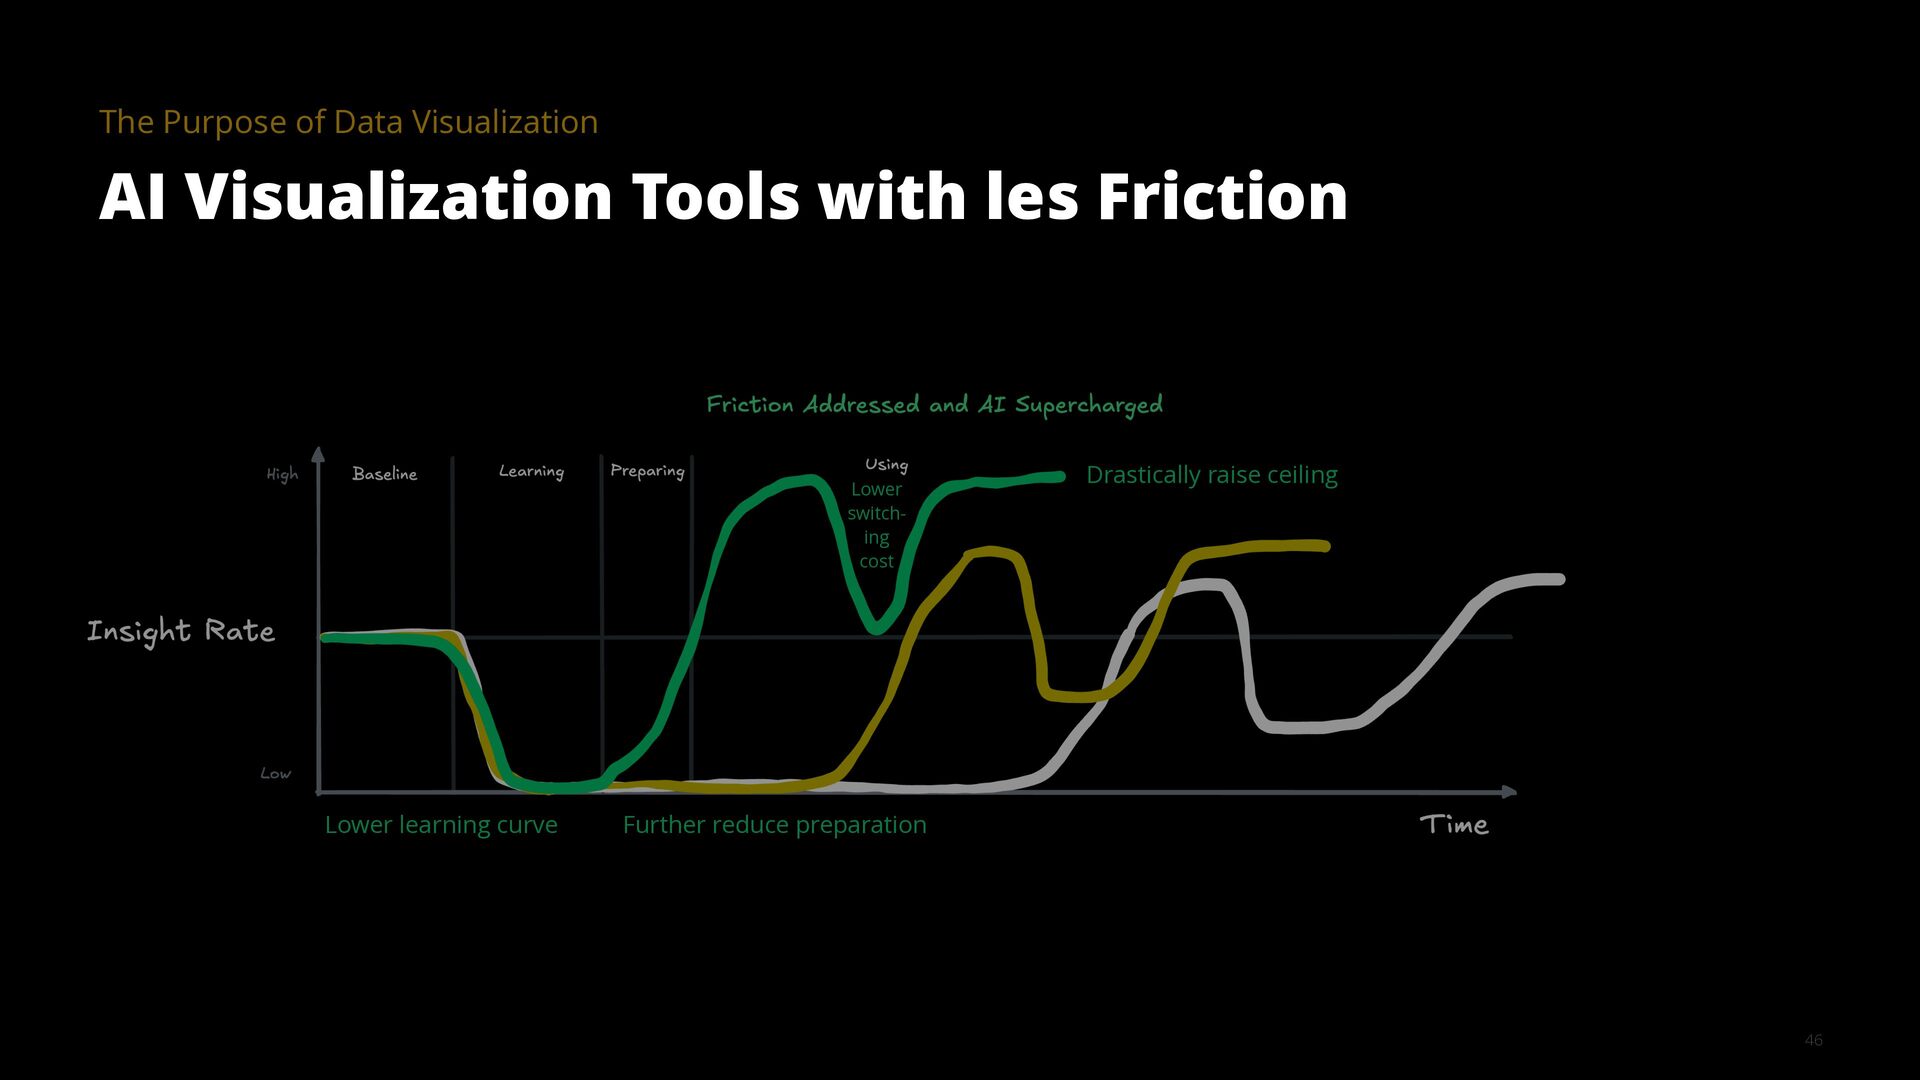
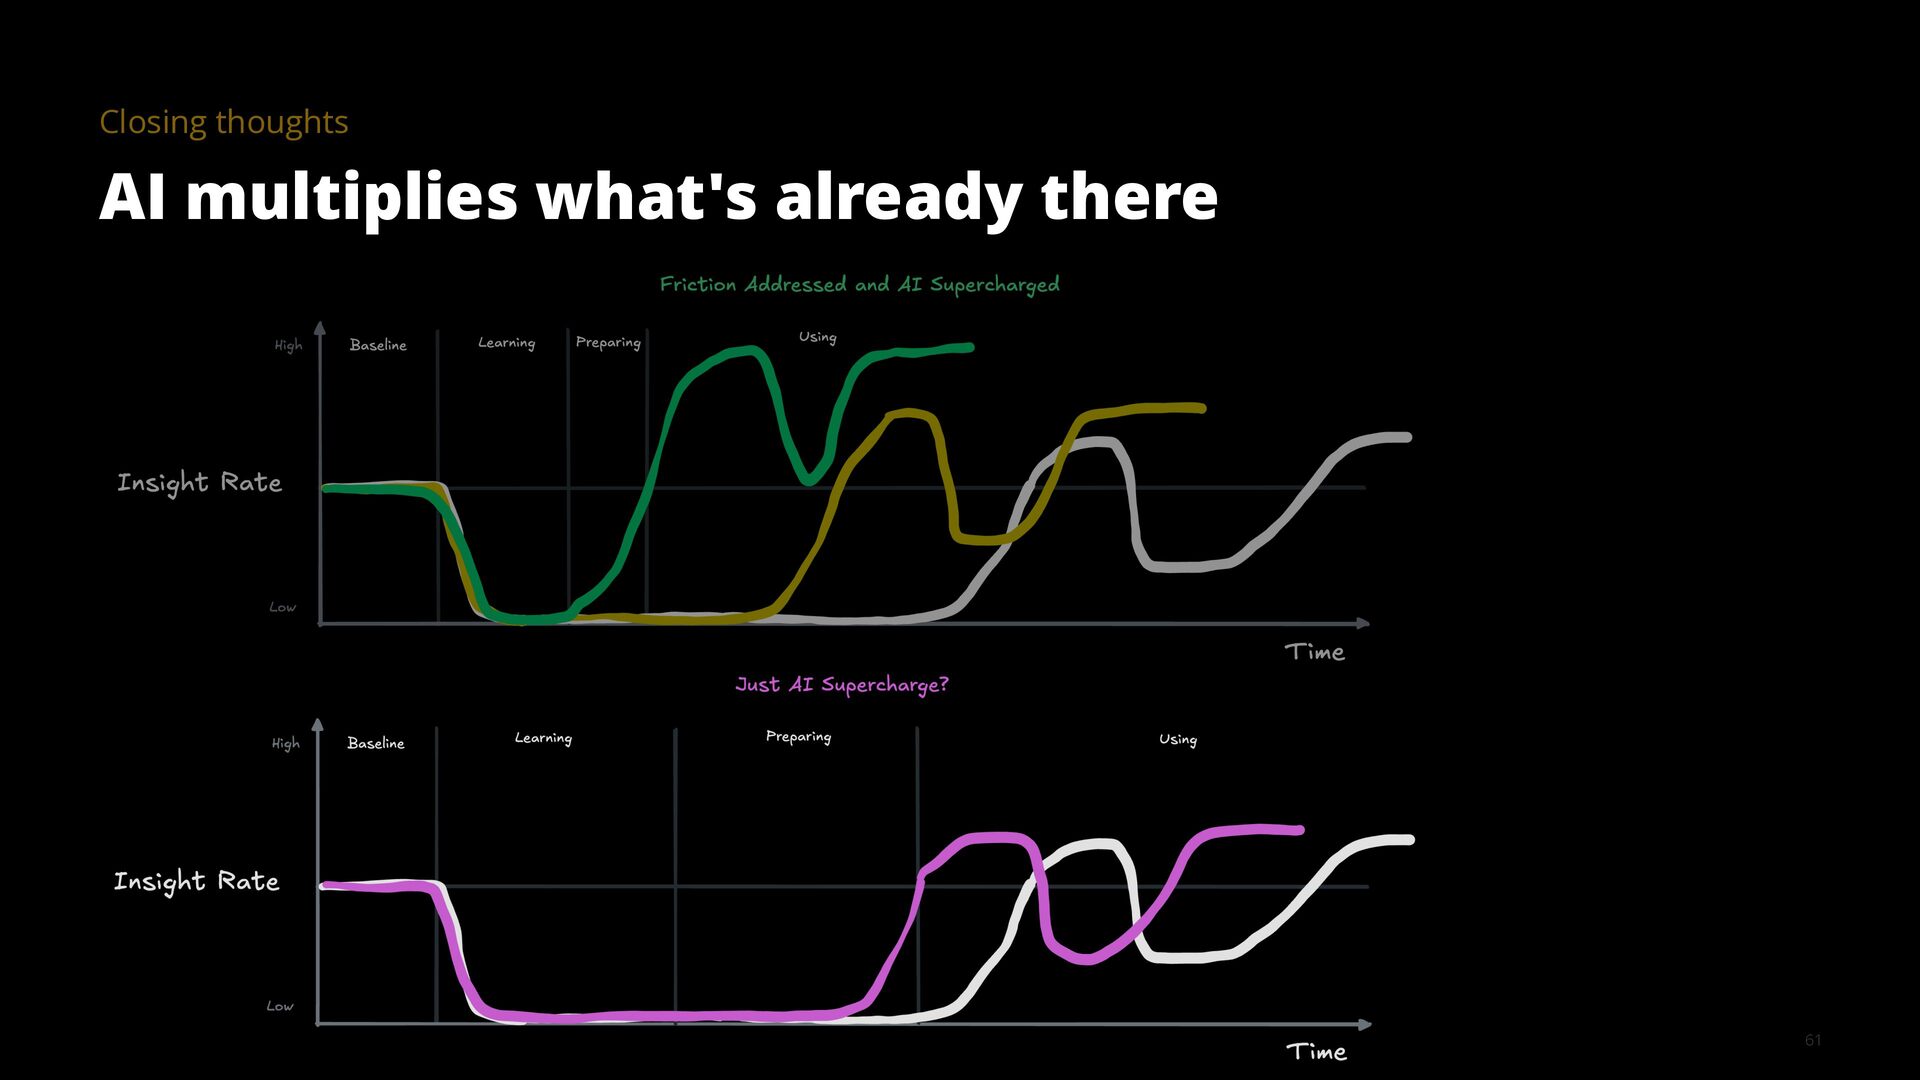
The goal of a visualization tool is to help users gain insights faster. Yet many tools have had limited impact. The learning curve is too high and the most meaningful insights are often hidden in the details, for example, in how data was collected, cleaned, and analyzed. AI is changing this equation by collapsing implementation time, lowering learning curves, and surfacing contextual details that make visualizations truly informative.

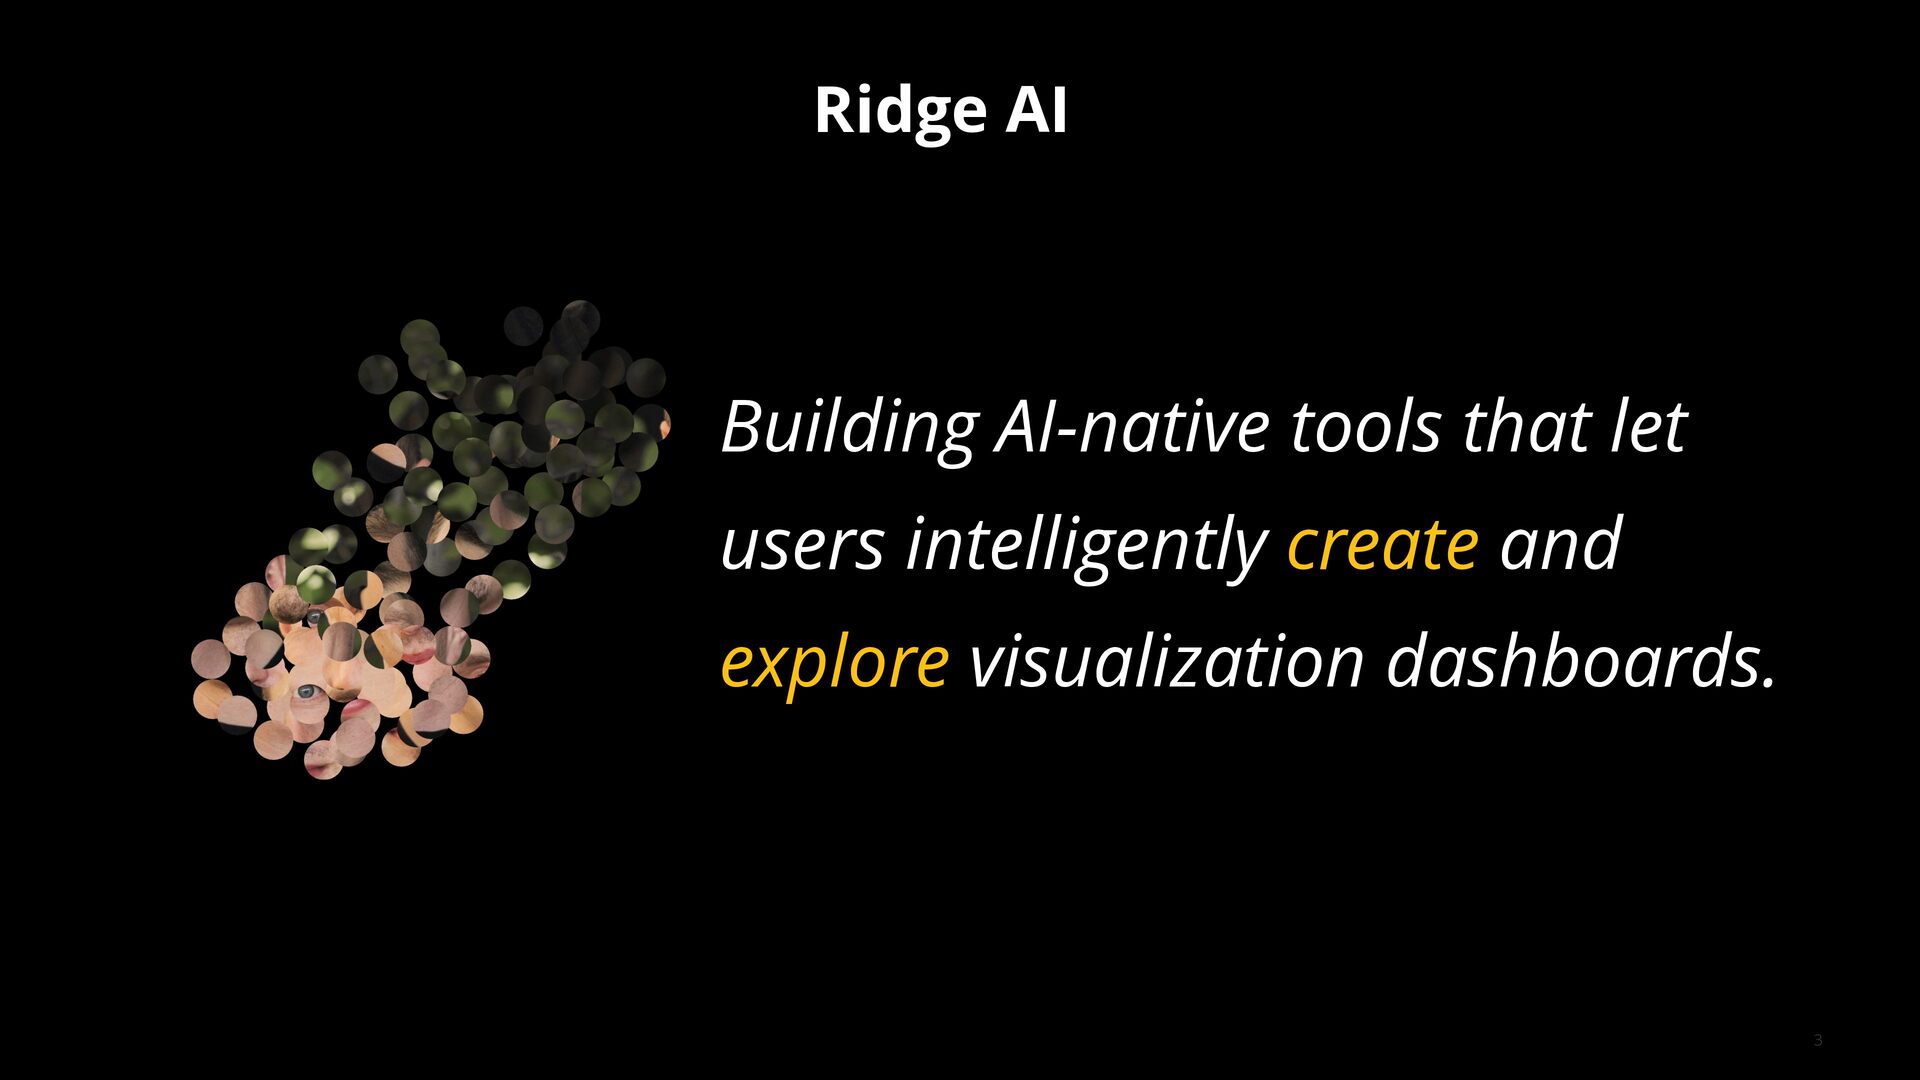
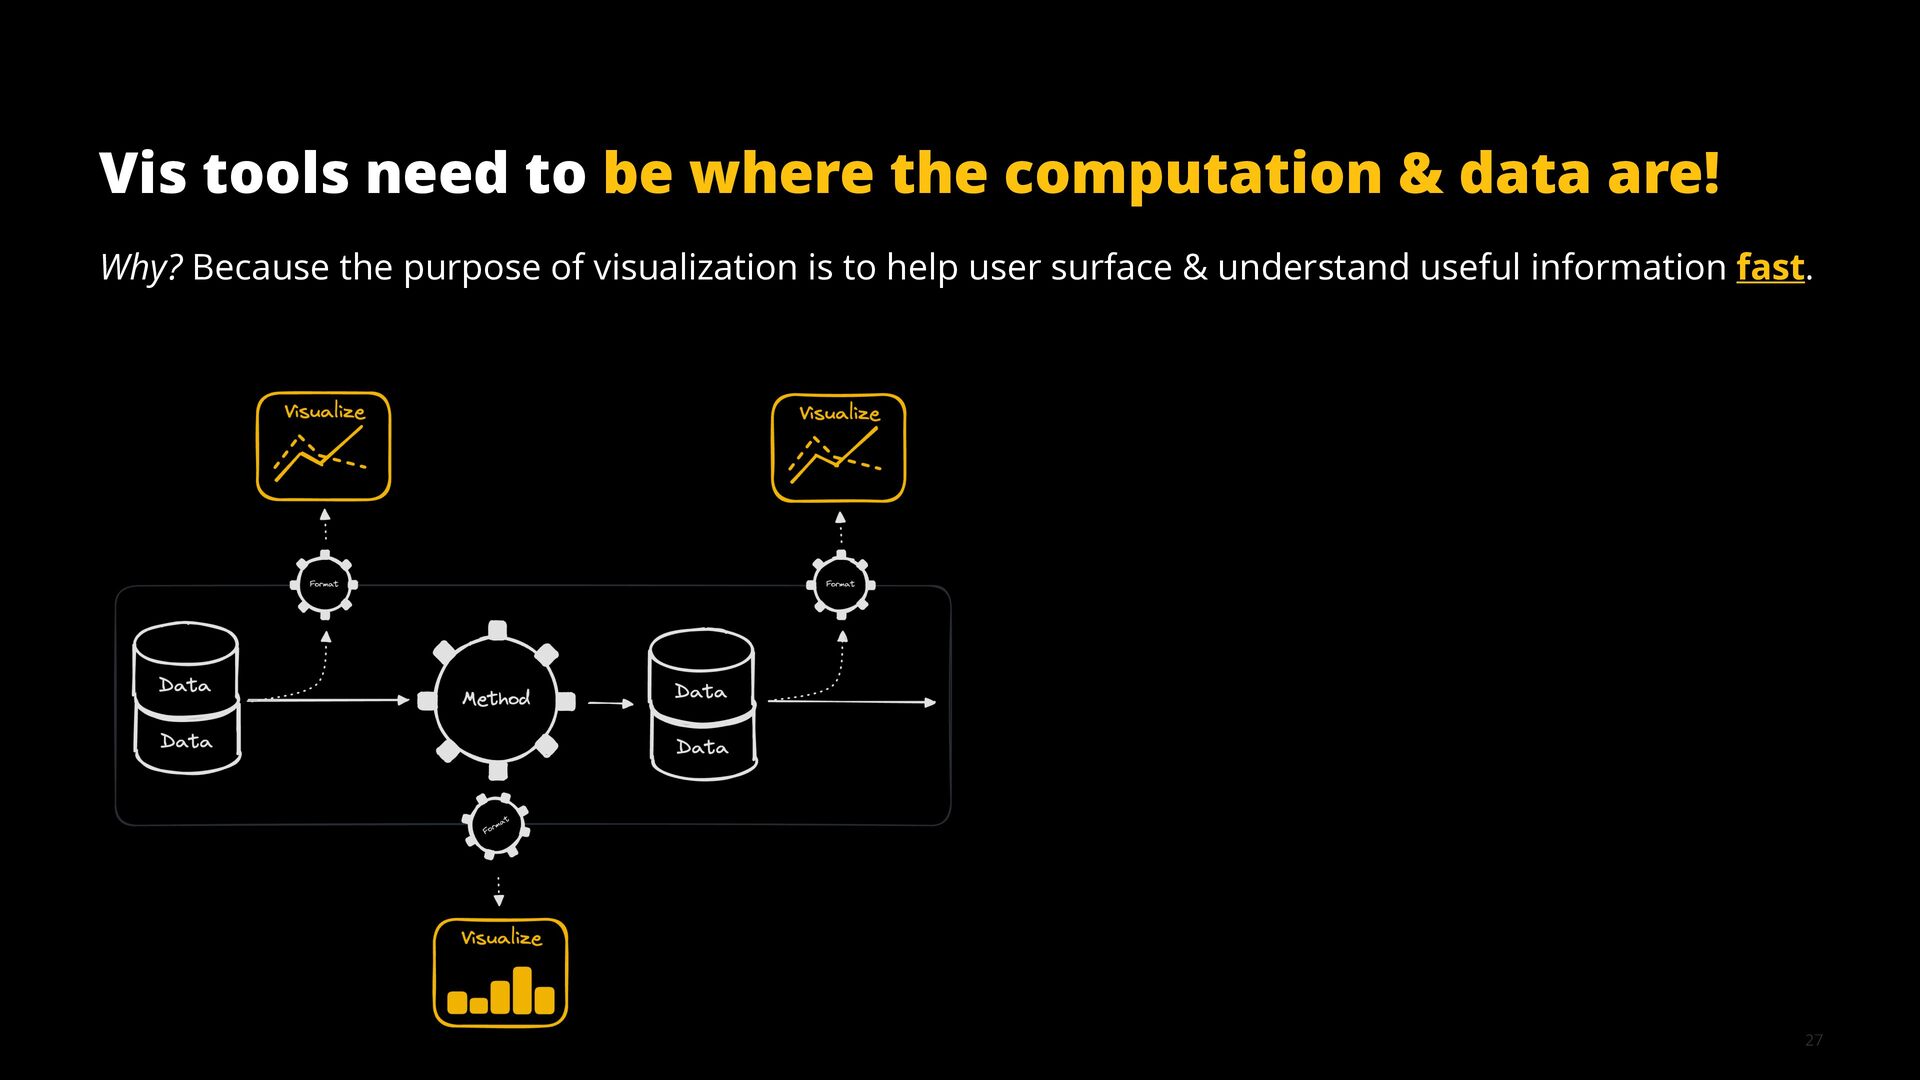
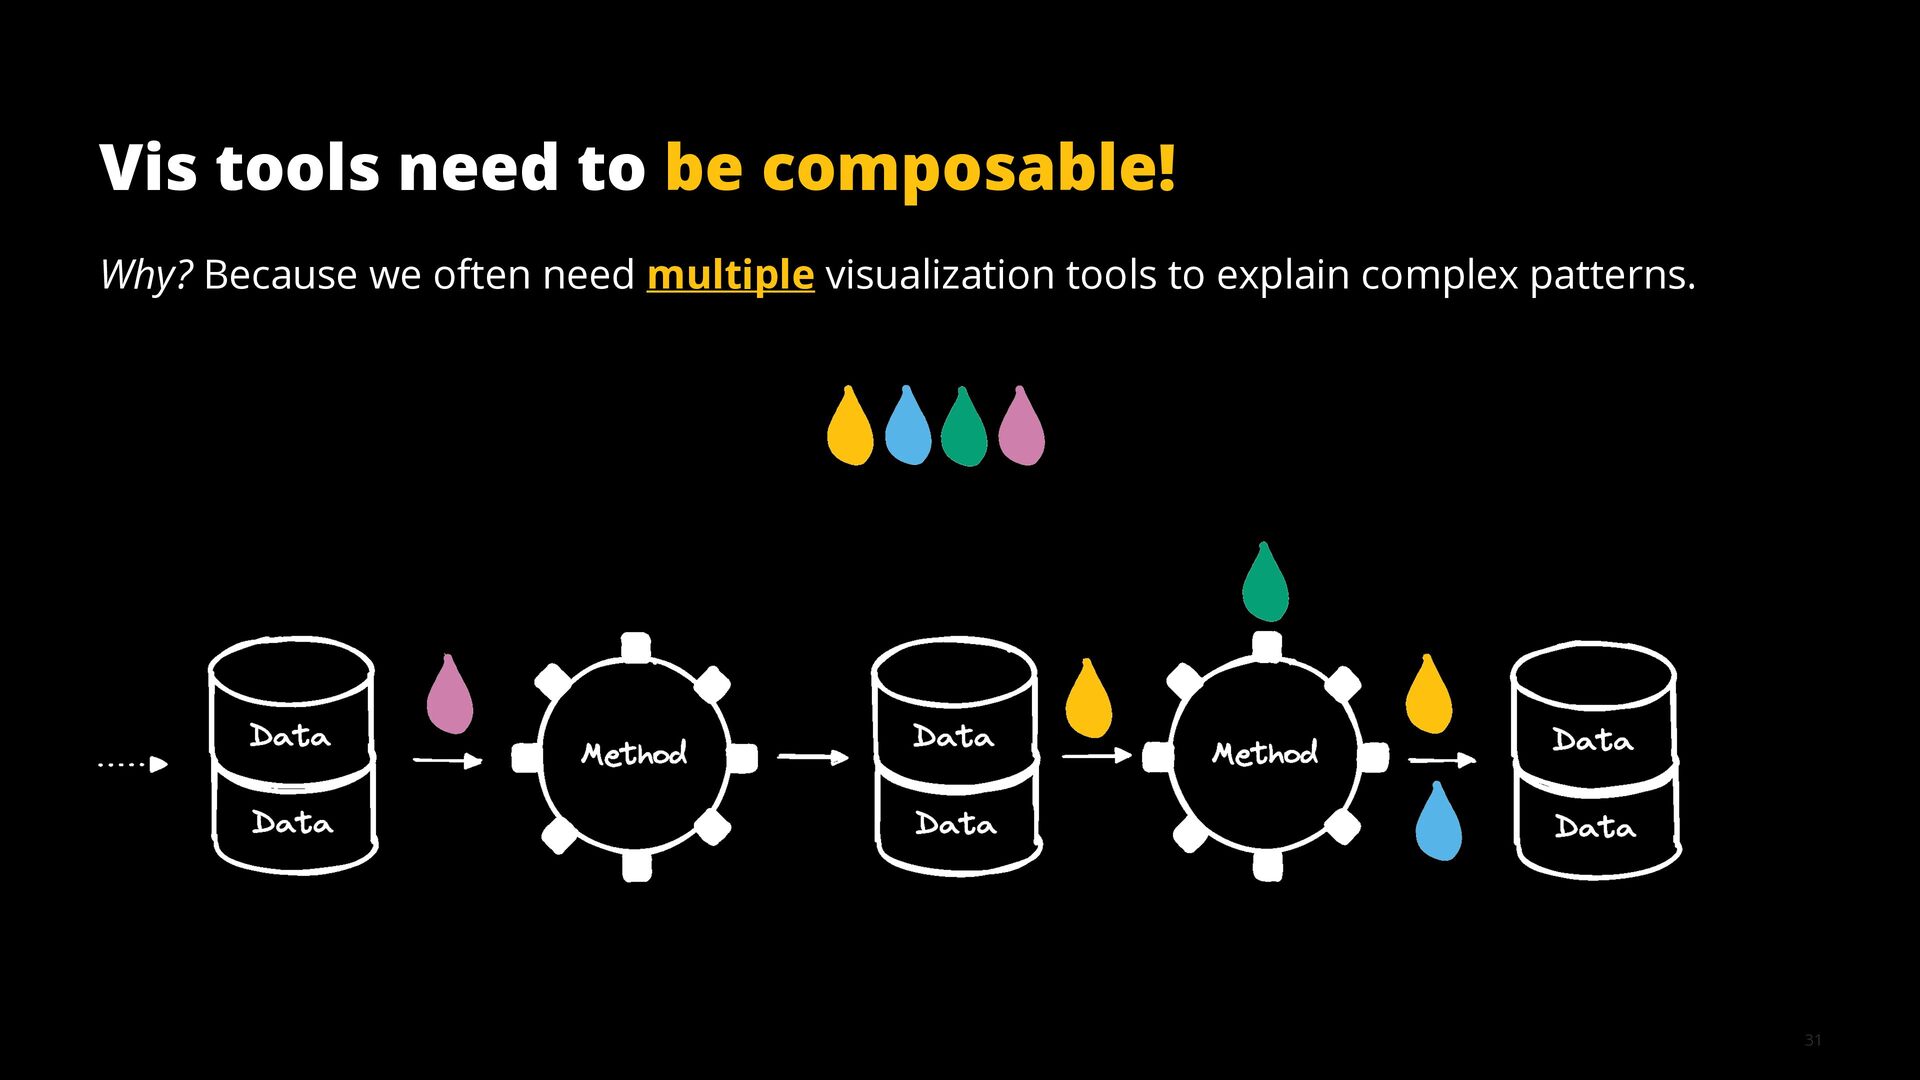
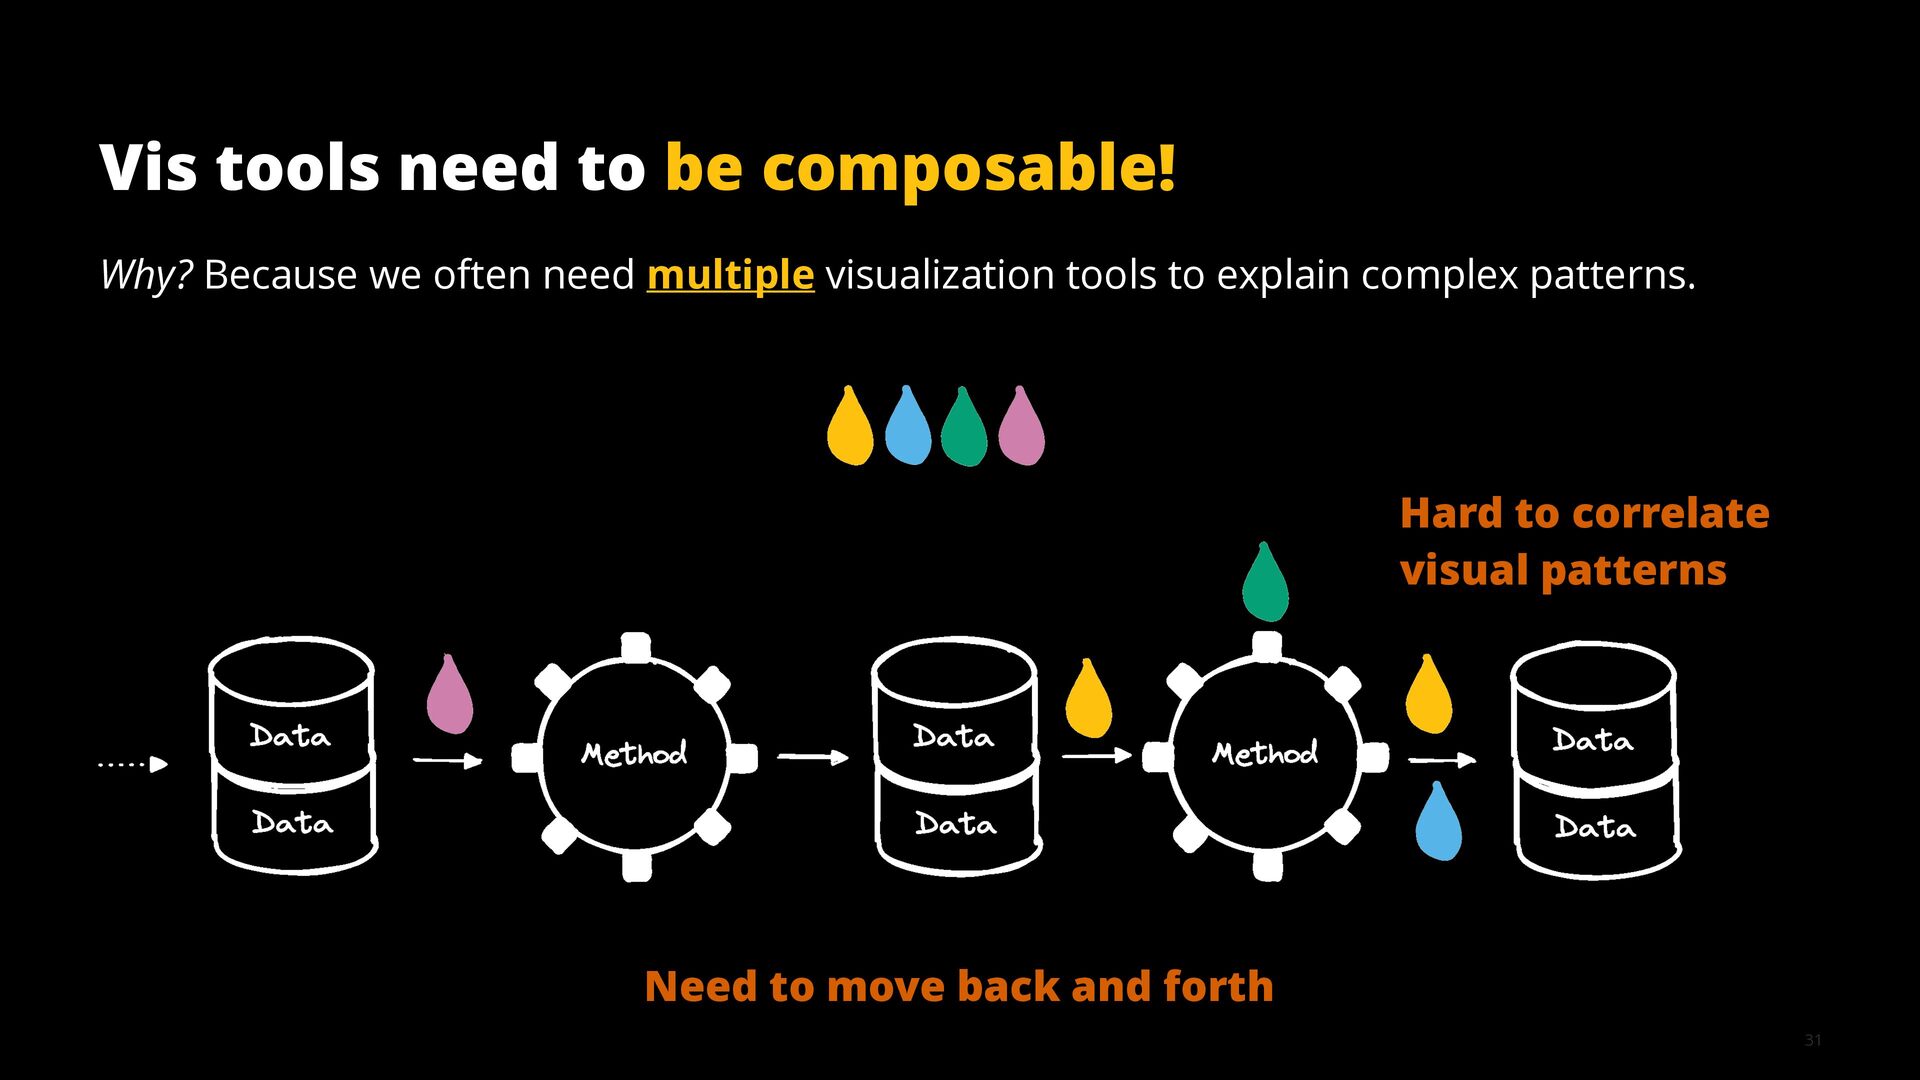
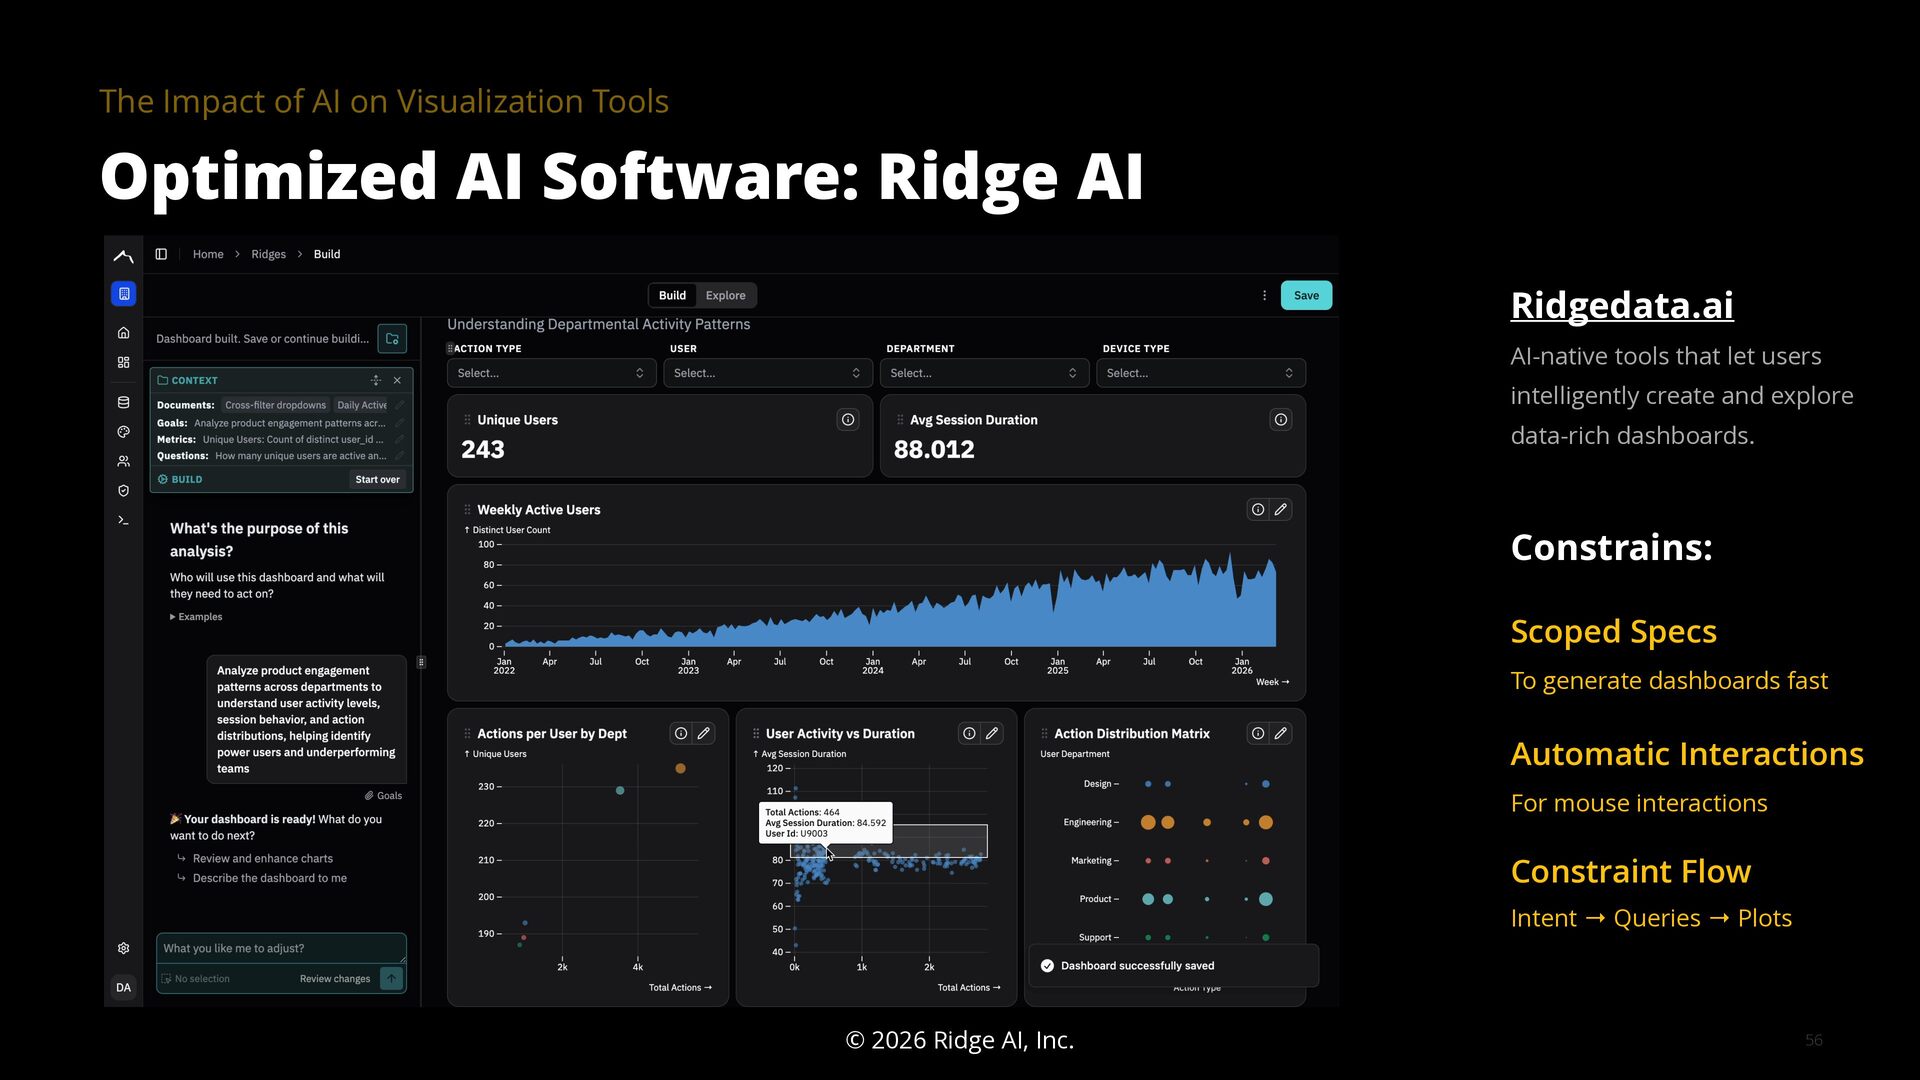
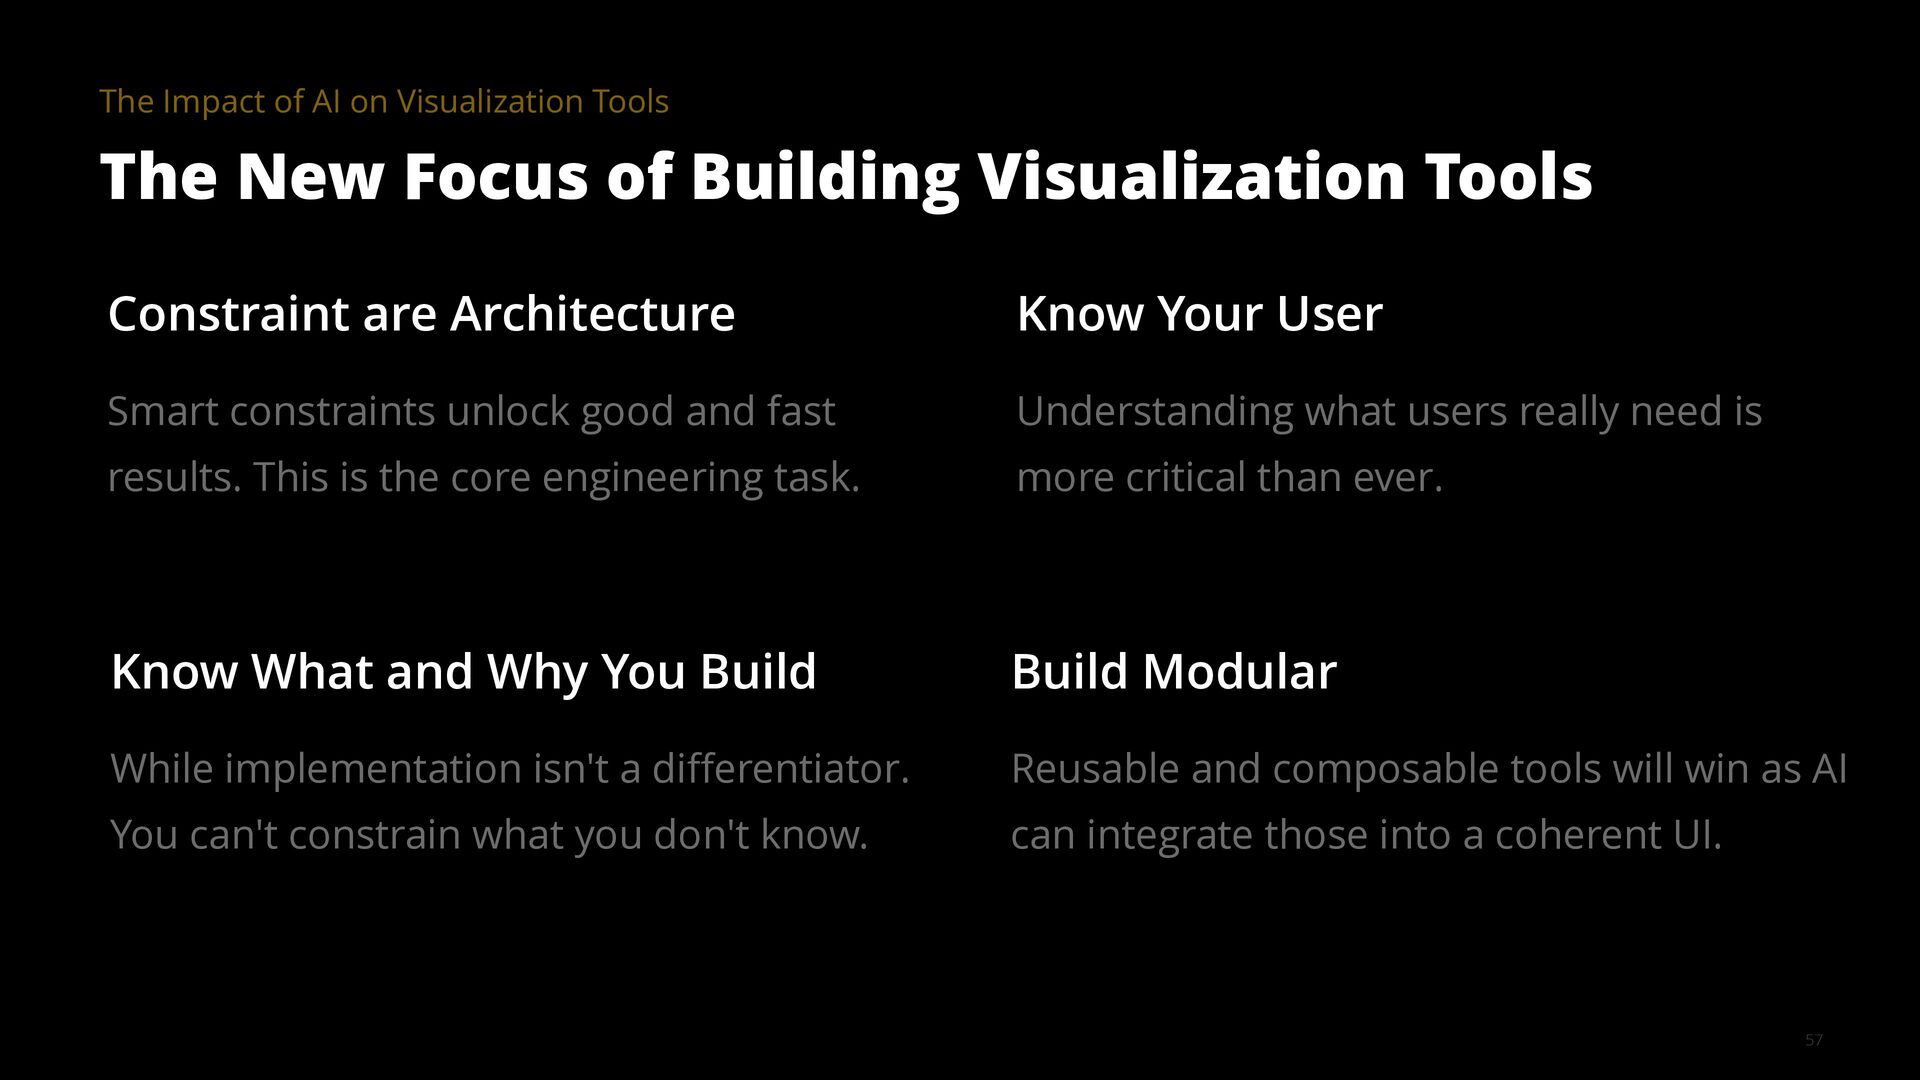
But new opportunities bring new design challenges. Building effective AI-native tools requires carefully engineered constraints that increase quality without sacrificing user agency. The key is using AI where it excels (understanding intent, guiding exploration, orchestrating tools) while relying on deterministic methods where correctness matters. The human must stay in the loop, and designing the right amount of friction is both art and science. Meanwhile, as building becomes cheap, the bottleneck shifts to product intuition and domain expertise: when everyone can build, only tools that solve real problems win.

This talk illustrates these opportunities and challenges with examples from building visualization tools for scientific, analytical, and exploratory use cases.

Avatar for Fritz Lekschas

Fritz Lekschas

April 20, 2026

More Decks by Fritz Lekschas

Other Decks in Research

Transcript

  1. April 20, 2026 Data Visualization Tools in the Age of

    AI Fritz Lekschas Founding Research Engineer at Ridge AI linkedin.com/in/flekschas lekschas.de 1 University of Minnesota
  2. 2 EDUCATION PhD '21 in Computer Science from Harvard University

    MSc '16 in Bioinformatics from Freie Universität Berlin RESEARCH Visualization Human-Centered ML Design WORK Founding Research Engineer at Ridge AI Prev. Head of Visualization Research at Ozette
  3. 3 Building AI-native tools that let users intelligently create and

    explore visualization dashboards. Ridge AI
  4. 4 PhD Bachelor Master Ontology-Guided Visual Exploration of BioMedical Data

    Repositories Visualization Tools for Epigenomic Data CellFinder Semantic Body Browser Satori HiGlass Peax ABC Enhancer-Gene
  5. 5 PhD Ozette Visualization Tools for Epigenomic Data HiGlass Peax

    ABC Enhancer-Gene Abundance Embeddings Visual Exploration of Single-Cell Data Jupyter Scatter High-Dim Data Exploration
  6. 5 PhD Bachelor Master Ozette Ontology-Guided Visual Exploration of BioMedical

    Data Repositories Visualization Tools for Epigenomic Data CellFinder Semantic Body Browser Satori HiGlass Peax ABC Enhancer-Gene Abundance Embeddings Visual Exploration of Single-Cell Data Jupyter Scatter High-Dim Data Exploration Monolithic tools Composable and scalable tools AI-enabled tools
  7. 1. The purpose of data visualization tools 2. Four axes

    of tool friction 3. The impact of AI on visualization tool builders 4. Closing thoughts 8
  8. Ben Shneiderman, 2019 “The purpose of visualization is insight, not

    pictures” 10 “The goal of visualization in computing is to gain insight by using our visual machinery.” McCormick et al., 1987 “The primary objective in data visualization is to gain insight into an information space by mapping data onto graphical primitives.” Senay and Ignatius, 1990 “[Visualization facilitates] the use of computer- supported, interactive, visual representations of abstract data to amplify cognition.” Card et al, 1999
  9. Ben Shneiderman, 2019 “The purpose of visualization is insight, not

    pictures” 11 “The goal of visualization in computing is to gain insight by using our visual machinery.” McCormick et al., 1987 “The primary objective in data visualization is to gain insight into an information space by mapping data onto graphical primitives.” Senay and Ignatius, 1990 “[Visualization facilitates] the use of computer- supported, interactive, visual representations of abstract data to amplify cognition.” Card et al, 1999
  10. Definitions of Insights • A deep understanding of something •

    Understanding the true nature of a thing • An underlying truth • Information that is obvious but unknown • Unknown but useful information (that enables decision making) 12
  11. Min Chen, Luciano Floridi, and Rita Bordgo (2013) “Saving time

    in accomplishing a user’s task is the most fundamental objective [of visualization]” 13
  12. Min Chen, Luciano Floridi, and Rita Bordgo (2013) “Saving time

    in accomplishing a user’s task is the most fundamental objective [of visualization]” 14
  13. The Purpose of Data Visualization Insights and Visualization Tools Help

    users gain an intuition for data and help them surface useful information to better understand patterns and trends. 15 1. Learning Insights are in the Details 2. Learning Tools need to be efficient
  14. The Purpose of Data Visualization Insights and Visualization Tools Help

    users gain an intuition for data and help them surface useful information to better understand patterns and trends. 16 1. Learning Insights are in the Details 2. Learning Tools need to be efficient An insight is the relational understanding of why an answer is what it is.
  15. The Purpose of Data Visualization Insights and Visualization Tools Help

    users gain an intuition for data and help them surface useful information to better understand patterns and trends. 17 1. Learning Insights are in the Details 2. Learning Tools need to be efficient An insight is the relational understanding of why an answer is what it is. Understanding relationships requires more than one tool. Inefficiencies add up!
  16. Insights are in the Details Understanding the meaning of visual

    patterns can be challenging with growing analytical complexity. 18
  17. Insights are in the Details Understanding the meaning of visual

    patterns can be challenging with growing analytical complexity. 18
  18. The Purpose of Data Visualization Visualization Tools with AI 22

    Conditional Improving the insight rate of a tool with AI depends on whether the tool is built on the right design principles.
  19. The Purpose of Data Visualization Visualization Tools with AI 23

    Note: focus is on exploration and analysis tools in general and not any particular visualization method
  20. 1. Integrability: vis tools should be where the computation &

    data are 2. Composability: vis tools should work with other tools 3. Scalability: vis tool should scale across data, display, and insight 4. Programmability: vis tools should be programmable 25
  21. 1. Integrability: vis tools should be where the computation &

    data are 2. Composability: vis tools should work with other tools 3. Scalability: vis tool should scale across data, display, and insight 4. Programmability: vis tools should be programmable 26
  22. Vis tools need to be where the computation & data

    are! Why? Because the purpose of visualization is to help user surface & understand useful information fast. 27
  23. Vis tools need to be where the computation & data

    are! Why? Because the purpose of visualization is to help user surface & understand useful information fast. 27 ! ! !
  24. Vis tools need to be where the computation & data

    are! Why? Because the purpose of visualization is to help user surface & understand useful information fast. 27 ! ! ! Slows analysis down Removes you from the analysis context
  25. Vis tools need to be where the computation & data

    are! Why? Because the purpose of visualization is to help user surface & understand useful information fast. 27 ! ! ! Slows analysis down Removes you from the analysis context
  26. Vis tools need to be where the computation & data

    are! Why? Because the purpose of visualization is to help user surface & understand useful information fast. 27 ! ! ! Slows analysis down Removes you from the analysis context
  27. Vis tools need to be where the computation & data

    are! Why? Because the purpose of visualization is to help user surface & understand useful information fast. 27 ! ! ! Apply Visualization Directly Stay in the context
  28. Vis tools need to be where the computation & data

    are! Why? Because the purpose of visualization is to help user surface & understand useful information fast. 28 Lex et al., 2014. IEEE Transactions on Visualization and Computer Graphics. | Conway et al., 2017. Bioinformatics. Original UpSet UpSetR
  29. Vis tools need to be where the computation & data

    are! Why? Because the purpose of visualization is to help user surface & understand useful information fast. 28 Lex et al., 2014. IEEE Transactions on Visualization and Computer Graphics. | Conway et al., 2017. Bioinformatics. Original UpSet UpSetR Took 3 years from the initial method to an integrated tool!
  30. Vis tools need to be where the computation & data

    are! Why? Because the purpose of visualization is to help user surface & understand useful information fast. 28 Lex et al., 2014. IEEE Transactions on Visualization and Computer Graphics. | Conway et al., 2017. Bioinformatics. Original UpSet UpSetR Took 3 years from the initial method to an integrated tool! Thanks to AI coding tools integration comes for free now!
  31. Vis tools need to be where the computation & data

    are! Why? Because the purpose of visualization is to help user surface & understand useful information fast. 29 Lekschas and Abdennur Dtour Thanks to AI Coding tools • Implementation of domain specific integration comes for free • Dtour implementation took only 2-3 days • Dtour offers JavaScript renderer and a Python (any)widget from the start https://dtour.dev
  32. 1. Integrability: vis tools should be where the computation &

    data are 2. Composability: vis tools should work with other tools 3. Scalability: vis tool should scale across data, display, and insight 4. Programmability: vis tools should be programmable 30
  33. Vis tools need to be composable! Why? Because we often

    need multiple visualization tools to explain complex patterns. 31
  34. Vis tools need to be composable! Why? Because we often

    need multiple visualization tools to explain complex patterns. 31 Hard to correlate visual patterns Need to move back and forth
  35. Vis tools need to be composable! Why? Because we often

    need multiple visualization tools to explain complex patterns. 31 Hard to correlate visual patterns Need to move back and forth
  36. Vis tools need to be composable! Why? Because we often

    need multiple visualization tools to explain complex patterns. 31 Compose and Interlink Visualizations
  37. Vis tools need to be composable! Why? Because we often

    need multiple visualization tools to explain complex patterns. 32 Keller et al., 2021 OSF Preprint. | Kerpedjiev et al., 2018. Genome Biology | Lekschas et al., 2024. arXiv. http://vitessce.io Vitessce HiGlass + Jupyter Scatter https://github.com/flekschas/jupyter-scatter-tutorial
  38. Vis tools need to be composable! 33 Lekschas, 2025. With

    AI: Integrate through NL and MCP w/ MCP-Web https://mcp-web.dev Uses HiGlass from Kerpedjiev et al., 2018. Genome Biology https://higlass.io
  39. Vis tools need to be composable! 34 Lekschas, 2025. With

    AI: Integrate through NL and MCP w/ MCP-Web https://mcp-web.dev Uses HiGlass from Kerpedjiev et al., 2018. Genome Biology https://higlass.io
  40. 1. Integrability: vis tools should be where the computation &

    data are 2. Composability: vis tools should work with other tools 3. Scalability: vis tool should scale across data, display, and insight 4. Programmability: vis tools should be programmable 35
  41. Vis tools need to be scalable! Why? Dataset and insights

    they contain are only ever going to increase in size. 36 Presumed Context Presumed Context
  42. Vis tools need to be scalable! Why? Dataset and insights

    they contain are only ever going to increase in size. 36 Might prevent future tool usage Presumed Context Presumed Context
  43. Vis tools need to be scalable! Why? Dataset and insights

    they contain are only ever going to increase in size. 37 Presumed Use Case: Hundreds of Samples Eventual Use Case: Thousands of Samples
  44. Vis tools need to be scalable! Why? Dataset and insights

    they contain are only ever going to increase in size. 37 Presumed Use Case: Hundreds of Samples Eventual Use Case: Thousands of Samples SVG Rendering Slows Everything Down WebGL Rendering Scales to Millions!
  45. Vis tools need to be scalable! Why? Dataset and insights

    they contain are only ever going to increase in size. 38 Lekschas et al., 2020. Computer Graphics Forum. | Manz et al., 2022. Nature Methods. http://viv.gehlenborglab.org VIV https://peax.lekschas.de HiGlass + ML = Peax
  46. 1. Integrability: vis tools should be where the computation &

    data are 2. Composability: vis tools should work with other tools 3. Scalability: vis tool should scale across data, display, and insight 4. Programmability: vis tools should be programmable 39
  47. 1. Integrability: vis tools should be where the computation &

    data are 2. Composability: vis tools should work with other tools 3. Scalability: vis tool should scale across data, display, and insight 4. Programmability: vis tools should be programmable 40
  48. Vis tools need to be programmable! Why? We need AI/ML

    to guide the visual exploration and surface interesting patterns. 41
  49. Vis tools need to be programmable! Why? We need AI/ML

    to guide the visual exploration and surface interesting patterns. 41 Surfacing all insights manually takes time
  50. Vis tools need to be programmable! Why? We need AI/ML

    to guide the visual exploration and surface interesting patterns. 41 Surfacing all insights manually takes time Methodological context might not be accessible
  51. Vis tools need to be programmable! Why? We need AI/ML

    to guide the visual exploration and surface interesting patterns. 42 Lekschas et al., 2020. Computer Graphics Forum. | Manz et al., 2024. OSF Preprint. https://peax.lekschas.de HiGlass + ML = Peax Gosling (plus AI as in GenoRec) https://gosling-lang.org
  52. Four Axes of Tool Friction Visualization Tools with less Friction

    45 Reduce preparation Lower switching cost Raise ceiling
  53. The Purpose of Data Visualization AI Visualization Tools with les

    Friction 46 Further reduce preparation Lower switch- ing cost Drastically raise ceiling Lower learning curve
  54. The Impact of AI on Visualization Tools Two Shifts for

    Data Visualization Tools Democratized Access Before: Scientific and real world complexity inevitably led to complex visualization tools. With AI: Users can focus on intent and have AI translate it to UI operations 48 Fast Prototypes & Real Tools Before: Many visualization tools got stuck in the prototype phase and lack non-visualization features. With AI: As implementation becomes free, there is no more reason not to get stuck in the prototype phase.
  55. The Impact of AI on Visualization Tools Bottlenecks Shifts 49

    Before AI Implementation With AI Domain Expertise, Judgement, Taste
  56. The Impact of AI on Visualization Tools Bottlenecks Shifts 49

    Before AI Implementation With AI Domain Expertise, Judgement, Taste Specs: design specs and tool specs/grammars!
  57. The Impact of AI on Visualization Tools Fast Prototypes &

    Real Tools: dtour 50 Dtour.dev A tool for exploring high- dimensional data through guided, manual, & grand tours Timeline: +2 years thinking about the problem 2 days working prototype +4 weeks integrated composable scalable tool Ongoing... evaluating insights
  58. The Impact of AI on Visualization Tools Fast Prototypes &

    Real Tools: dtour 52 Dtour.dev A tool for exploring high- dimensional data through guided, manual, & grand tours Timeline: +2 years thinking about the problem 2 days working prototype +4 weeks integrated composable scalable tool Ongoing... evaluating insights
  59. The Impact of AI on Visualization Tools AI Composable Tools

    through Programmability: MCP-Web 53 MCP-web.dev Expose your visualization tool to any AI agent for mixed-initiate interactions w/ declarative spec-based state Interactions: Language-Driven AI controls tools → spec Mouse-Driven User controls GUIs → spec Human+AI parity Human and AI control same frontend state
  60. The Impact of AI on Visualization Tools AI Composable Tools

    through Programmability: MCP-Web 54 MCP-web.dev Expose your visualization tool to any AI agent for mixed-initiate interactions w/ declarative spec-based state Interactions: Language-Driven AI controls tools → spec Mouse-Driven User controls GUIs → spec Human+AI parity Human and AI control same frontend state
  61. The Impact of AI on Visualization Tools Optimized AI Software:

    Ridge AI 55 Ridgedata.ai AI-native tools that let users intelligently create and explore data-rich dashboards. Constrains: Scoped Specs To generate dashboards fast Automatic Interactions For mouse interactions Constraint Flow Intent → Queries → Plots © 2026 Ridge AI, Inc.
  62. The Impact of AI on Visualization Tools Optimized AI Software:

    Ridge AI 56 Ridgedata.ai AI-native tools that let users intelligently create and explore data-rich dashboards. Constrains: Scoped Specs To generate dashboards fast Automatic Interactions For mouse interactions Constraint Flow Intent → Queries → Plots © 2026 Ridge AI, Inc.
  63. The Impact of AI on Visualization Tools The New Focus

    of Building Visualization Tools Build Modular Reusable and composable tools will win as AI can integrate those into a coherent UI. 57 Know Your User Understanding what users really need is more critical than ever. Constraint are Architecture Smart constraints unlock good and fast results. This is the core engineering task. Know What and Why You Build While implementation isn't a differentiator. You can't constrain what you don't know.
  64. Closing Thoughts Open Problems The right friction How can we

    streamline exploration while engaging users for productive insights? 59 Visualization agent harnesses What constraints enable agents to match the speed of visual exploration? Trust and attribution What makes a pattern trustworthy? The algorithm, the trail to it, or how it's shown? Cross-tool protocols Is MCP all we need to make data and visualization tools work together?