Upgrade to Pro — share decks privately, control downloads, hide ads and more …

Monitoring mit Prometheus

Monitoring mit Prometheus

Wie überwacht man eine dynamische Wolke von Microservices, in der das ständige Fehlschlagen von Services zum Normalfall wird?

Success-Stories von Netflix, Google oder Soundcloud befeuern einen der wichtigsten Entwicklungen in der Software-Architektur unserer Tage: Microservices. Applikationen werden dabei in viele kleine Services zerlegt, die unabhängig voneinander betrieben, skaliert und gewartet werden können.

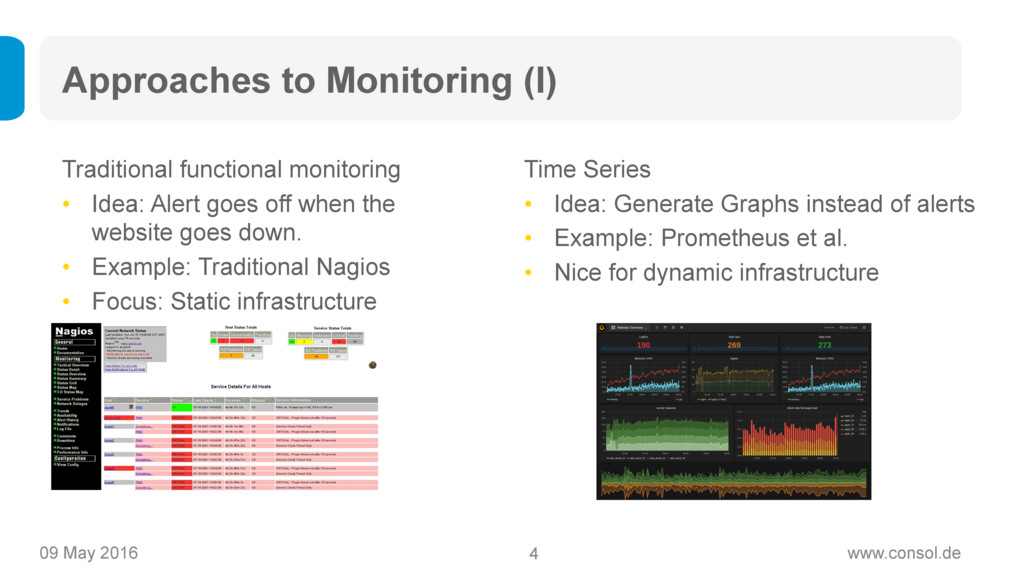
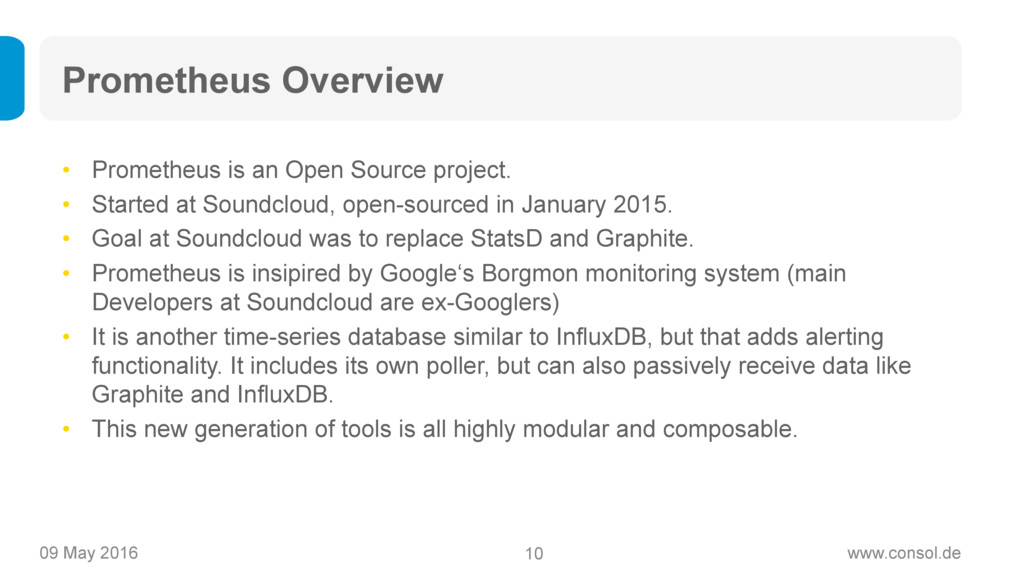
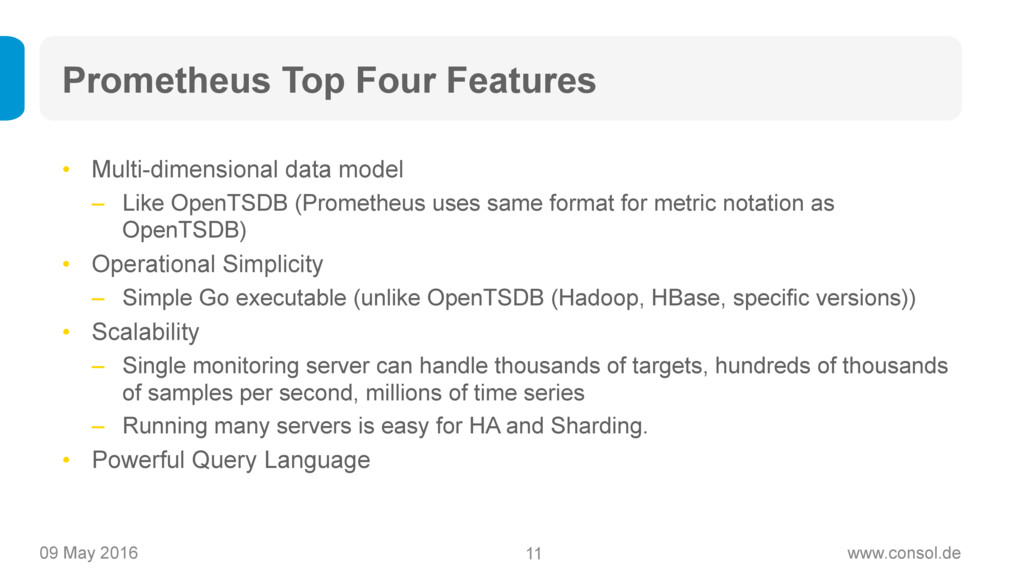
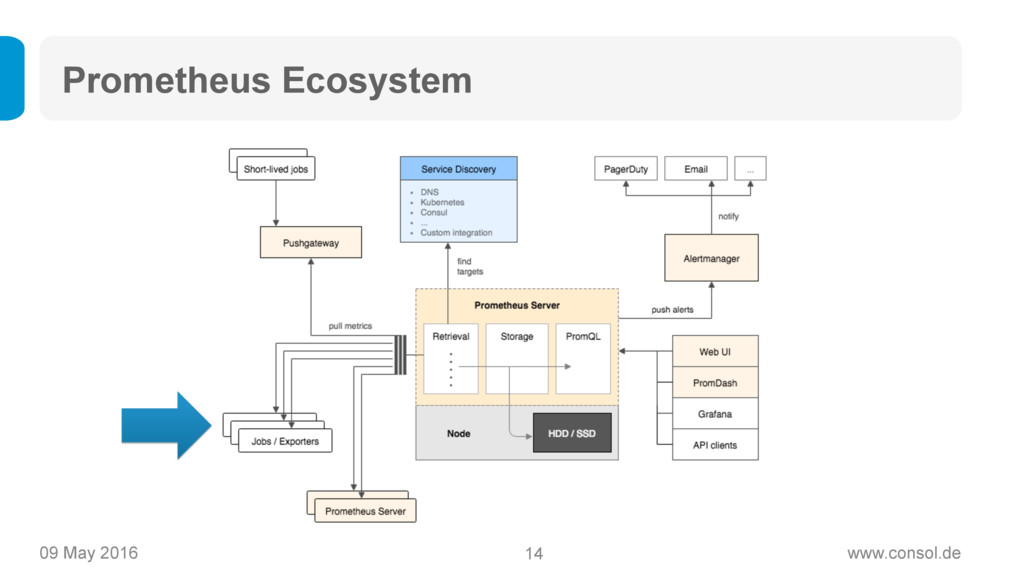
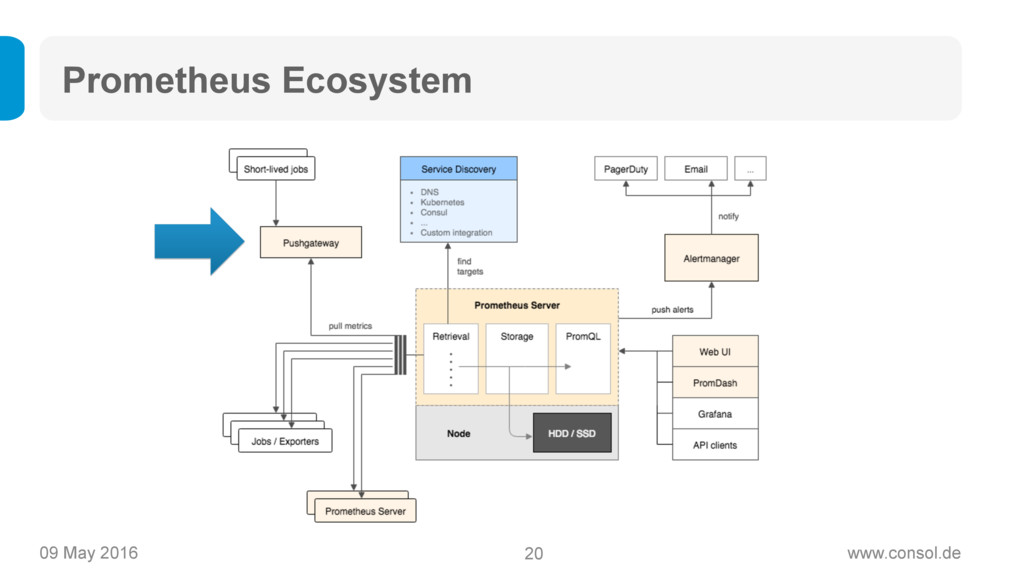
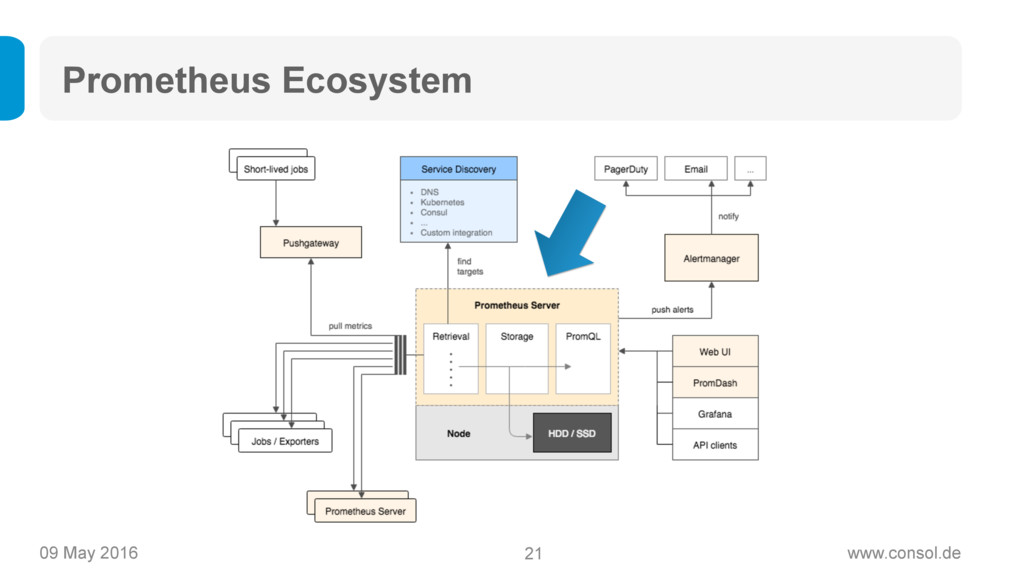
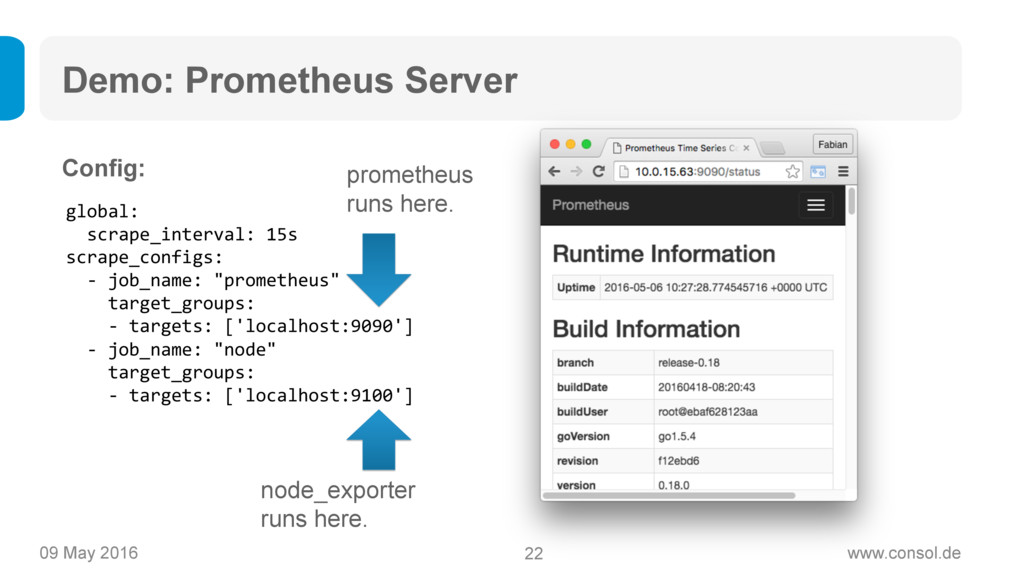
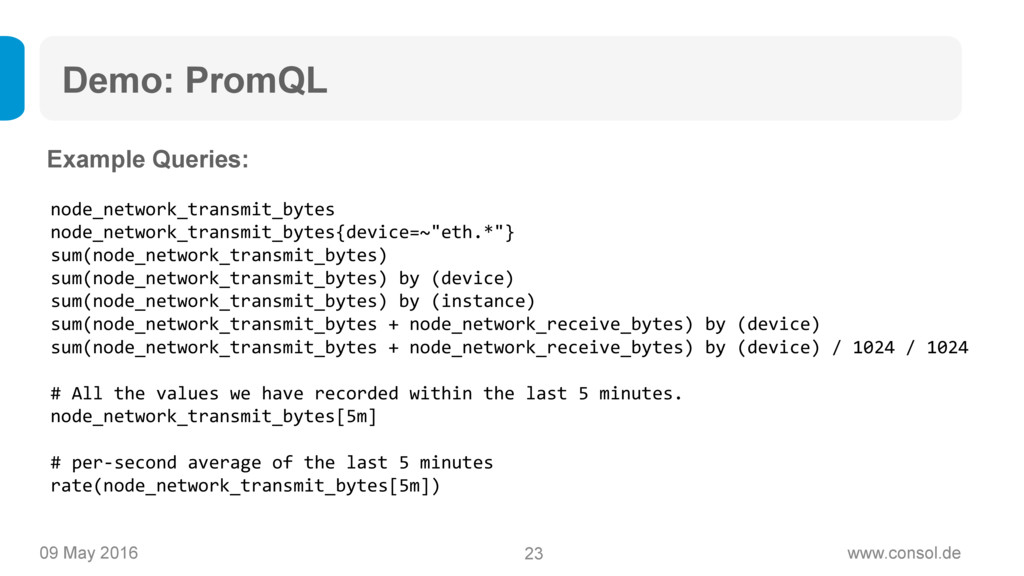
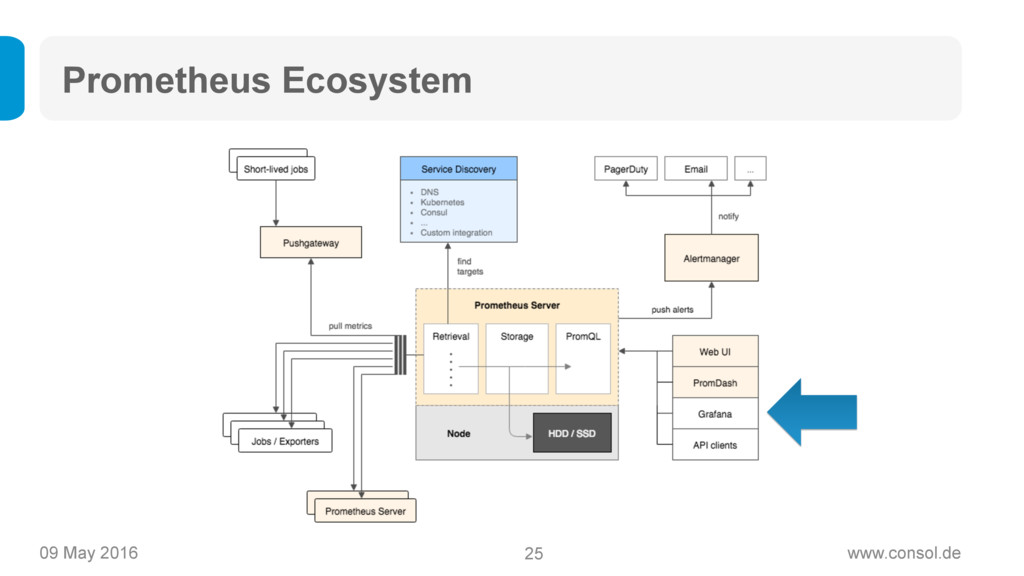
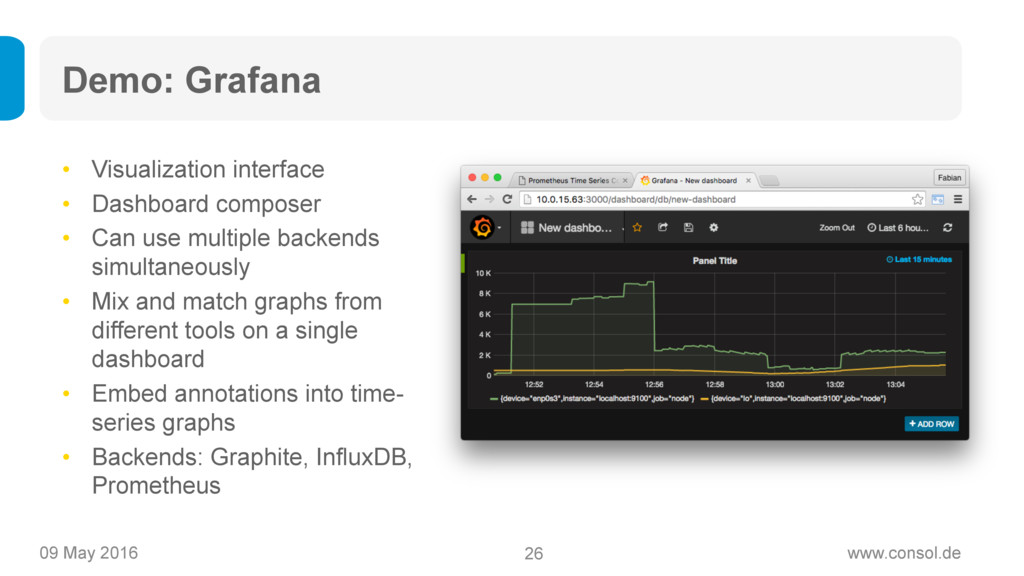
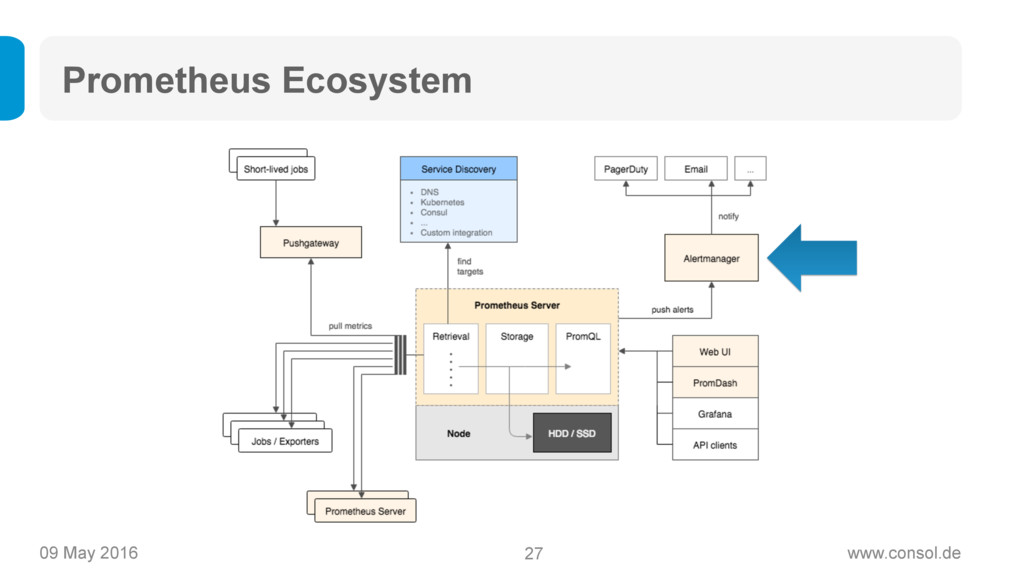
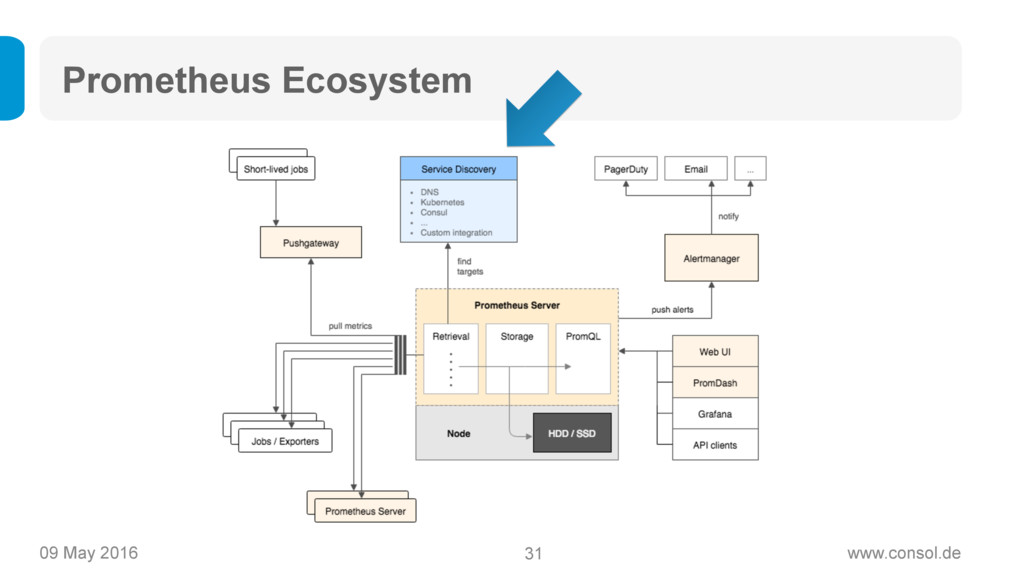
Prometheus (https://www.prometheus.io) ist ein Open Source Projekt von Soundcloud, das als der neue Heilsbringer für Monitoring von modernen, dynamischen Microservice-Architekturen gilt: Das Time-Series-Datenmodell ermöglicht statistisches Monitoring, Prometheus ist einfach aufzusetzen und zu betreiben, es ist super skalierbar und bringt eine mächtige Query-Sprache mit sich.

---

http://www.meetup.com/de-DE/Munchner-Monitoring-Stammtisch/events/230654620/

Fabian Stäber

May 09, 2016
Tweet

More Decks by Fabian Stäber

Other Decks in Programming

Transcript

  1. Contents Part 1 (Slides) •  Monitoring Categories: –  Traditional functional

    monitoring vs. time series –  Push vs. pull •  Best practice: Why is Nagios so successful? •  Prometheus Overview •  Prometheus: Four Top Features 09 May 2016 www.consol.de 2 Part 2 (Demo) •  Instrumentation / Exporting Metrics –  OS Metrics –  Application Metrics (Java) –  Docker •  Querying •  Grafana Dashboard
  2. Contents Part 1 (Slides) •  Monitoring Categories: –  Traditional functional

    monitoring vs. time series –  Push vs pull •  Best practice: Why is Nagios so successful? •  Prometheus Overview •  Prometheus: Four Top Features 09 May 2016 www.consol.de 3 Part 2 (Demo) •  Instrumentation / Exporting Metrics –  OS Metrics –  Application Metrics (Java) –  Docker •  Querying •  Grafana Dashboard
  3. Approaches to Monitoring (I) Traditional functional monitoring •  Idea: Alert

    goes off when the website goes down. •  Example: Traditional Nagios •  Focus: Static infrastructure 09 May 2016 www.consol.de 4 Time Series •  Idea: Generate Graphs instead of alerts •  Example: Prometheus et al. •  Nice for dynamic infrastructure
  4. Contents Part 1 (Slides) •  Monitoring Categories: –  Traditional functional

    monitoring vs. time series –  Push vs. pull •  Best practice: Why is Nagios so successful? •  Prometheus Overview •  Prometheus: Four Top Features 09 May 2016 www.consol.de 5 Part 2 (Demo) •  Instrumentation / Exporting Metrics –  OS Metrics –  Application Metrics (Java) –  Docker •  Querying •  Grafana Dashboard
  5. Approaches to Monitoring (II) Push •  Examples: ELK stack • 

    Do not poll, but passively accept data •  Providing new hosts is effortless •  More efficient for traditional monitoring (where each pull triggers a check and waits for the check to be executed) 09 May 2016 www.consol.de 6 Pull •  Example: Prometheus •  High availability made easy •  Functional sharding made easy •  Server cannot be overwhelmed
  6. Contents Part 1 (Slides) •  Monitoring Categories: –  Traditional functional

    monitoring vs. time series –  Push vs. pull •  Best practice: Why is Nagios so successful? •  Prometheus Overview •  Prometheus: Four Top Features 09 May 2016 www.consol.de 7 Part 2 (Demo) •  Instrumentation / Exporting Metrics –  OS Metrics –  Application Metrics (Java) –  Docker •  Querying •  Grafana Dashboard
  7. Why is Nagios (and its derivates) so Successful? Prometheus adapts

    the modular approach and takes it even further, as GUI and alerting are also independent tools. It is easy for applications to integrate with Prometheus! 09 May 2016 www.consol.de 8 •  Its strength is that it’s really just a scheduler and event handler, and all the complicated check work is done by a highly modular and portable system of plugins. •  Easy to write checks, as checks are stand-alone programs •  Thriving ecosystem of checks (monitoring plugins) •  Ubiquitous, everyone in the industry has some experience with Nagios configs.
  8. Contents Part 1 (Slides) •  Monitoring Categories: –  Traditional functional

    monitoring vs. time series –  Push vs. pull •  Best practice: Why is Nagios so successful? •  Prometheus Overview •  Prometheus: Four Top Features 09 May 2016 www.consol.de 9 Part 2 (Demo) •  Instrumentation / Exporting Metrics –  OS Metrics –  Application Metrics (Java) –  Docker •  Querying •  Grafana Dashboard
  9. Prometheus Overview •  Prometheus is an Open Source project. • 

    Started at Soundcloud, open-sourced in January 2015. •  Goal at Soundcloud was to replace StatsD and Graphite. •  Prometheus is insipired by Google‘s Borgmon monitoring system (main Developers at Soundcloud are ex-Googlers) •  It is another time-series database similar to InfluxDB, but that adds alerting functionality. It includes its own poller, but can also passively receive data like Graphite and InfluxDB. •  This new generation of tools is all highly modular and composable. 09 May 2016 www.consol.de 10
  10. Prometheus Top Four Features •  Multi-dimensional data model –  Like

    OpenTSDB (Prometheus uses same format for metric notation as OpenTSDB) •  Operational Simplicity –  Simple Go executable (unlike OpenTSDB (Hadoop, HBase, specific versions)) •  Scalability –  Single monitoring server can handle thousands of targets, hundreds of thousands of samples per second, millions of time series –  Running many servers is easy for HA and Sharding. •  Powerful Query Language 09 May 2016 www.consol.de 11
  11. Contents Part 1 (Slides) •  Monitoring Categories: –  Traditional functional

    monitoring vs. time series –  Push vs. pull •  Best practice: Why is Nagios so successful? •  Prometheus Overview •  Prometheus: Four Top Features 09 May 2016 www.consol.de 12 Part 2 (Demo) •  Instrumentation / Exporting Metrics –  OS Metrics –  Application Metrics (Java) –  Docker •  Querying •  Grafana Dashboard
  12. Contents Part 1 (Slides) •  Monitoring Categories: –  Traditional functional

    monitoring vs. time series –  Push vs. pull •  Best practice: Why is Nagios so successful? •  Prometheus Overview •  Prometheus: Four Top Features 09 May 2016 www.consol.de 13 Part 2 (Demo) •  Instrumentation / Exporting Metrics –  OS Metrics –  Application Metrics (Java) –  Docker •  Querying •  Grafana Dashboard
  13. Exporter vs Instrumentation Two ways of monitoring services: •  Instrument

    service with one of the client libraries –  Official: Go, Java, Ruby, Python –  Unofficial: dotNet/C#, NodeJS, Bash •  Exporters –  If you cannot / don‘t want to patch your services (like basic Linux kernel metrics), you can use an exporter as a „middleware“ between your service and Prometheus. –  Lot of exporters available (see after the demo) 09 May 2016 www.consol.de 15 Will demo exporters in a minute!!! DIY
  14. Demo: Prometheus Server 09 May 2016 www.consol.de 22 global: scrape_interval:

    15s scrape_configs: - job_name: "prometheus" target_groups: - targets: ['localhost:9090'] - job_name: "node" target_groups: - targets: ['localhost:9100'] Config: node_exporter runs here. prometheus runs here.
  15. Demo: PromQL 09 May 2016 www.consol.de 23 node_network_transmit_bytes node_network_transmit_bytes{device=~"eth.*"} sum(node_network_transmit_bytes)

    sum(node_network_transmit_bytes) by (device) sum(node_network_transmit_bytes) by (instance) sum(node_network_transmit_bytes + node_network_receive_bytes) by (device) sum(node_network_transmit_bytes + node_network_receive_bytes) by (device) / 1024 / 1024 # All the values we have recorded within the last 5 minutes. node_network_transmit_bytes[5m] # per-second average of the last 5 minutes rate(node_network_transmit_bytes[5m]) Example Queries:
  16. Demo: Grafana •  Visualization interface •  Dashboard composer •  Can

    use multiple backends simultaneously •  Mix and match graphs from different tools on a single dashboard •  Embed annotations into time- series graphs •  Backends: Graphite, InfluxDB, Prometheus 09 May 2016 www.consol.de 26
  17. Alert Manager •  Same flexible Query Language as for Graphs

    •  Alerts can inherit same labels as the time series they are based on: –  Which instance is failing –  What sub-thing in this instance is causing problems –  Can silence very specificly by any label set, for example: everything in a particular zone / from a particular job / with a label matching a regex / for two hours. 09 May 2016 www.consol.de 28
  18. Alert Manager: Step 1, Step 2, Step 3 09 May

    2016 www.consol.de 29 # Alert for any instance that have a median request latency >1s. ALERT APIHighRequestLatency IF api_http_request_latencies_second{quantile="0.5"} > 1 FOR 1m ANNOTATIONS { summary = "High request latency on {{ $labels.instance }}", description = "{{ $labels.instance }} has a median request latency above 1s (current value: {{ $value }}s)", } Step 1: Alerting rules are configured in Prometheus: Same query language as for graphs.
  19. Alert Manager: Step 1, Step 2, Step 3 09 May

    2016 www.consol.de 30 Step 2: Start prometheus with -alertmanager-url command line flag. Step 3: Run Alert Manager and configure it with the following: •  Grouping of alerts •  Inhibition / notification rate limiting •  Silencing alert dependencies Available receivers: •  email •  https://www.pagerduty.com •  https://pushover.net •  https://slack.com •  https://www.opsgenie.com •  webhook
  20. Dynamic Service discovery Out-of-the-box service discovery for: •  DNS-SD: DNS

    Service Discovery. This is a DNS extension using DNS SRV records to get IPs and Ports of current services. Used internally at Soundcloud. •  Consul: Service discovery tool by Hashicorp. •  Kubernetes: Container orchestration by Google. •  Marathon: Container orchestration for Apache Mesos. •  Zookeeper: Java-based distributed config, service discovery via Nerve or Serversets. •  EC2: Amazon Cloud •  File-Watcher: Directory with config files is watched by Prometheus. New services create new files. Generic approach to plug in any kind of mechanism. 09 May 2016 www.consol.de 32
  21. Related Talks •  The Open-Source Monitoring Landscape by Michael Merideth,

    VictorOps: http://www.slideshare.net/vo_mike/the-opensource-monitoring-landscape •  Prometheus: A Next-Generation Monitoring System (Talk) by Julius Volz and Björn Rabenstein, SoundCloud: https://www.usenix.org/conference/srecon15europe/program/presentation/ rabenstein •  Prometheus service discovery for Kubernetes & Openshift Origin by Jimmy Dyson, RedHat: https://vimeo.com/139706674 09 May 2016 www.consol.de 33
  22. 34 www.consol.de ConSol Software GmbH Franziskanerstraße 38 D-81669 München Tel:

    +49-89-45841-100 Fax: +49-89-45841-111 [email protected] www.consol.de 09 May 2016