Upgrade to Pro — share decks privately, control downloads, hide ads and more …

Scalable Kernel Density Classification via Threshold-Based Pruning

Scalable Kernel Density Classification via Threshold-Based Pruning

More Decks by Stanford Future Data Systems

Other Decks in Research

Transcript

  1. Scalable Kernel Density Classification
    via Threshold-Based Pruning
    Edward Gan & Peter Bailis
    1

    View Slide

  2. • Increasing Streaming Data
    • Manufacturing, Sensors, Mobile
    • Multi-dimensional + Latent anomalies
    • Running in production
    • see CIDR17, SIGMOD17
    • End-to-end operator cascades for:
    • Feature Transformation
    • Statistical Classification
    • Data Summarization
    MacroBase: Analytics on Fast Streams
    2

    View Slide

  3. Example: Space Shuttle Sensors
    3
    8 Sensors Total
    “Fuel Flow”
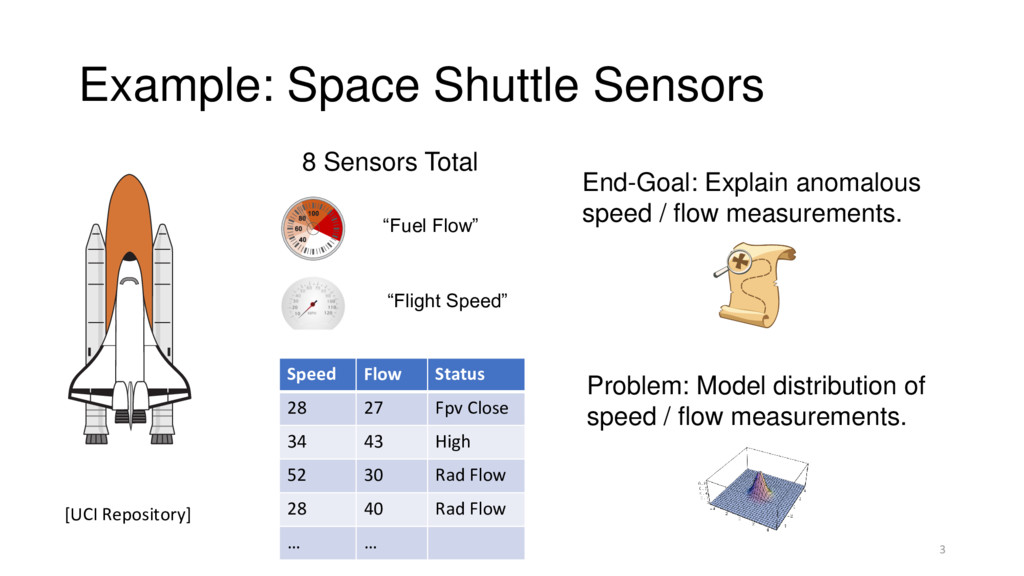
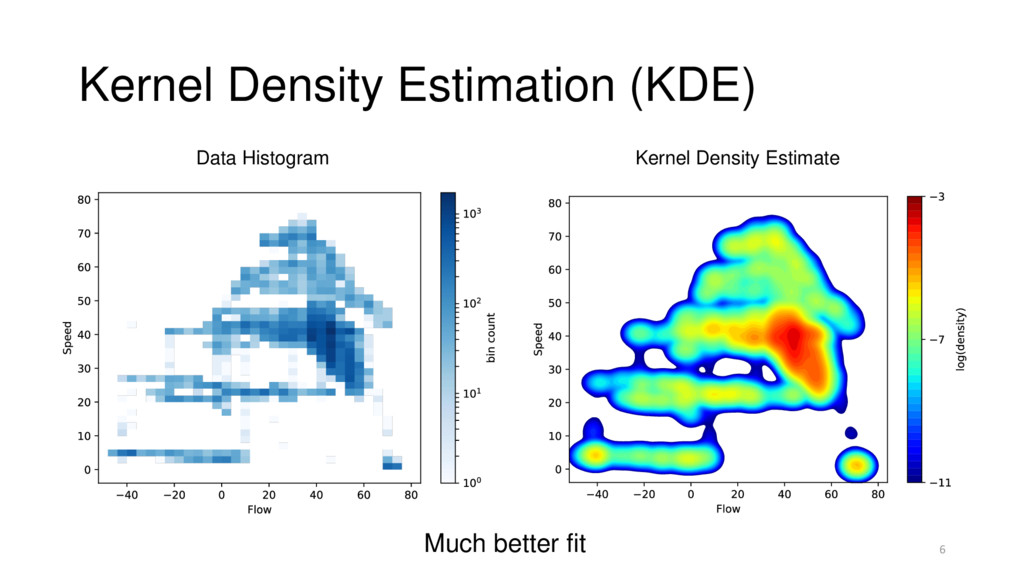
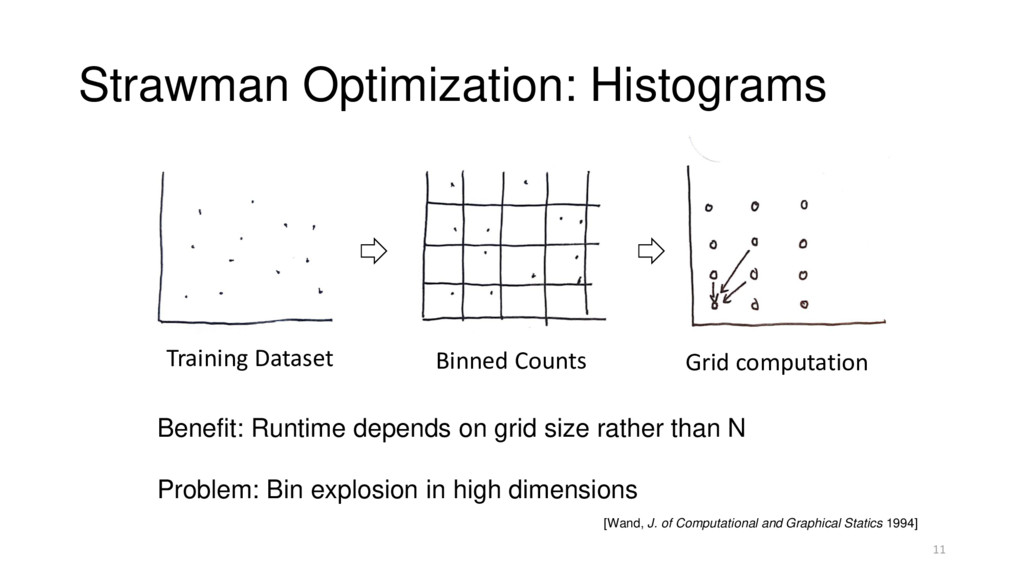
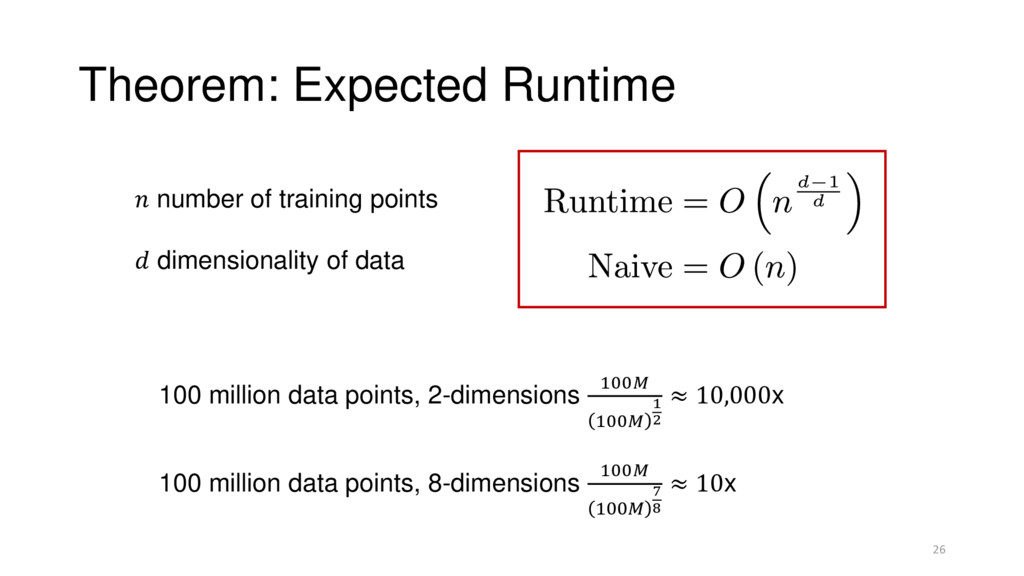
    “Flight Speed”
    [UCI Repository]
    Speed Flow Status
    28 27 Fpv Close
    34 43 High
    52 30 Rad Flow
    28 40 Rad Flow
    … …
    End-Goal: Explain anomalous
    speed / flow measurements.
    Problem: Model distribution of
    speed / flow measurements.

    View Slide

  4. Difficulties in Data Modelling
    4
    Data Histogram Gaussian Model
    Poor Fit

    View Slide

  5. Difficulties in Data Modelling
    Inaccurate: Gaps not captured
    Data Histogram Mixture of Gaussians
    5

    View Slide

  6. Kernel Density Estimation (KDE)
    6
    Data Histogram Kernel Density Estimate
    Much better fit

    View Slide

  7. KDE: Statistical Gold Standard
    • Guaranteed to converge to the underlying distribution
    • Provides normalized, true probability densities
    • Few assumptions about shape of distribution: inferred from data
    7

    View Slide

  8. KDE Usage
    Galaxy Mass Distribution
    [Sloan Digital Sky Survey]
    Distribution of Bowhead Whales
    [L.T. Quackenbush et al, Arctic 2010]
    8

    View Slide

  9. KDE Definition
    9
    Each point in dataset contributes a kernel
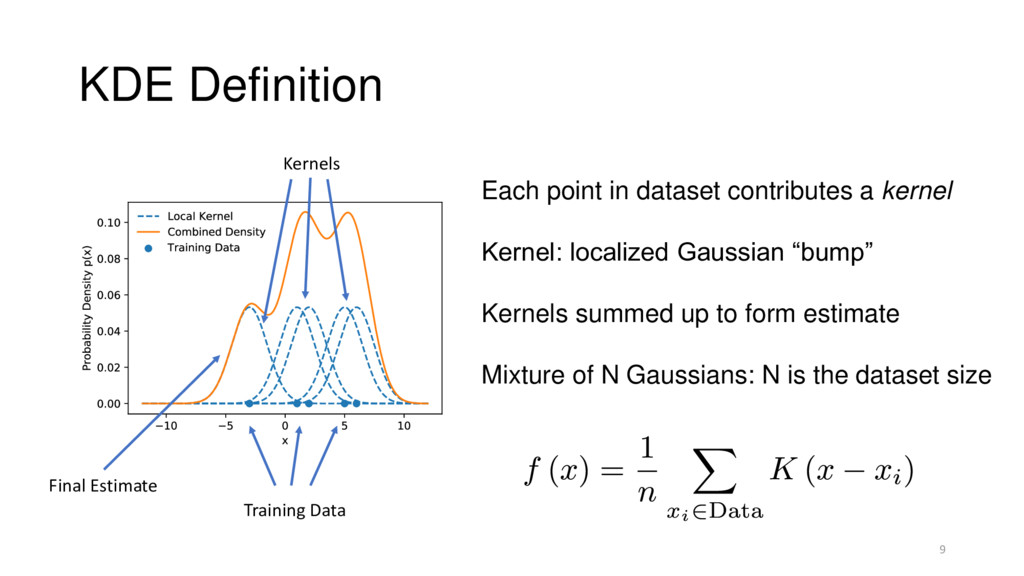
    Kernel: localized Gaussian “bump”
    Kernels summed up to form estimate
    Mixture of N Gaussians: N is the dataset size
    Training Data
    Kernels
    Final Estimate

    View Slide

  10. Problem: KDE does not scale
    10

    () to compute single density ()
    How can we speed this up?
    Training Data
    (2) to compute all densities in data
    2 hours to compute on 1M points
    on 2.9Ghz Core i5

    View Slide

  11. Strawman Optimization: Histograms
    Training Dataset Binned Counts Grid computation
    Benefit: Runtime depends on grid size rather than N
    Problem: Bin explosion in high dimensions
    11
    [Wand, J. of Computational and Graphical Statics 1994]

    View Slide

  12. SELECT flight_mode FROM shuttle_sensors
    WHERE kde(flow,speed) < threshold
    Stepping Back: What users need
    12
    SELECT color FROM galaxies
    WHERE kde(x,y,z) < threshold
    Anomaly Explanation
    Hypothesis Testing

    View Slide

  13. From Estimation to Classification
    13
    SELECT flight_mode FROM shuttle_sensors
    WHERE kde(flow,speed) < Threshold
    Training Data KDE Model Classification

    View Slide

  14. End to End Query
    14
    Kernel Density
    Estimation
    Threshold Filter

    High ≥
    Low <

    Training Data Densities Classification
    Unnecessary for final output

    View Slide

  15. End to End Query
    15
    Kernel Density Estimation
    Threshold Filter

    High ≥
    Low <

    Training Data Classification

    View Slide

  16. Recap
    • KDE can model complex distributions
    • Problem: KDE scales quadratically with dataset size
    • Real Usage: KDE + Predicates = Kernel Density Classification
    • Idea: Apply Predicate Pushdown to KDE
    16

    View Slide

  17. tkdc Algorithm Overview
    1. Pick a threshold
    2. Repeat: Calculate bounds on point density
    3. Stop when we can make a classification
    17

    View Slide

  18. Classifying the density based on bounds
    18
    Threshold
    Upper Bound
    Lower Bound
    Density
    Upper Bound
    Lower Bound
    True Density () Classified
    Classified
    Threshold
    Pruning Rules

    View Slide

  19. Iterative Refinement
    19
    Threshold
    Upper Bound
    Lower Bound
    Density
    Algorithm Iterations
    Hit Pruning Rule
    How to compute bounds?

    View Slide

  20. k-d tree Spatial Indices
    Divide N-dimensional space
    1 axis at a time
    20
    Nodes for each Region
    Track # of points + bounding box

    View Slide

  21. Bounding the densities
    Given from k-d tree: Bounding Box, # 
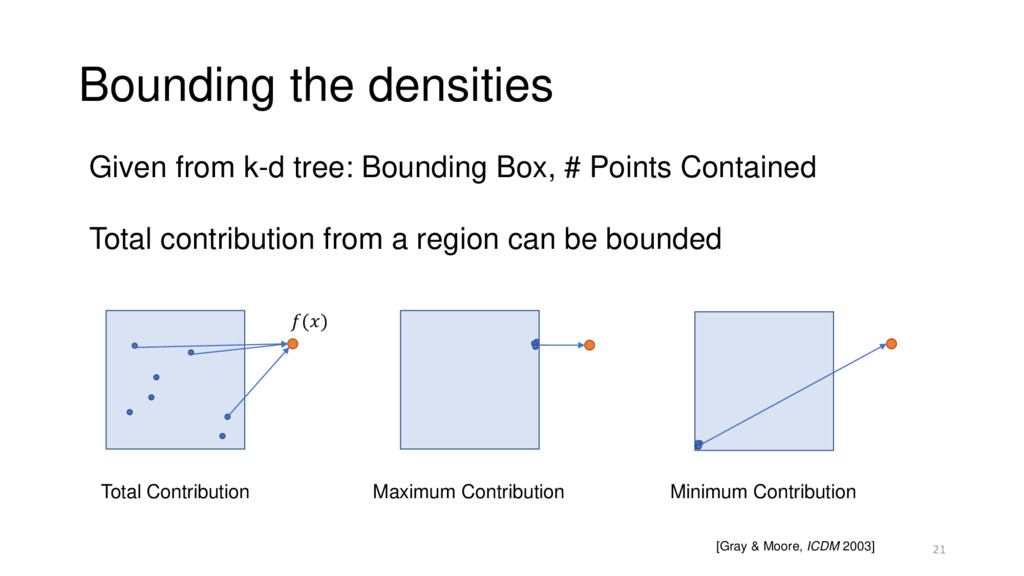
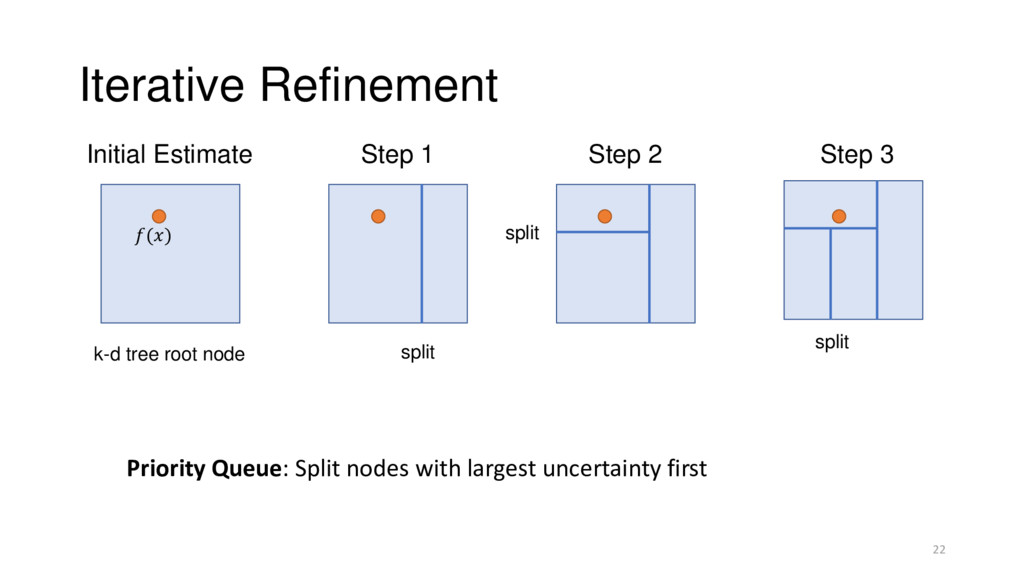
Points Contained
    Total contribution from a region can be bounded
    [Gray & Moore, ICDM 2003] 21
    Total Contribution Maximum Contribution Minimum Contribution
    ()

    View Slide

  22. Iterative Refinement
    Initial Estimate
    Priority Queue: Split nodes with largest uncertainty first
    22
    Step 1
    k-d tree root node split
    split
    split
    ()
    Step 2 Step 3

    View Slide

  23. tkdc Algorithm Overview
    1. Pick a threshold
    • User-Specified
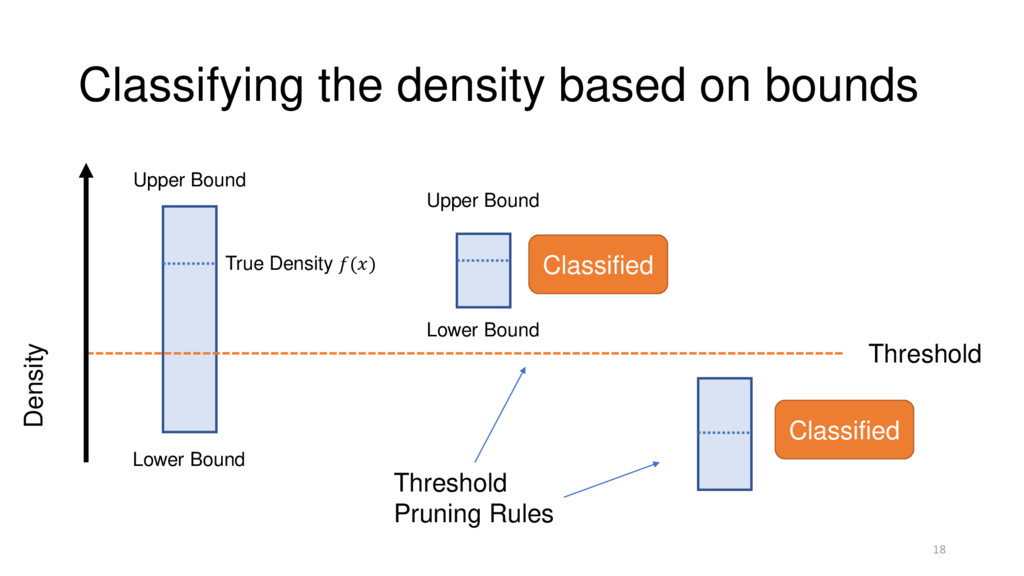
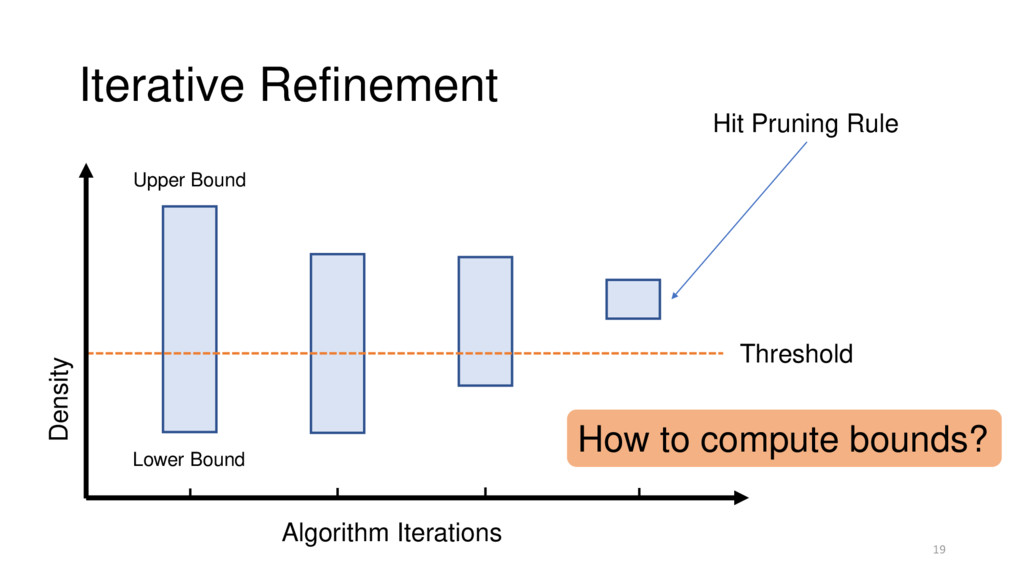
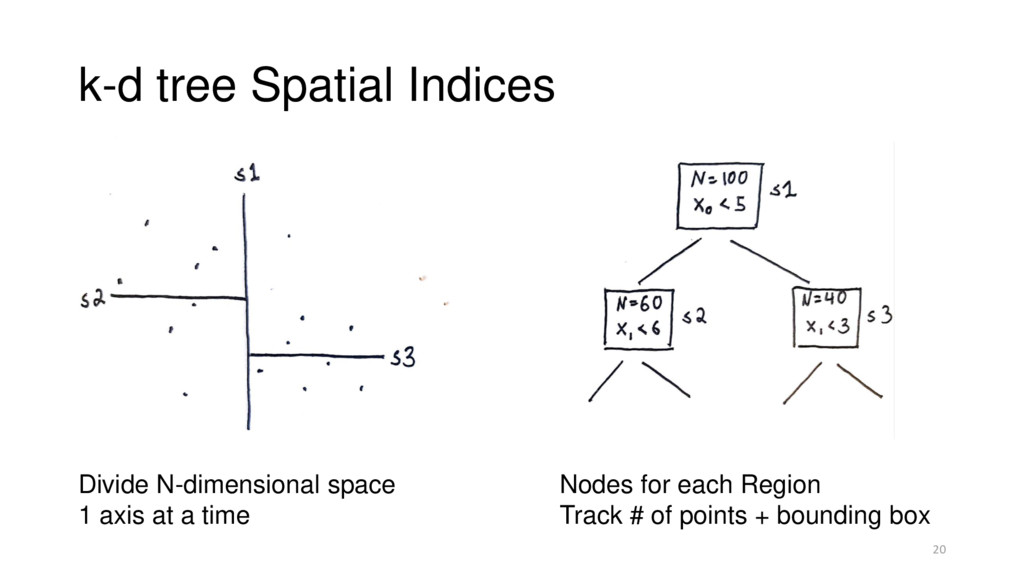
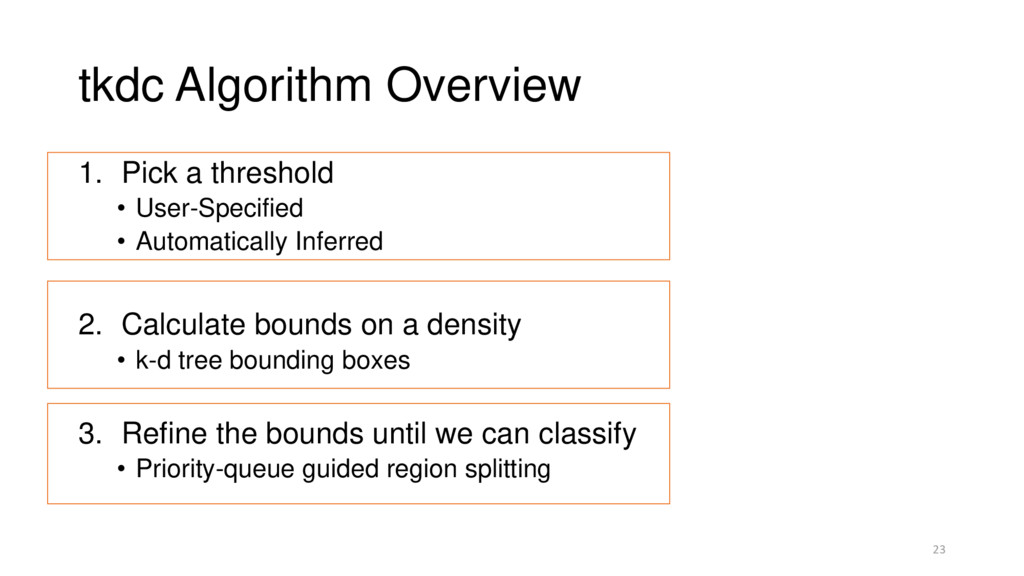
    • Automatically Inferred
    2. Calculate bounds on a density
    • k-d tree bounding boxes
    3. Refine the bounds until we can classify
    • Priority-queue guided region splitting
    23

    View Slide

  24. Automatic Threshold Selection
    • Probability Densities hard to work with:
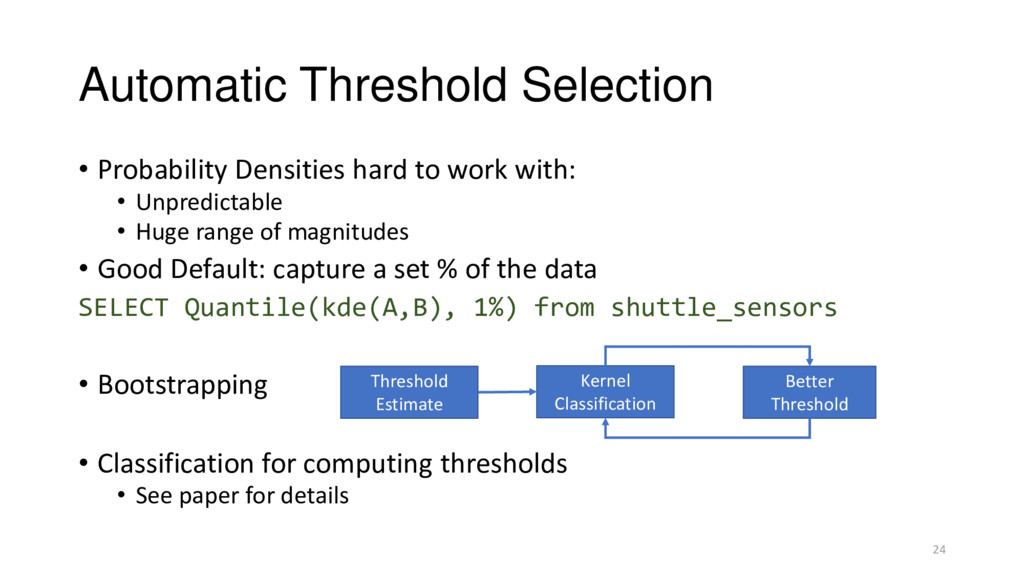
    • Unpredictable
    • Huge range of magnitudes
    • Good Default: capture a set % of the data
    SELECT Quantile(kde(A,B), 1%) from shuttle_sensors
    • Bootstrapping
    • Classification for computing thresholds
    • See paper for details
    Kernel
    Classification
    Better
    Threshold
    Threshold
    Estimate
    24

    View Slide

  25. tkdc Complete Algorithm
    • Pick a threshold
    • Inferred given desired % level
    • Calculate bounds on a density
    • k-d tree bounding boxes
    • Refine the bounds until we can make classification
    • Priority-queue guided region splitting
    25

    View Slide

  26. Theorem: Expected Runtime
    26
    100 million data points, 2-dimensions 100
    100
    1
    2
    ≈ 10,000x
    100 million data points, 8-dimensions 100
    100
    7
    8
    ≈ 10x
    number of training points
    dimensionality of data

    View Slide

  27. Runtime in practice: Experimental Setup
    Single Threaded, In-memory
    Total Time 
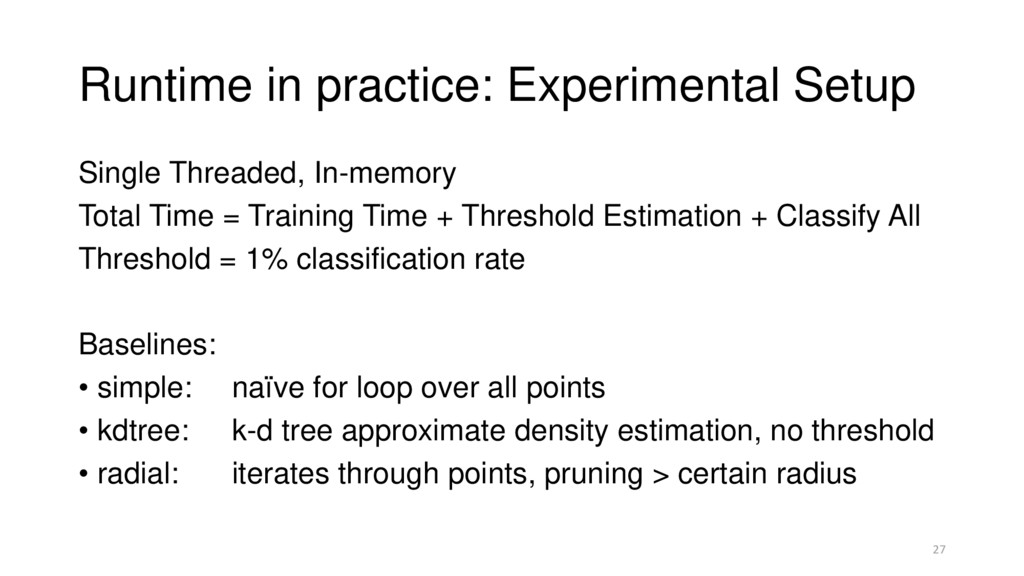
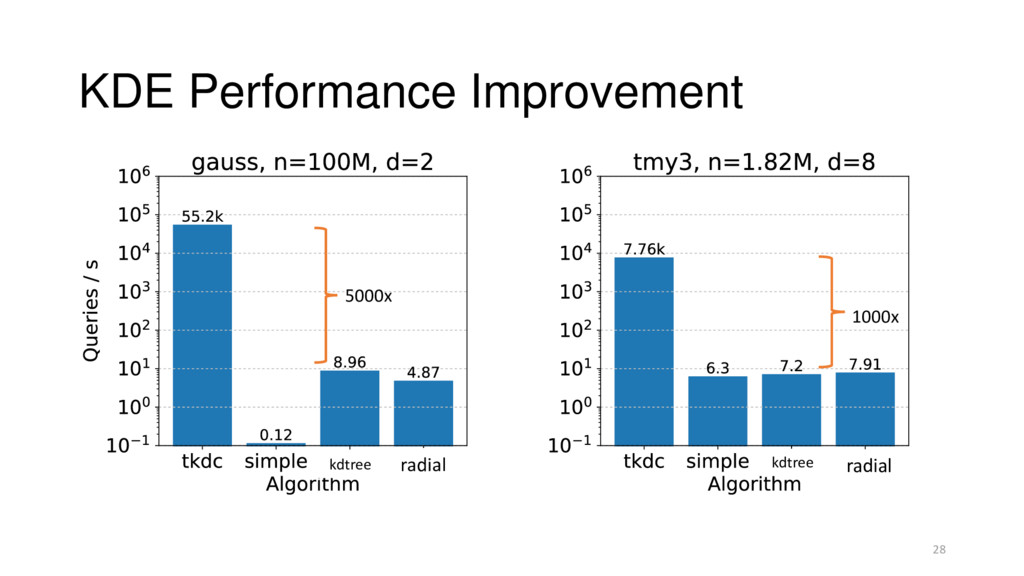
= Training Time + Threshold Estimation + Classify All
    Threshold = 1% classification rate
    Baselines:
    • simple: naïve for loop over all points
    • kdtree: k-d tree approximate density estimation, no threshold
    • radial: iterates through points, pruning > certain radius
    27

    View Slide

  28. KDE Performance Improvement
    28
    radial radial
    5000x
    1000x
    kdtree kdtree

    View Slide

  29. Threshold Pruning Contribution
    29

    View Slide

  30. tkdc scales well with dataset size
    30
    Asymptotic Speedup
    Our Algorithm: tkdc

    View Slide

  31. Conclusion
    Predicate Pushdown, k-d tree indices:
    1000x, Asymptotic Speedups
    31
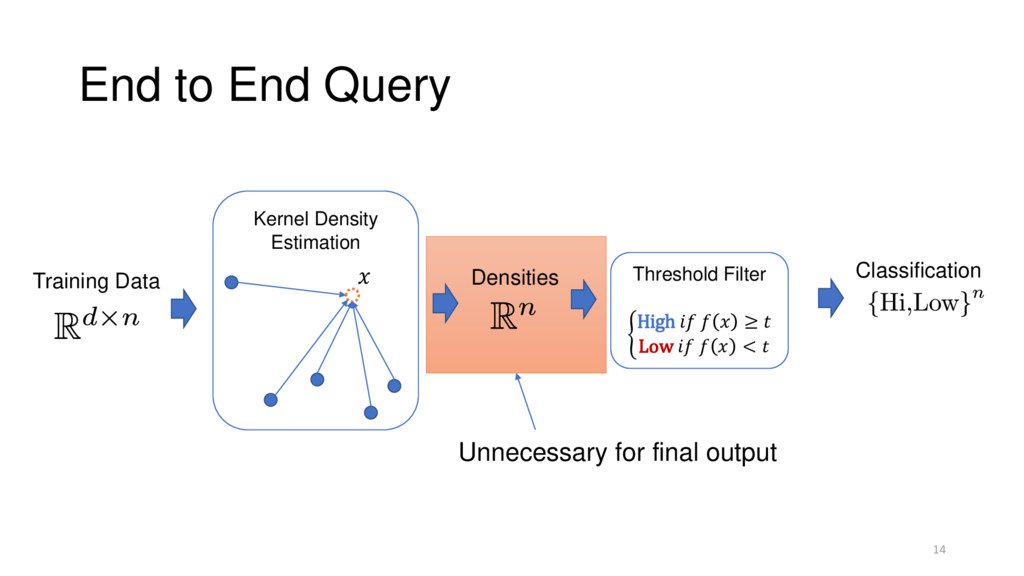
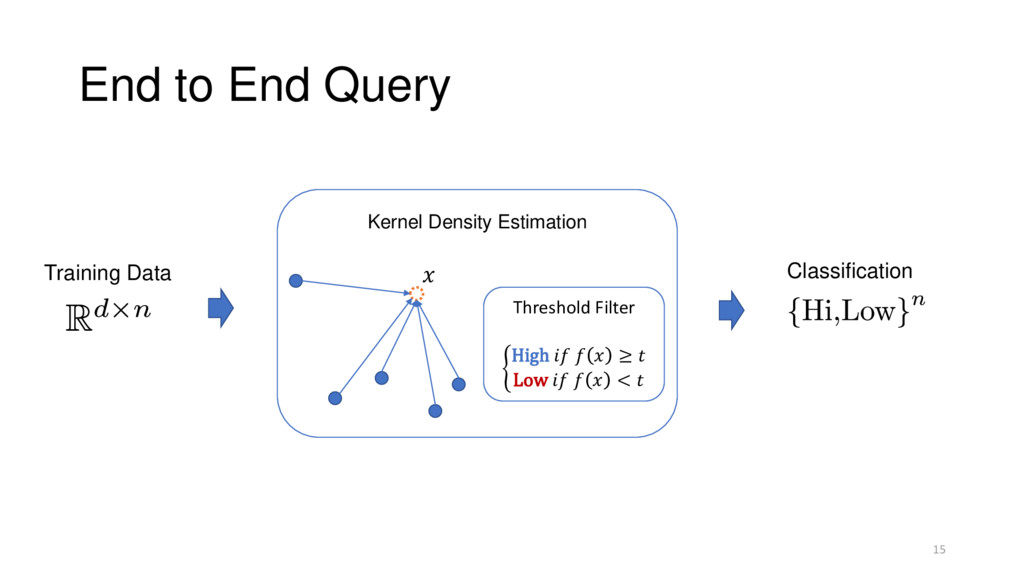
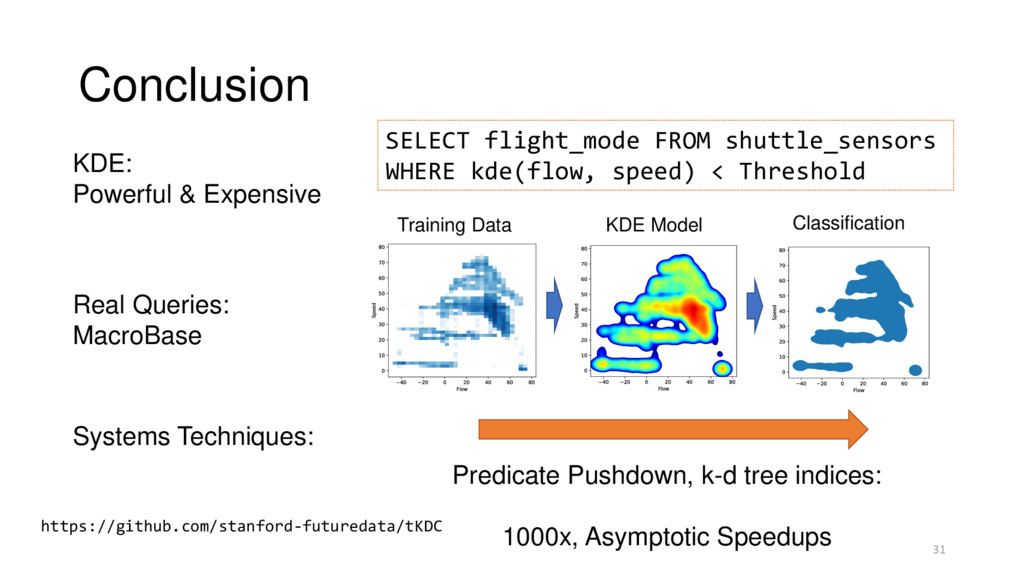
    Training Data KDE Model Classification
    SELECT flight_mode FROM shuttle_sensors
    WHERE kde(flow, speed) < Threshold
    KDE:
    Powerful & Expensive
    Real Queries:
    MacroBase
    Systems Techniques:
    https://github.com/stanford-futuredata/tKDC

    View Slide