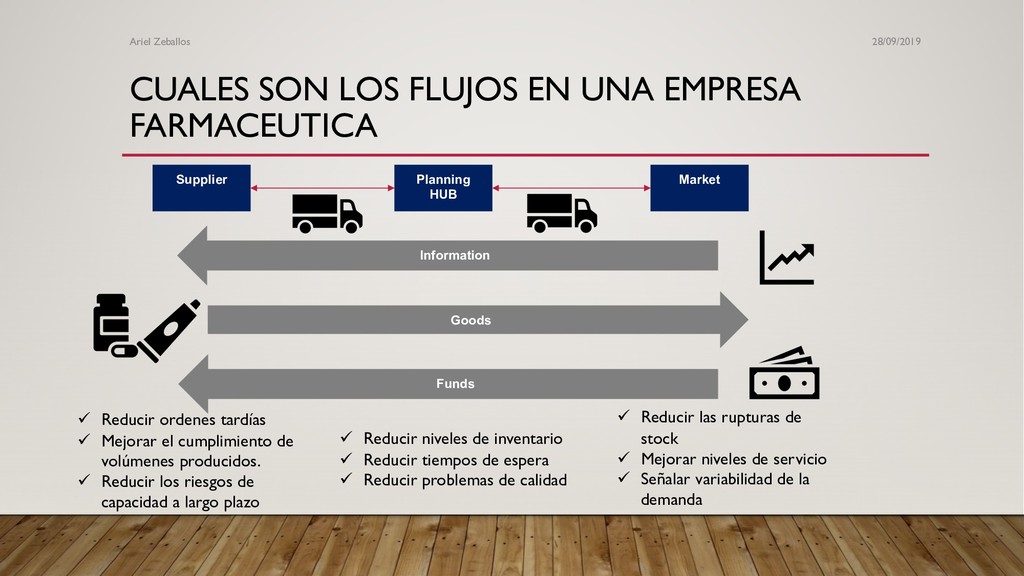
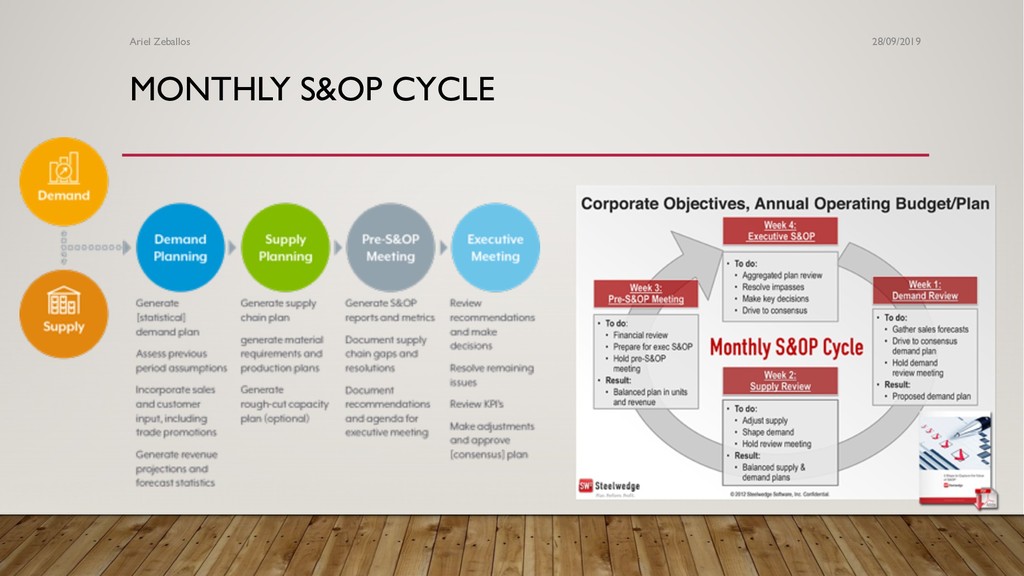
HUB Market Goods Funds Information ü Reducir niveles de inventario ü Reducir tiempos de espera ü Reducir problemas de calidad ü Reducir las rupturas de stock ü Mejorar niveles de servicio ü Señalar variabilidad de la demanda ü Reducir ordenes tardías ü Mejorar el cumplimiento de volúmenes producidos. ü Reducir los riesgos de capacidad a largo plazo 28/09/2019 Ariel Zeballos
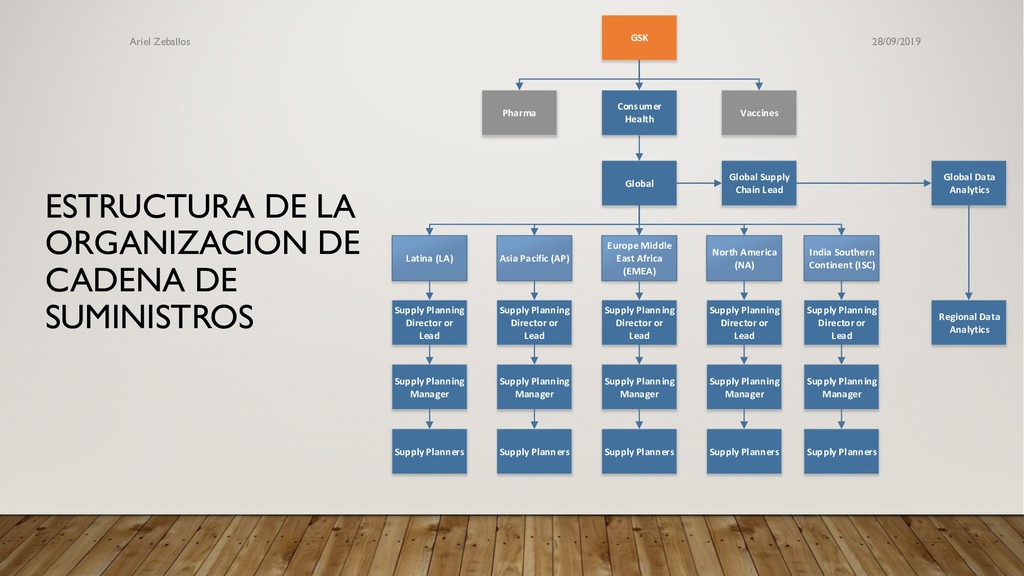
GSK Vaccines Europe Middle East Africa (EMEA) Asia Pacific (AP) Latina (LA) North America (NA) India Southern Continent (ISC) Consumer Health Supply Planning Director or Lead Supply Planning Manager Supply Planners Supply Planning Director or Lead Supply Planning Manager Supply Planners Supply Planning Director or Lead Supply Planning Manager Supply Planners Supply Planning Director or Lead Supply Planning Manager Supply Planners Supply Planning Director or Lead Supply Planning Manager Supply Planners Regional Data Analytics Global Data Analytics Global Supply Chain Lead 28/09/2019 Ariel Zeballos
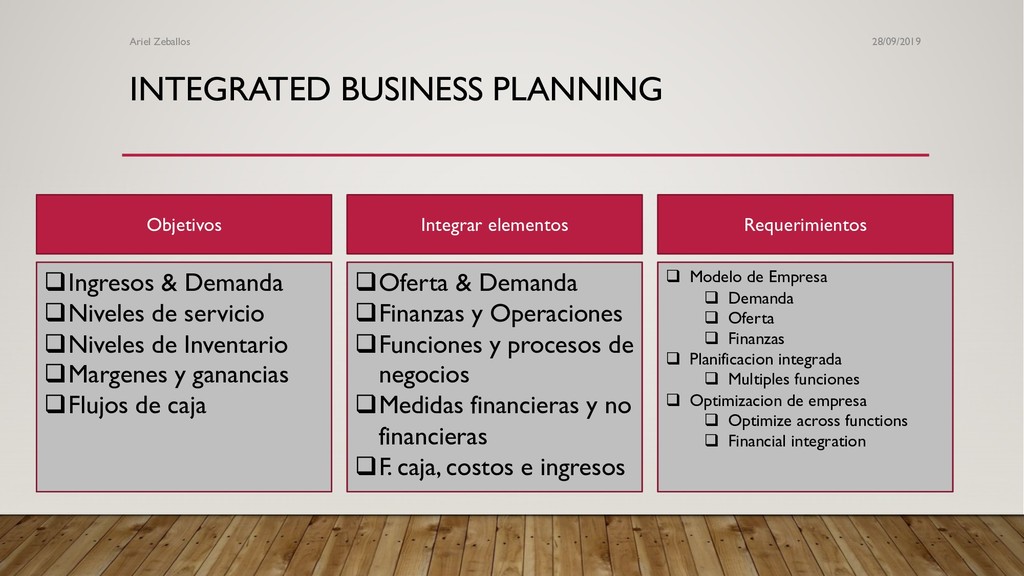
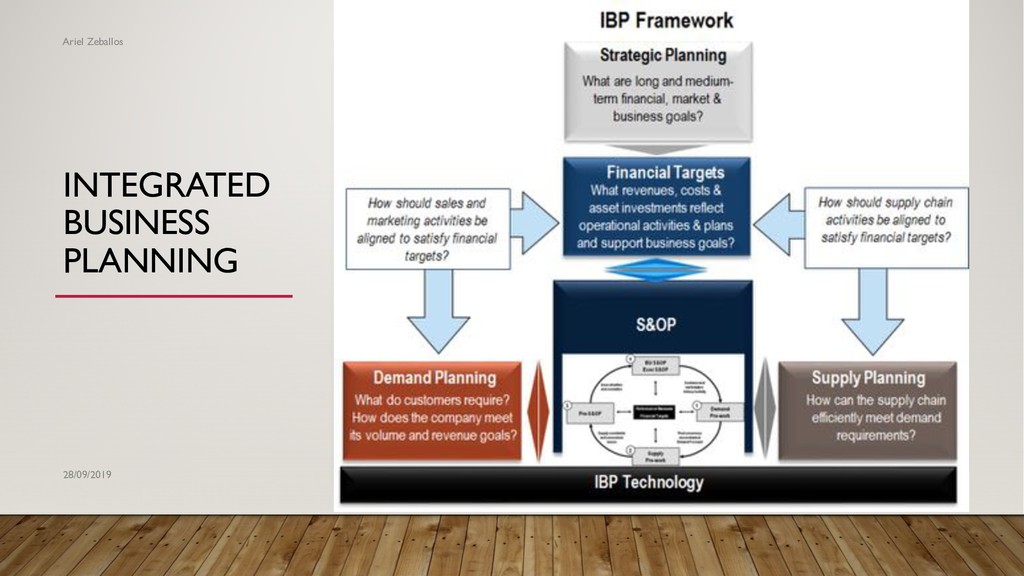
& Demanda qNiveles de servicio qNiveles de Inventario qMargenes y ganancias qFlujos de caja Requerimientos qOferta & Demanda qFinanzas y Operaciones qFunciones y procesos de negocios qMedidas financieras y no financieras qF. caja, costos e ingresos q Modelo de Empresa q Demanda q Oferta q Finanzas q Planificacion integrada q Multiples funciones q Optimizacion de empresa q Optimize across functions q Financial integration
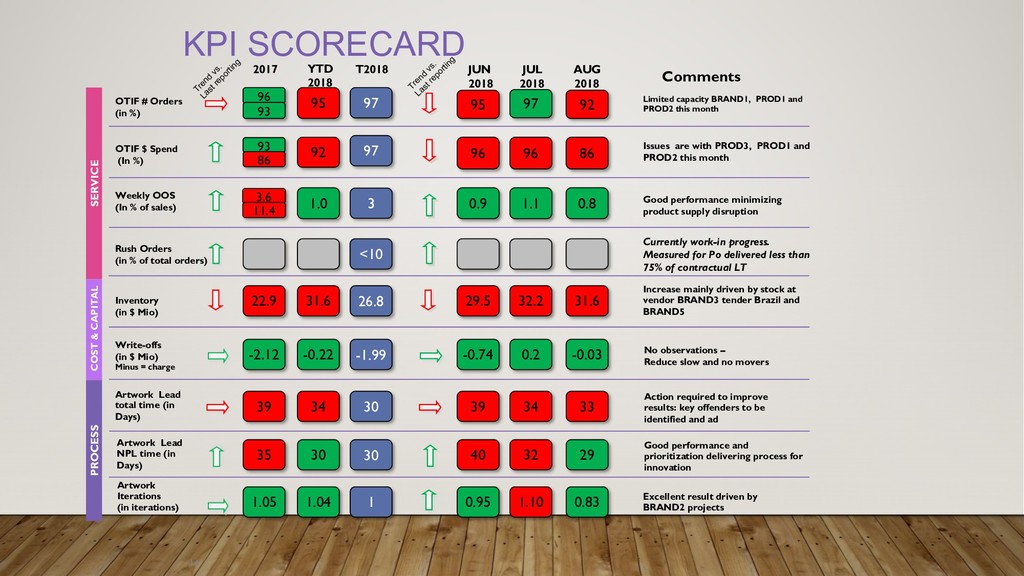
minimizing product supply disruption Increase mainly driven by stock at vendor BRAND3 tender Brazil and BRAND5 Issues are with PROD3, PROD1 and PROD2 this month No observations – Reduce slow and no movers KPI SCORECARD 14 39 39 1 0.95 1.05 29.5 22.9 SERVICE COST & CAPITAL OTIF # Orders (in %) Weekly OOS (In % of sales) Inventory (in $ Mio) Artwork Lead total time (in Days) Artwork Iterations (in iterations) 3 26.8 OTIF $ Spend (In %) n/a 30 97 34 1.04 31.6 Trend vs. Last reporting 2017 YTD 2018 T2018 JUN 2018 34 33 1.10 0.83 32.2 31.6 JUL 2018 AUG 2018 PROCESS Comments 97 -0.74 -2.12 Write-offs (in $ Mio) Minus = charge -1.99 -0.22 0.2 -0.03 95 92 86 92 0.8 1.0 Action required to improve results: key offenders to be identified and ad Trend vs. Last reporting 96 93 93 86 3.6 11.4 97 1.1 96 95 96 0.9 Rush Orders (in % of total orders) 26.8 <10 Currently work-in progress. Measured for Po delivered less than 75% of contractual LT 40 35 30 30 32 29 Good performance and prioritization delivering process for innovation Artwork Lead NPL time (in Days) Excellent result driven by BRAND2 projects
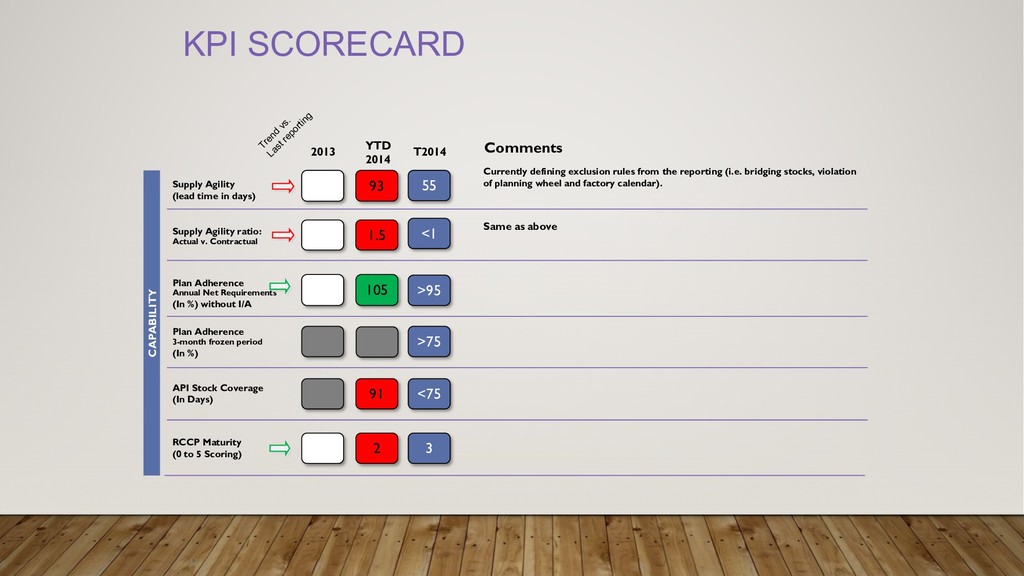
violation of planning wheel and factory calendar). Same as above KPI SCORECARD 15 >75 CAPABILITY Supply Agility (lead time in days) Plan Adherence Annual Net Requirements (In %) without I/A >95 Supply Agility ratio: Actual v. Contractual 55 Trend vs. Last reporting 2013 YTD 2014 T2014 Comments <1 93 1.5 105 Plan Adherence 3-month frozen period (In %) API Stock Coverage (In Days) <75 91 RCCP Maturity (0 to 5 Scoring) 3 2
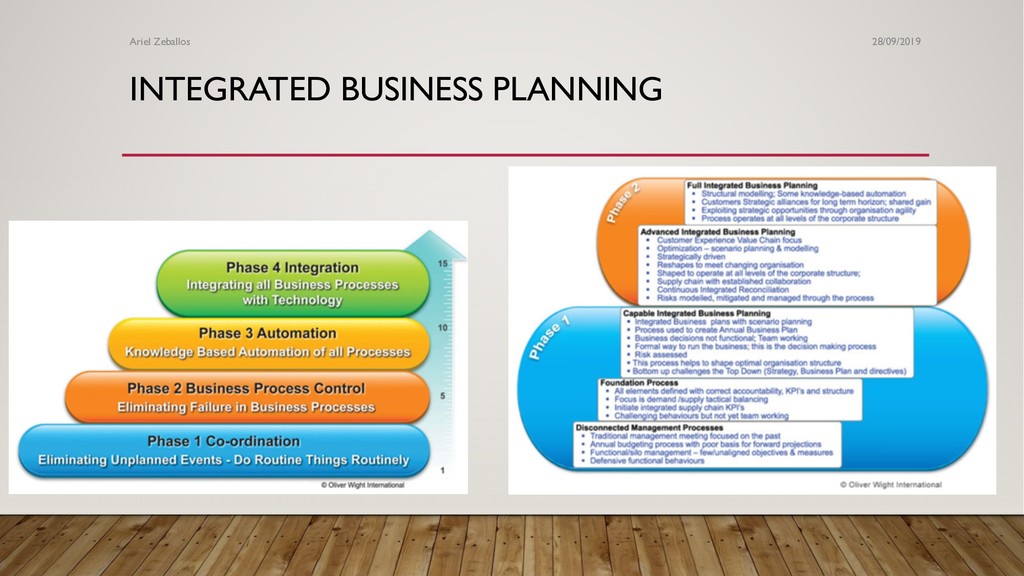
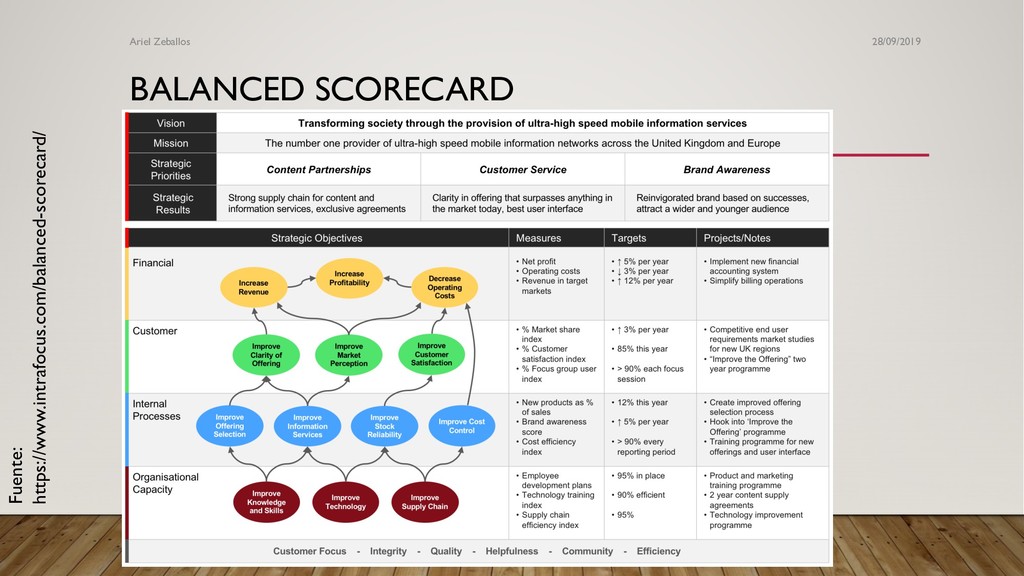
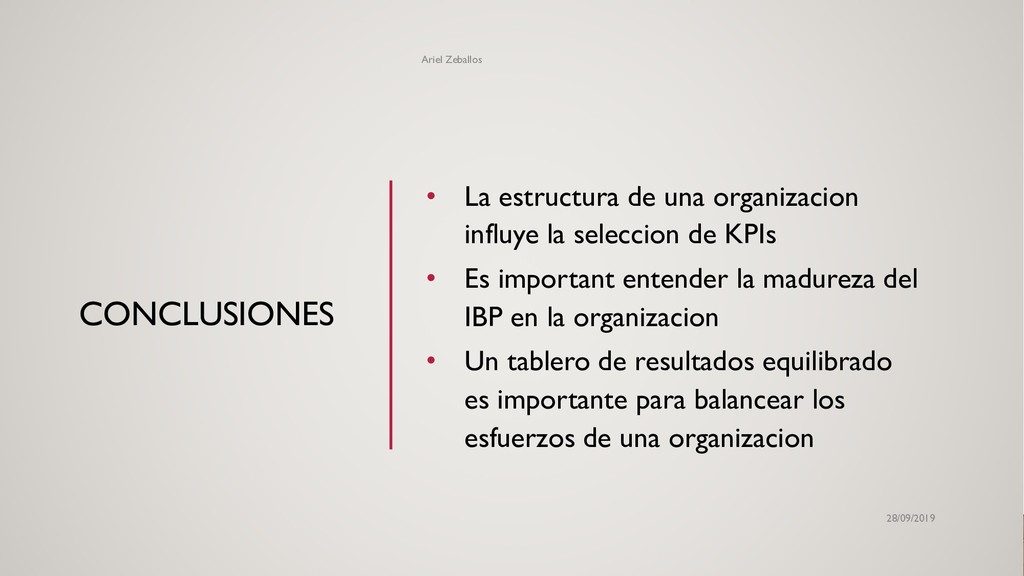
la seleccion de KPIs • Es important entender la madureza del IBP en la organizacion • Un tablero de resultados equilibrado es importante para balancear los esfuerzos de una organizacion 28/09/2019


 gdgsantacruz
 keeg
 sansantech
 ivry_presentationmaterials
 yut0naga1_fa
 4o1sobblue
 kaminashi
 teamlab
 sue445
 terapyon
 kairim0
 yuuuuuuu168
 tammyeverts
 dougneiner
 palkan
 rakko
 ivargrimstad
 uxyall
 bluesmoon
 kneath
 inesmontani
 codingconduct
 marcduiker
 jonyablonski