Upgrade to Pro — share decks privately, control downloads, hide ads and more …

Shift left with performance testing

Shift left with performance testing

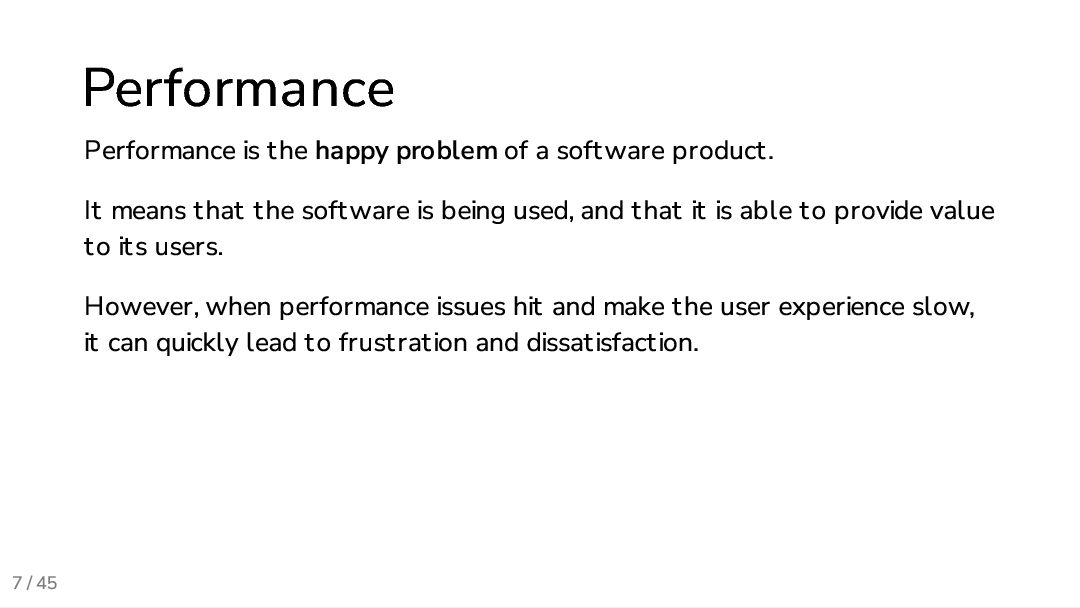
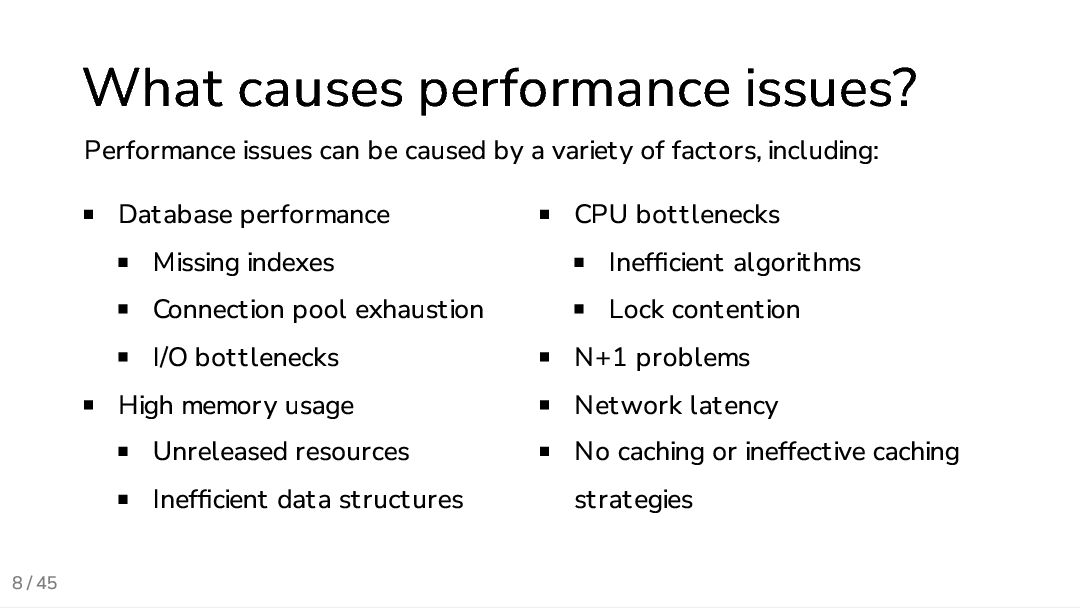
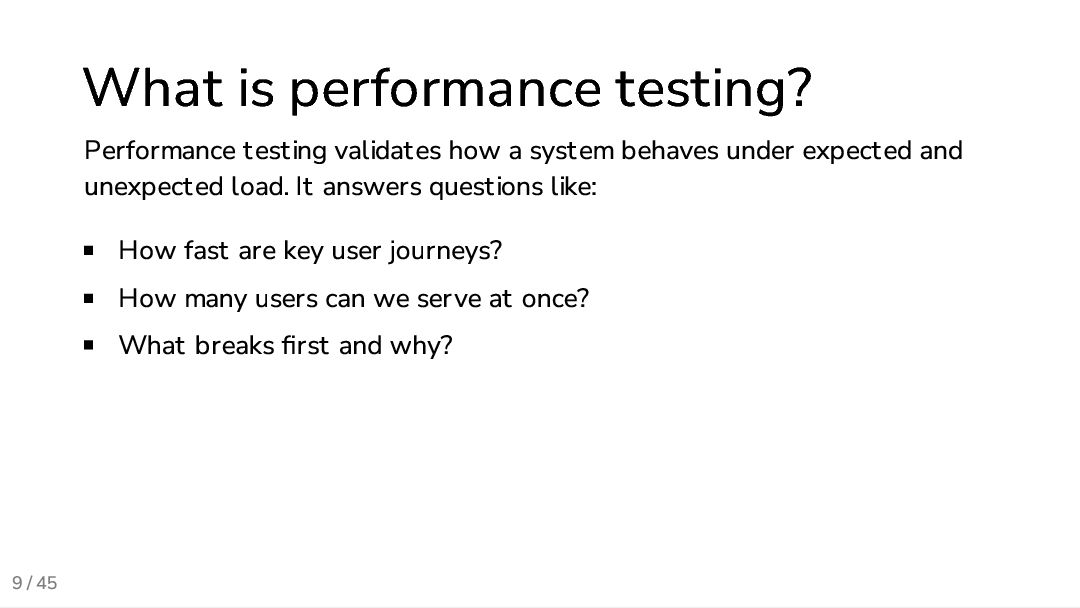
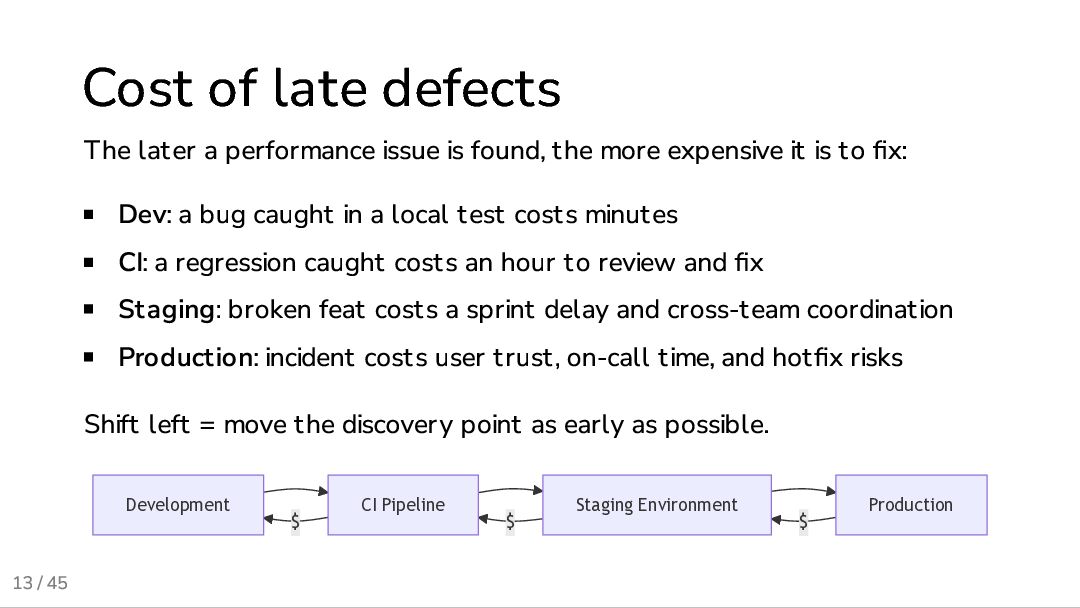
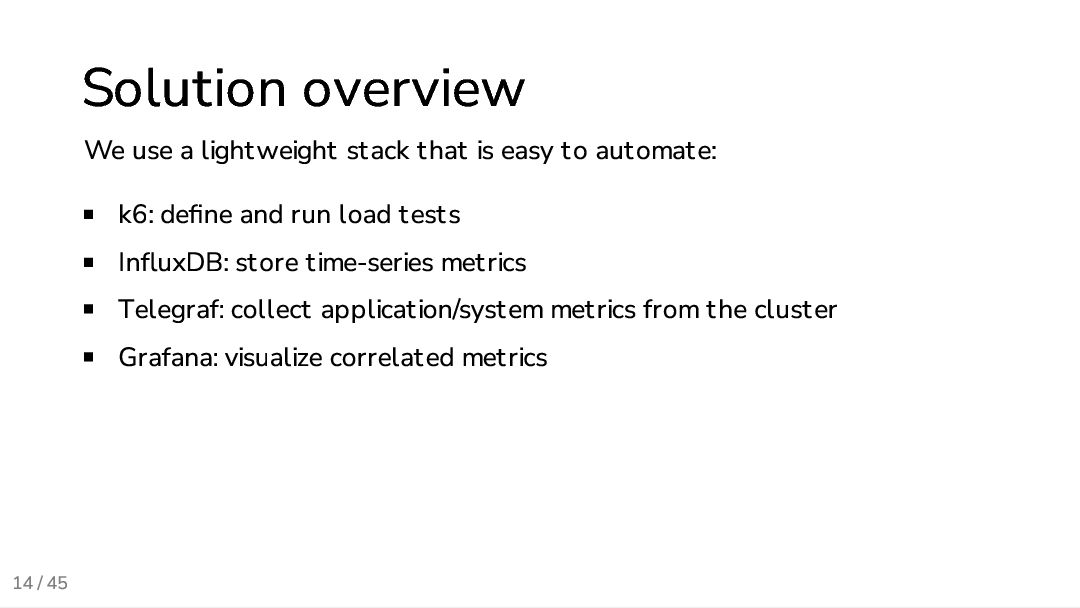
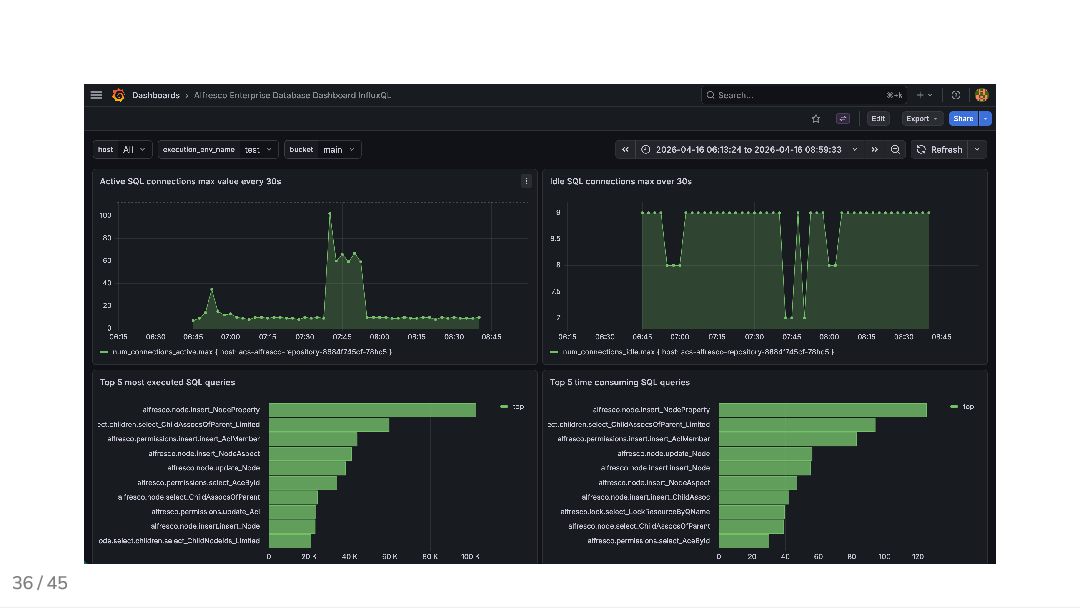
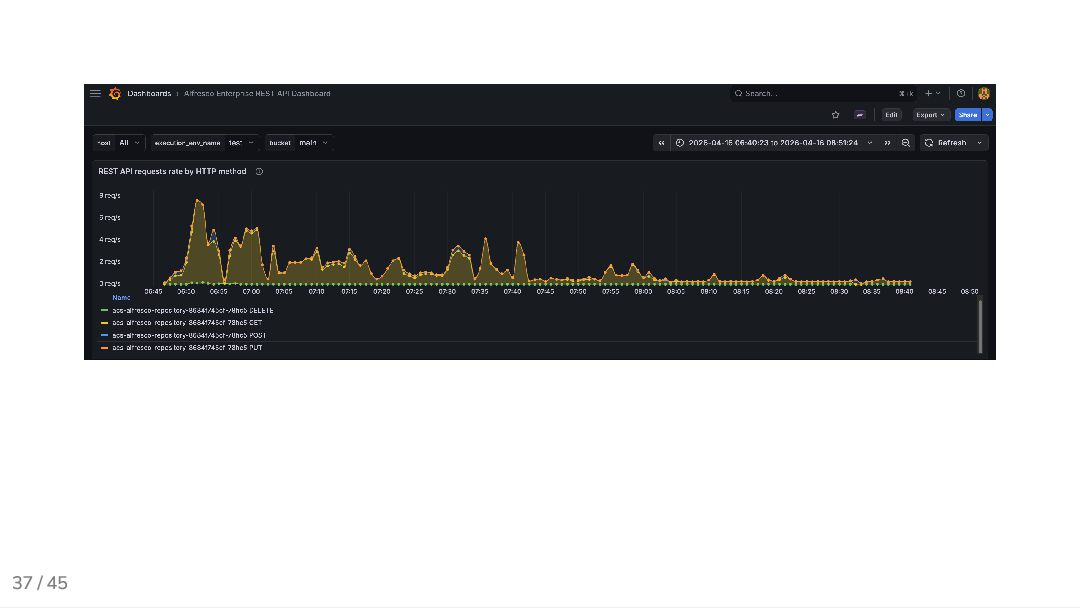
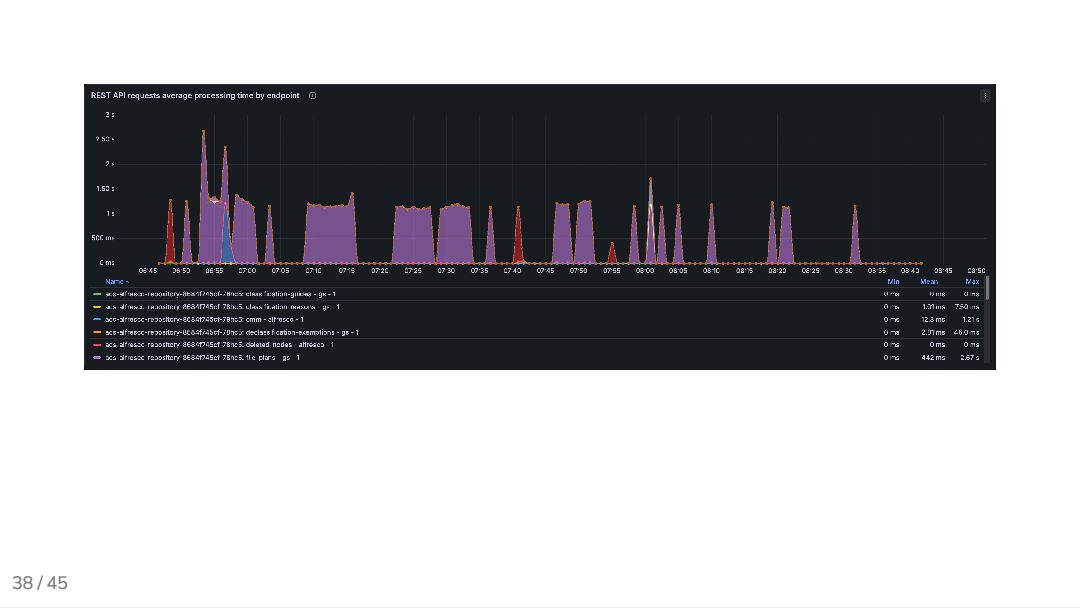
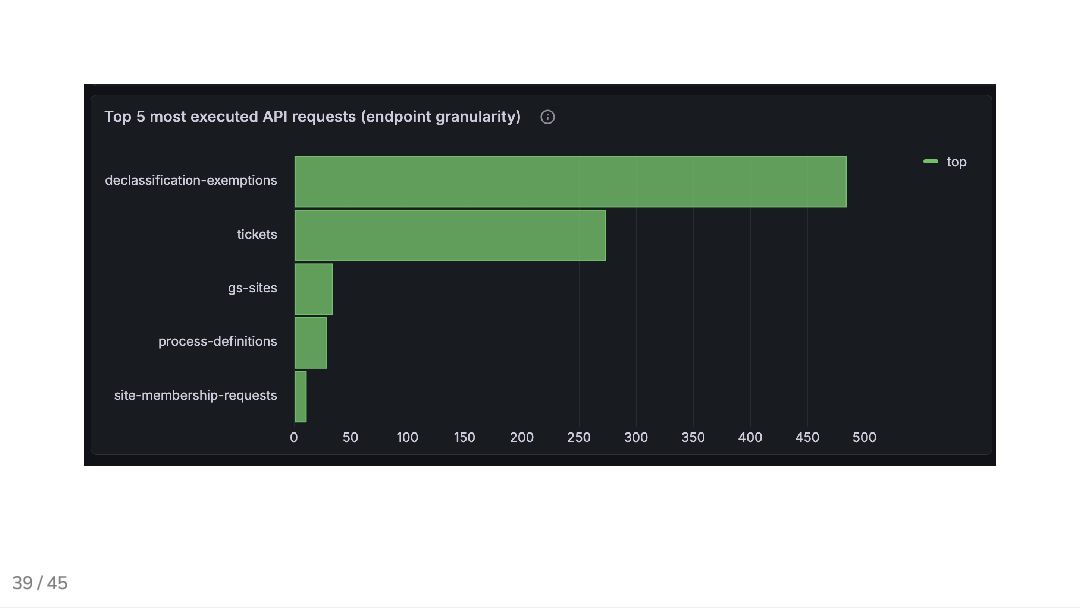
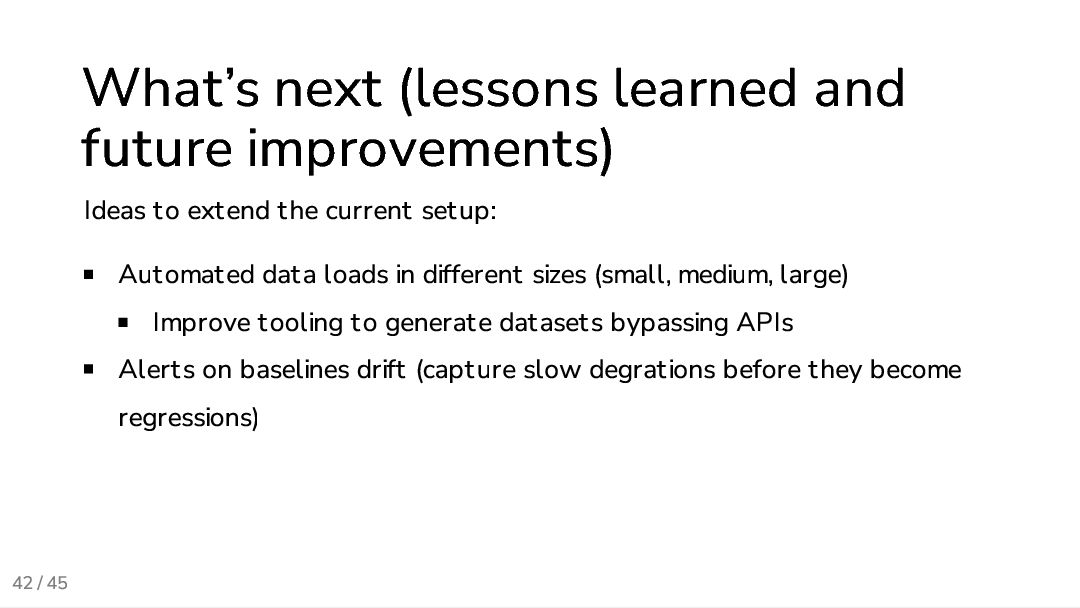
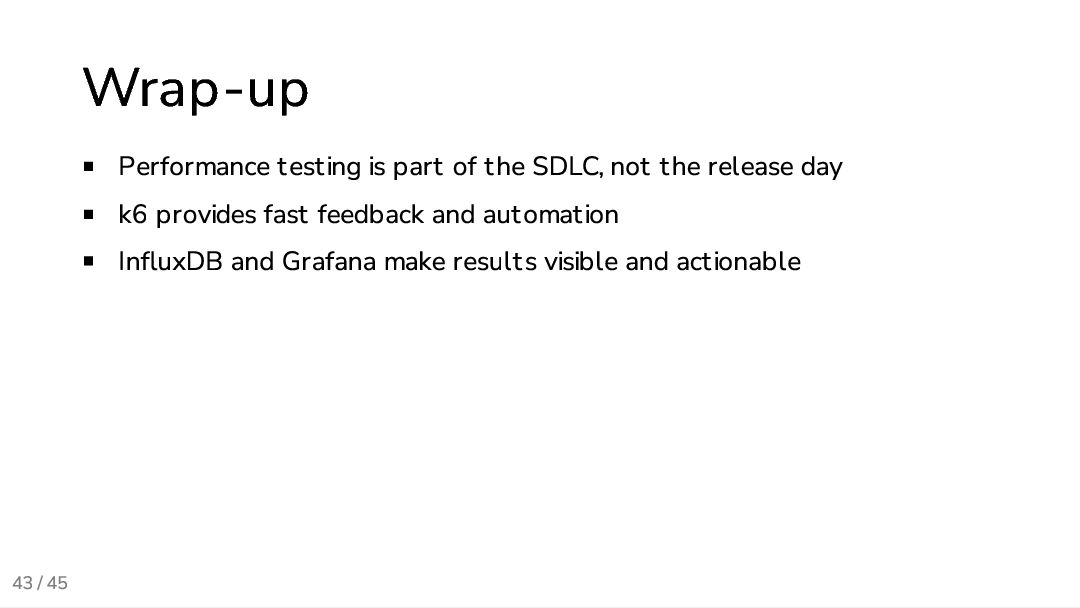
Performance issues are nobody's favorite surprises. When they hit, fixing them is tough and often costly. The smart move: shift left and catch problems early in the Software Development Life Cycle (SDLC). This session dives into how performance testing is built into the Alfresco delivery pipeline. We use k6 for reliable load tests, InfluxDB to save the flood of metrics, and Grafana for turning numbers into clear visuals every team can act on. The goal is simple: make performance testing a routine, automated part of your SDLC, and not a last-minute checkbox before every release.

Avatar for Giovanni Toraldo

Giovanni Toraldo

April 19, 2026

More Decks by Giovanni Toraldo

Other Decks in Technology

Transcript

  1. 2 / 45 About me Software developer Open Source enthusiast

    Writer and public speaker DevOps Engineer at Hyland (full remote) Sometimes I get teleported into the 14th century
  2. 3 / 45 Alfresco Open Source document, process and governance

    management suite. Alfresco is designed to help organizations efficiently manage their content and improve productivity.
  3. 4 / 45 Ops readiness team My team ensures that

    Alfresco can be deployed and operated reliably in multiple environments. We focus on: Deployment automation and infrastructure as code Kubernetes and GitOps best practices CI/CD pipelines and automation Performance testing and monitoring 🆕
  4. 5 / 45 Open source projects we maintain Containerized deployments:

    acs-deployment umbrella Helm chart for the whole stack and compose files for local development alfresco-helm-charts: component-level charts for more flexibility alfresco-dockerfiles-bakery: Docker image builder for all components Classic deployments: alfresco-ansible-deployment
  5. 6 / 45 Table of contents 1. Performance testing basics

    2. Why shift left? 3. Our solution overview 4. k6 test design and examples 5. Grafana dashboards and results
  6. 7 / 45 Performance Performance is the happy problem of

    a software product. It means that the software is being used, and that it is able to provide value to its users. However, when performance issues hit and make the user experience slow, it can quickly lead to frustration and dissatisfaction.
  7. 8 / 45 What causes performance issues? Performance issues can

    be caused by a variety of factors, including: Database performance Missing indexes Connection pool exhaustion I/O bottlenecks High memory usage Unreleased resources Inefficient data structures CPU bottlenecks Inefficient algorithms Lock contention N+1 problems Network latency No caching or ineffective caching strategies
  8. 9 / 45 What is performance testing? Performance testing validates

    how a system behaves under expected and unexpected load. It answers questions like: How fast are key user journeys? How many users can we serve at once? What breaks first and why?
  9. 10 / 45 What we measure Latency percentile (p50, p95,

    p99) of requests Throughput (requests per second) Error rates Resource usage (CPU, memory, I/O)
  10. 11 / 45 Types of performance tests Load: expected traffic

    for normal conditions Stress: push beyond limits to find the breaking point Spike: sudden bursts of traffic Soak: long duration to find leaks and degradation
  11. 12 / 45 Why shift left? Keep performance as a

    product feature, not a release gate Give developers fast, actionable feedback, not customer complaints Find issues when fixes are small and cheap to implement
  12. 13 / 45 Cost of late defects The later a

    performance issue is found, the more expensive it is to fix: Dev: a bug caught in a local test costs minutes CI: a regression caught costs an hour to review and fix Staging: broken feat costs a sprint delay and cross-team coordination Production: incident costs user trust, on-call time, and hotfix risks Shift left = move the discovery point as early as possible. $ $ $ Development CI Pipeline Staging Environment Production
  13. 14 / 45 Solution overview We use a lightweight stack

    that is easy to automate: k6: define and run load tests InfluxDB: store time-series metrics Telegraf: collect application/system metrics from the cluster Grafana: visualize correlated metrics
  14. 15 / 45 Provisioning and delivery Nightly automated process: Terraform

    pipeline provisions a Kubernetes cluster on demand FluxCD deploys Alfresco via Helm and keeps it up to date Cluster Autoscaler ready to scale nodes during load tests k6 runs as a pod inside the cluster provisions runs deploy execute Terraform Schedule Kubernetes Cluster FluxCD Alfresco Stack k6 Load Tests
  15. 16 / 45 Data flow 1. k6 executes user journeys

    against the system under test 2. Both k6 and system metrics are pushed to InfluxDB 3. Grafana dashboards show trends and regressions for each test run
  16. 17 / 45 K6 strengths Scripting in JavaScript /TypeScript with

    a familiar API Fast, headless execution Easy to integrate with CI pipelines Built-in metrics, checks and thresholds Integration with Grafana Cloud (not used in our case but worth mentioning)
  17. 18 / 45 Grafana Cloud Useful for evaluations and simpler

    use cases when you want less infrastructure to manage. Run tests from the cloud without provisioning your own executors Grafana dashboards are available out of the box free tier with 14 days of retention enough for quick evaluations The first weeks of our project were actually run on Grafana Cloud, but we needed more control and flexibility for our long-term goals.
  18. 19 / 45 k6 mental model Virtual users (VUs): independent

    actors using the system concurrently Scenarios: control request rate and ramping up Iterations: define how much work each VU does
  19. 20 / 45 k6 test script example import http from

    "k6/http" import { check, sleep } from "k6" export const options = { vus: 10, duration: "30s", } export default function () { const res = http.get(`https://${__ENV.MY_HOSTNAME}/api/health`) check(res, { "status is 200": (r) => r.status === 200, }) sleep(1) // more complex user journey with multiple requests and checks... }
  20. 21 / 45 k6 browser Use browser mode when you

    need to validate a real UI journey, not just API latency. Covers frontend behavior, redirects, and rendered states Useful for login flows, search, and other critical user journeys Complements API-level load tests when backend timings alone are not enough
  21. 22 / 45 k6 browser example code const BASE_URL =

    __ENV.ALFRESCO_BASE_URL || 'http://localhost:8080' await page.goto(`${BASE_URL}/share`) // Wait for the login page to load await page.waitForSelector('form#kc-form-login', { timeout: 5000 }) // Enter login credentials await page.locator('input[name="username"]').type('admin') await page.locator('input[name="password"]').type('secret') await page.locator('input[type="submit"]').click() // Wait for the share page to load the Quicksearch box await page.waitForURL(`${BASE_URL}/share/dashboard`, { timeout: 30000 })
  22. 23 / 45 Scenarios and ramping export const options =

    { scenarios: { steady: { executor: "ramping-vus", startVUs: 0, stages: [ { duration: "30s", target: 10 }, { duration: "2m", target: 20 }, { duration: "30s", target: 40 }, ], gracefulRampDown: "30s", }, }, }
  23. 24 / 45 Thresholds and checks export const options =

    { thresholds: { http_req_failed: ["rate<0.01"], // less than 1% failed requests http_req_duration: ["p(95)<200"], // 95% of requests under 200ms }, }
  24. 25 / 45 User-defined tags Tag can be added at

    multiple levels: global options.tags for all metrics per-request tags for specific metrics Useful for filtering and grouping in Grafana dashboards
  25. 26 / 45 User-defined tags example export const options =

    { tags: { environment: "staging", alfresco_version: "26.1.0-A.1", }, } http.get("https://example.com/api/search", { tags: { app_feature: "indexing" }, })
  26. 27 / 45 Test design tips Start with the top

    2-3 user journeys that matter most to your users Use realistic datasets Use realistic users think time Keep environments consistent across runs
  27. 28 / 45 Common pitfalls Ignoring warm-up and cache effects

    Not correlating with system metrics (CPU, memory, etc.) Overcomplicating scripts before validating the basics Not setting thresholds and checks to catch regressions early
  28. 30 / 45 k6 end of test results Even without

    an external backend, k6 provides a summary of key metrics at the end of each test run: █ THRESHOLDS http_req_duration ✓ 'p(95)<1500' p(95)=148.21ms ✓ 'p(90)<2000' p(90)=146.88ms http_req_failed ✓ 'rate<0.01' rate=0.00% HTTP http_req_duration..................: avg=140.36ms min=119.08ms med=140.96ms max= http_req_failed....................: 0.00% 0 out of 45 http_reqs..........................: 45 6.56109/s
  29. 31 / 45 k6 output backends k6 supports multiple output

    backends beyond InfluxDB: Grafana Cloud: managed service, no infrastructure needed OpenTelemetry: send metrics to any OTLP-compatible backend CSV / JSON: simple file-based export for post-processing Many more via community extensions Choose based on your existing observability stack. InfluxDB + Grafana gives you the most control and flexibility for on-premise setups.
  30. 32 / 45 k6 output to InfluxDB v2 Additional extension

    is required for v2, see xk6-output-influxdb. K6_INFLUXDB_ORGANIZATION=<insert-here-org-name> K6_INFLUXDB_BUCKET=<insert-here-bucket-name> K6_INFLUXDB_TOKEN=<insert-here-valid-token> k6 run --out xk6-influxdb=http://localhost:8086 tests/api.js
  31. 33 / 45 CI integration Run k6 as part of

    your pipeline: - uses: grafana/setup-k6-action@v1 with: browser: true - uses: grafana/run-k6-action@v1 with: path: | ./tests/api*.js
  32. 34 / 45 Grafana dashboard Key panels we track per

    test run: Latency trends: p50 / p95 / p99 over time per endpoint Error rate: percentage of failed requests VU ramp: active virtual users vs. request rate Resource usage: CPU and memory of the system under test Dashboards are version-controlled alongside the k6 scripts.
  33. 42 / 45 What’s next (lessons learned and future improvements)

    Ideas to extend the current setup: Automated data loads in different sizes (small, medium, large) Improve tooling to generate datasets bypassing APIs Alerts on baselines drift (capture slow degrations before they become regressions)
  34. 43 / 45 Wrap-up Performance testing is part of the

    SDLC, not the release day k6 provides fast feedback and automation InfluxDB and Grafana make results visible and actionable
  35. 44 / 45 Bonus: slidev This presentation was built with

    slidev, a markdown-based presentation tool (which works great with AI agents)
  36. 45 / 45 Questions? Add me on LinkedIn: Giovanni Toraldo

    Drop me an email: me @ gionn . net Visit my blog: gionn.net Slides sources on GitHub: github.com/gionn/shift-left- perf-testing