Hickey1; Stuart W Grant2; Iain Buchan1; Ben Bridgewater1,2 1Northwest Ins.tute of BioHealth Informa.cs, Manchester University 2Department of Cardiothoracic Surgery, University Hospital of South Manchester
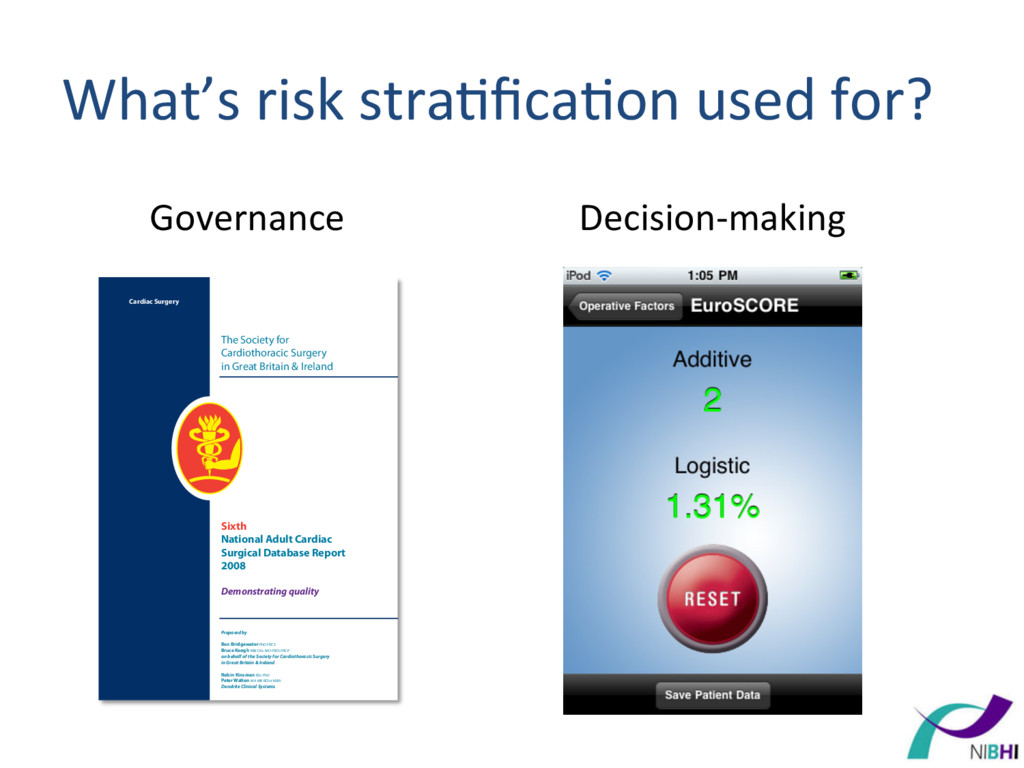
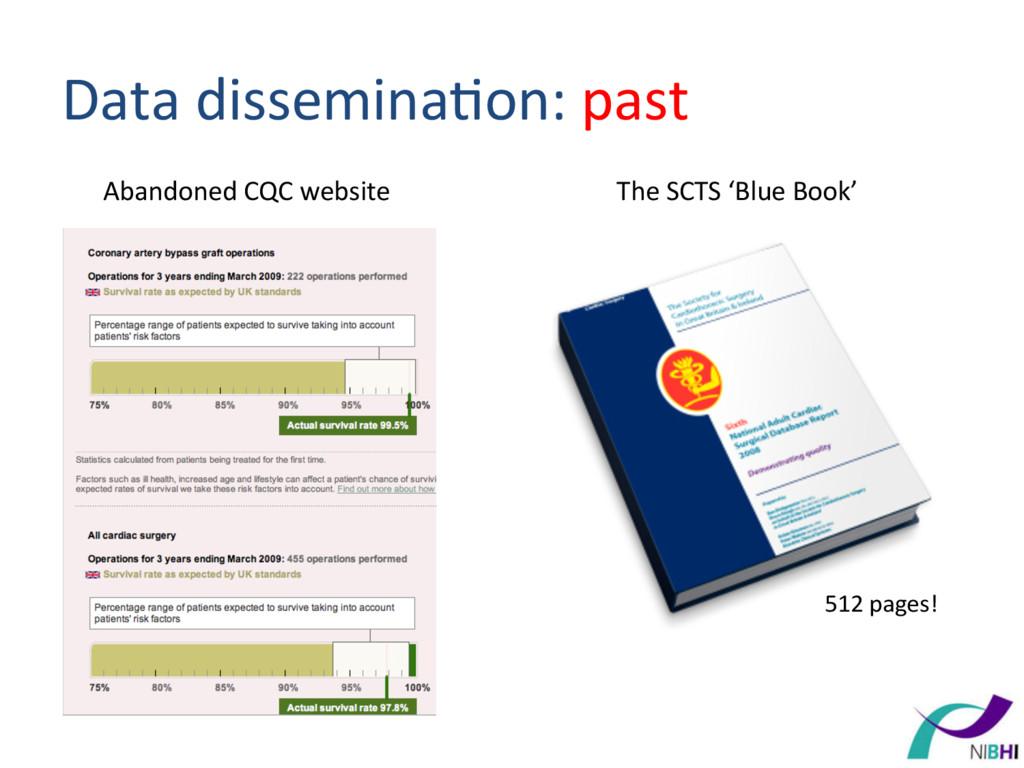
Surgery in Great Britain & Ireland Sixth National Adult Cardiac Surgical Database Report 2008 Demonstrating quality Prepared by Ben Bridgewater PhD FRCS Bruce Keogh KBE DSc MD FRCS FRCP on behalf of the Society for Cardiothoracic Surgery in Great Britain & Ireland Robin Kinsman BSc PhD Peter Walton MA MB BChir MBA Dendrite Clinical Systems Cardiac Surgery Governance Decision-‐making
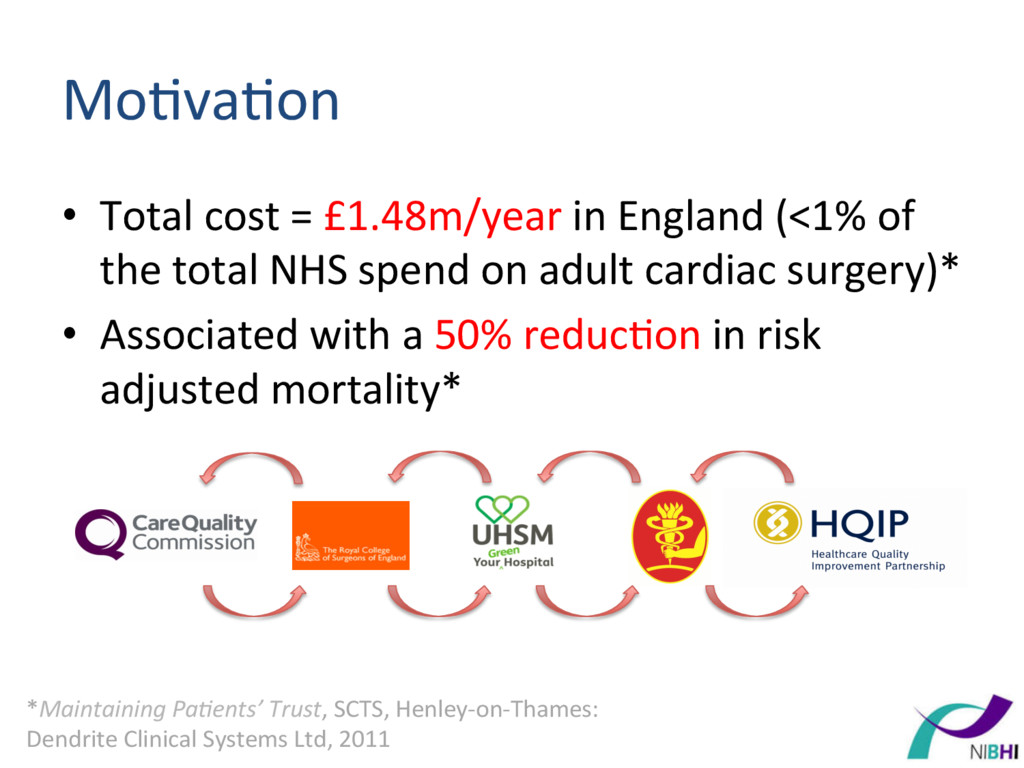
of the total NHS spend on adult cardiac surgery)* • Associated with a 50% reduc)on in risk adjusted mortality* *Maintaining Pa.ents’ Trust, SCTS, Henley-‐on-‐Thames: Dendrite Clinical Systems Ltd, 2011
periodically to central database Aim: 3 months Reality: 1 year Sta)s)cian + clinicians The Society for Cardiothoracic Surgery in Great Britain & Ireland Sixth National Adult Cardiac Surgical Database Report 2008 Demonstrating quality Prepared by Ben Bridgewater PhD FRCS Bruce Keogh KBE DSc MD FRCS FRCP on behalf of the Society for Cardiothoracic Surgery in Great Britain & Ireland Robin Kinsman BSc PhD Peter Walton MA MB BChir MBA Dendrite Clinical Systems Cardiac Surgery CQC website Na)onal audit Aim: <1 year Reality: 3 years
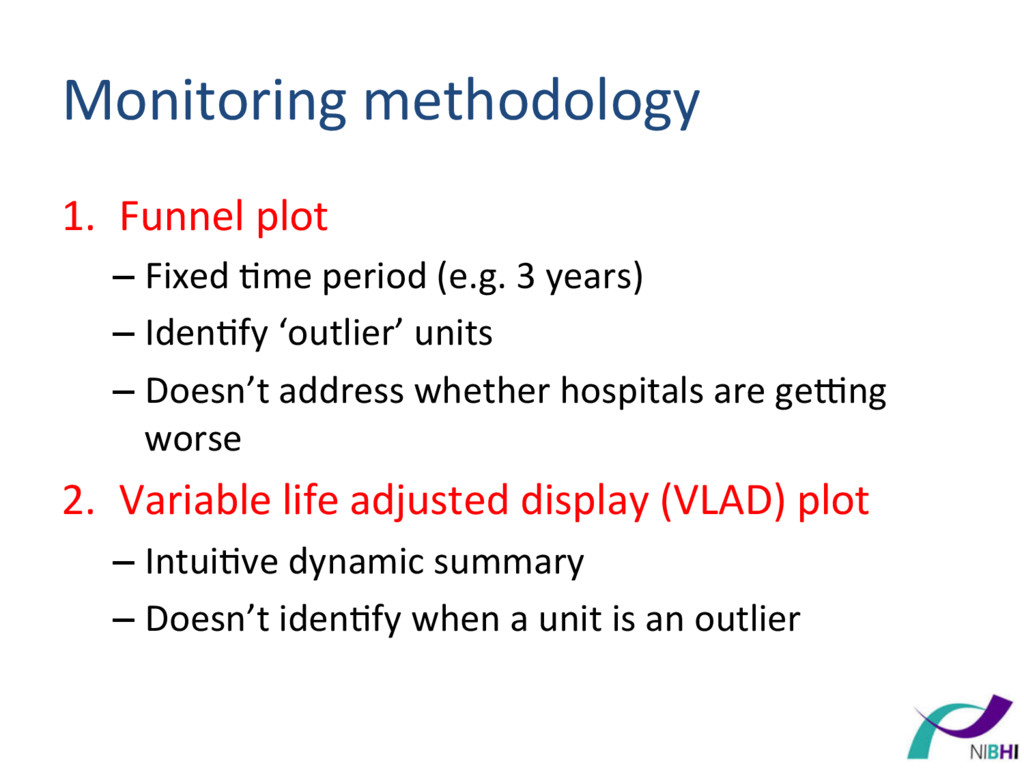
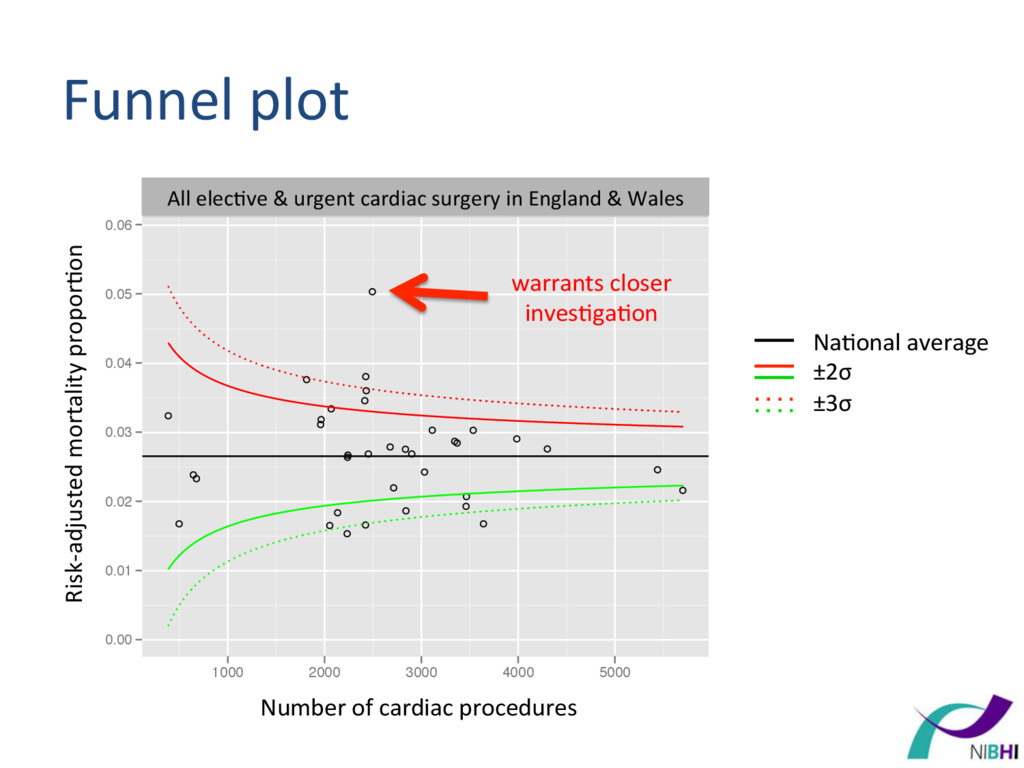
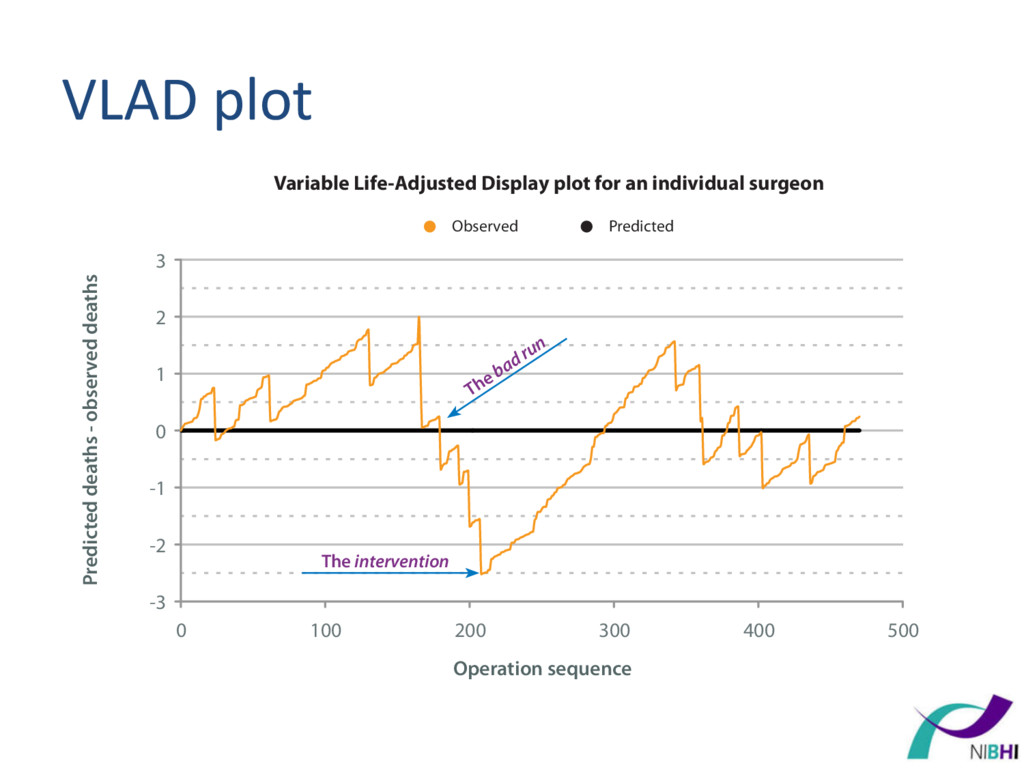
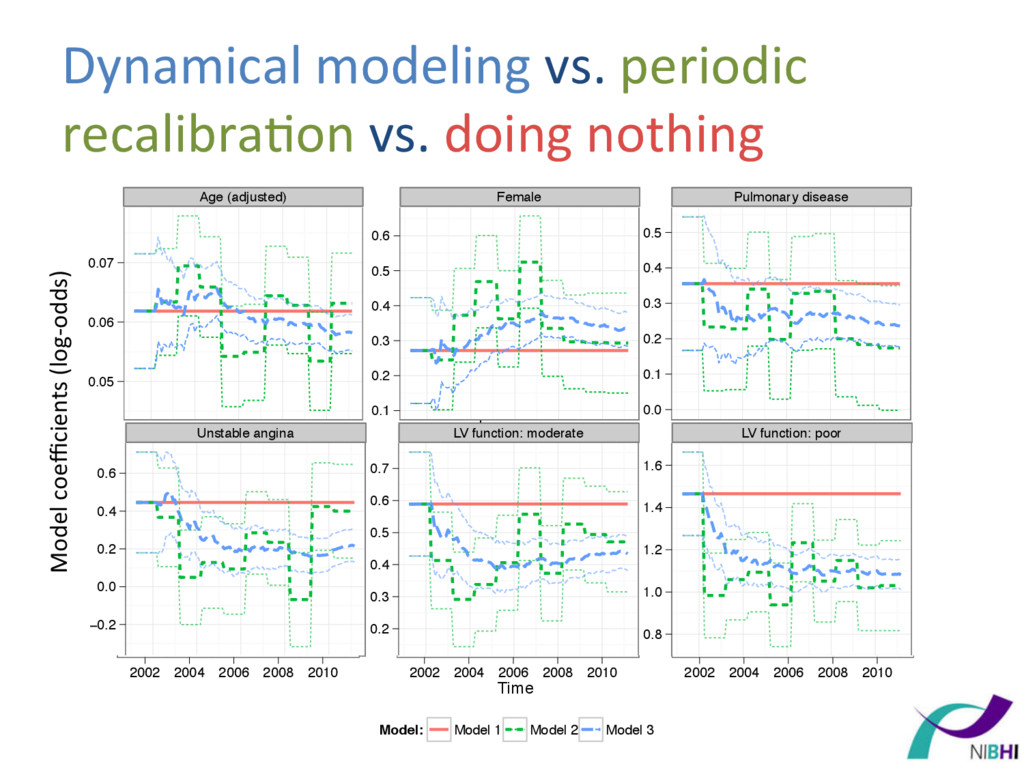
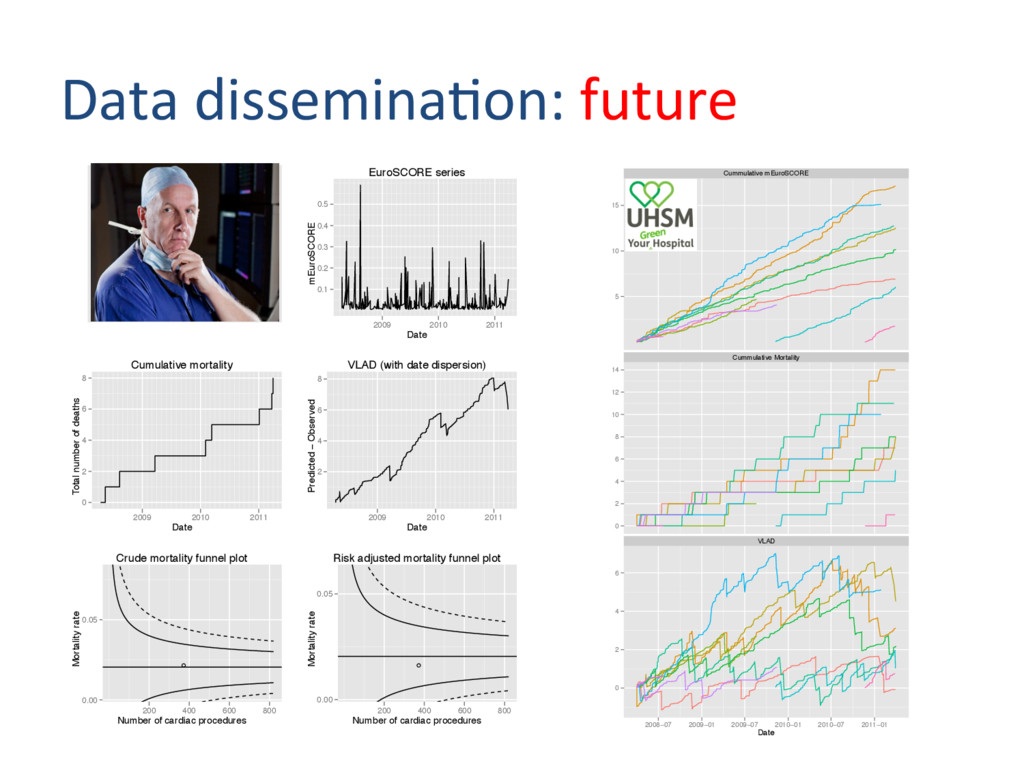
(e.g. 3 years) – Iden)fy ‘outlier’ units – Doesn’t address whether hospitals are gegng worse 2. Variable life adjusted display (VLAD) plot – Intui)ve dynamic summary – Doesn’t iden)fy when a unit is an outlier
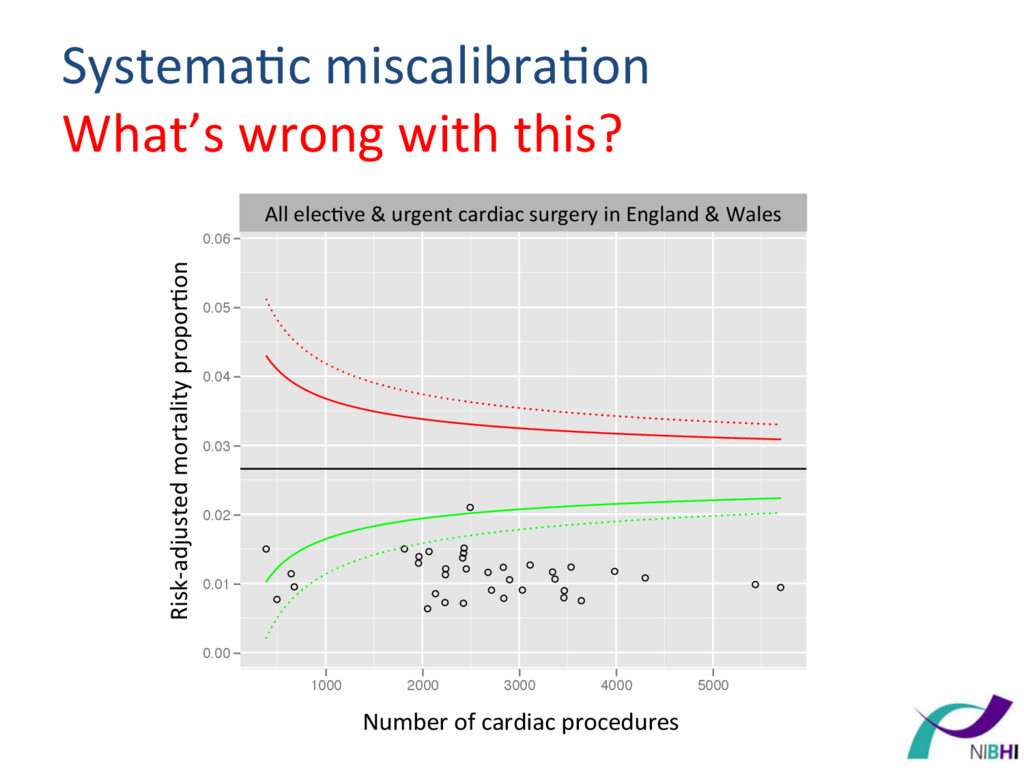
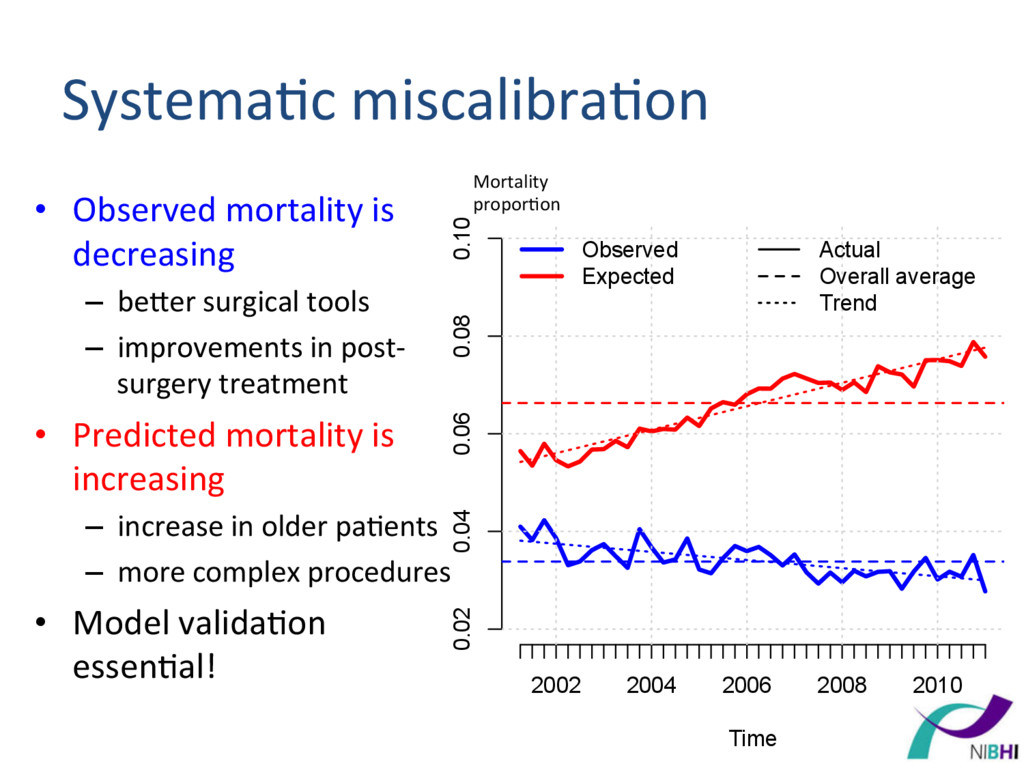
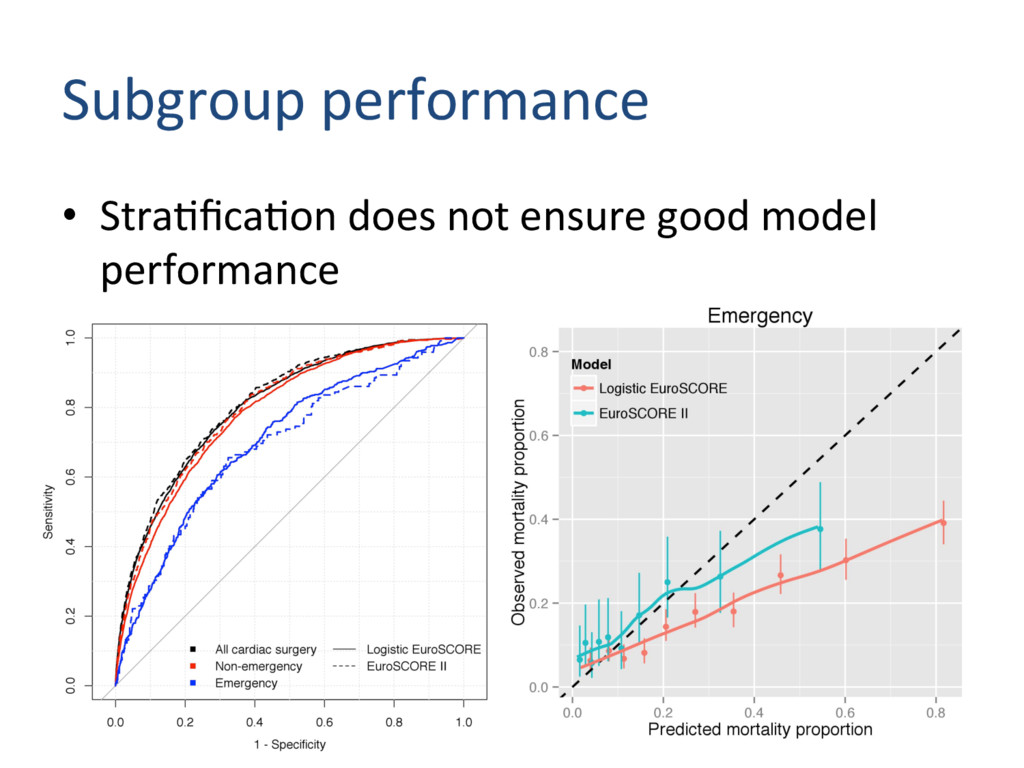
Time Mortality proportion Observed Expected Actual Overall average Trend • Observed mortality is decreasing – beqer surgical tools – improvements in post-‐ surgery treatment • Predicted mortality is increasing – increase in older pa)ents – more complex procedures • Model valida)on essen)al! Systema)c miscalibra)on Mortality propor)on
Tricuspid repair = AVR? • Cardiac surgery is a ‘catch-‐all’ term • We could have risk predic)on models for: 1. all procedures (combina)ons) 2. all procedures with mul)ple procedure variables 3. each procedure group (e.g. CABG, Valve, CABG + Valve, …) • Decision depends on applica)on.
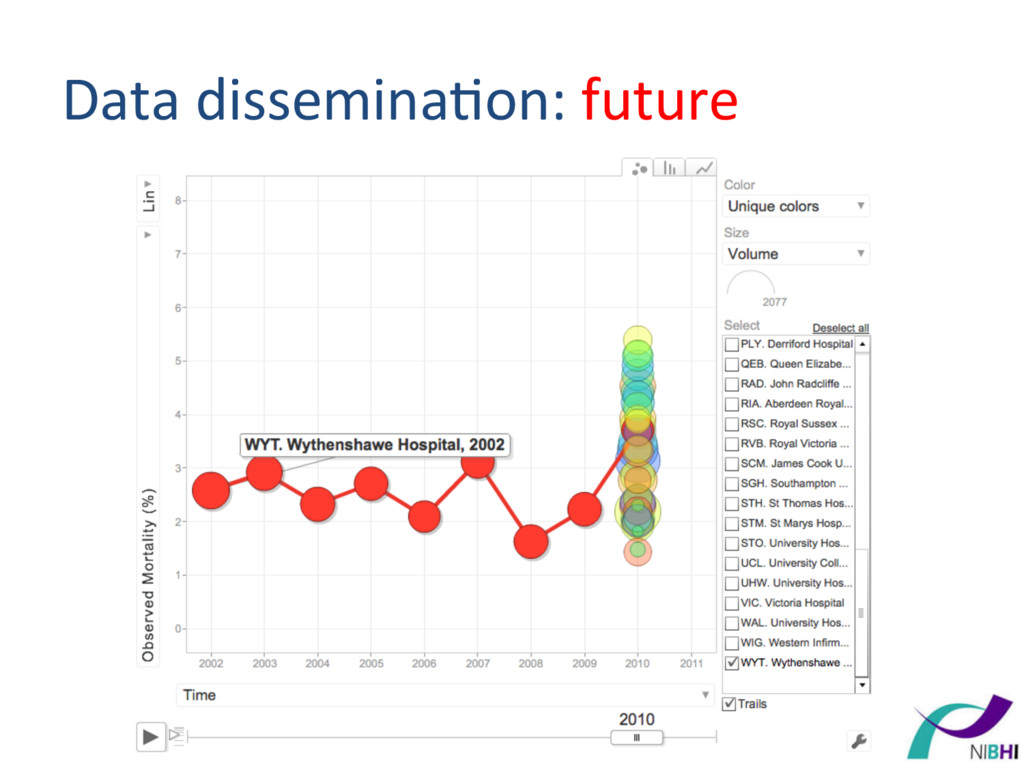
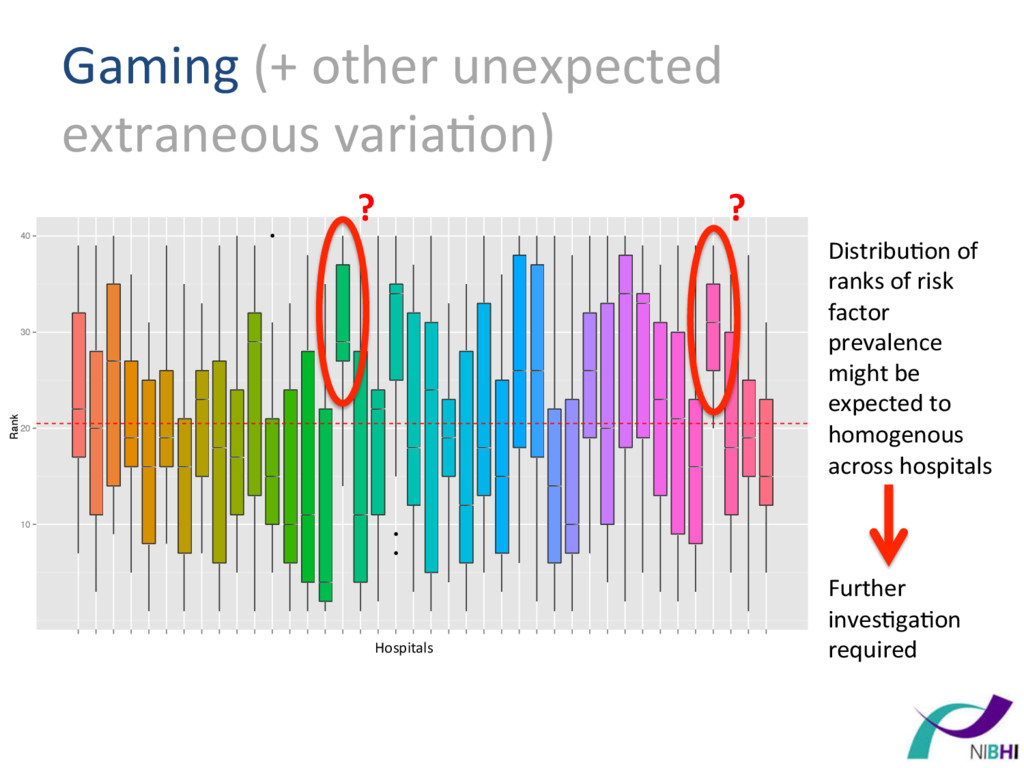
20 30 40 • • • Hospital BAL. Barts and The London BAS. Basildon Hospital BHL. Liverpool Heart and Chest Hospital BRI. Bristol Royal Infirmary CHH. Castle Hill Hospital CHN. Nottingham City Hospital ERI. Royal Infirmary of Edinburgh FRE. Freeman Hospital GEO. St George's Hospital GJH. Golden Jubilee Hospital GRL. Glenfield Hospital HAM. Hammersmith Hospital HH. Harefield Hospital HHW. Wellington Hospital North HSC. Harley Street Clinic KCH. King's College Hospital LBH. London Bridge Hospital LGI. Leeds General Infirmary MOR. Morriston Hospital MRI. Manchester Royal Infirmary NCR. New Cross Hospital NGS. Northern General Hospital NHB. Royal Brompton Hospital PAP. Papworth Hospital PLY. Derriford Hospital QEB. Queen Elizabeth Hospital RAD. John Radcliffe Hospital RIA. Aberdeen Royal Infirmary RSC. Royal Sussex County Hospital RVB. Royal Victoria Hospital SCM. James Cook University Hospital SGH. Southampton General Hospital STH. St Thomas Hospital STM. St Marys Hospital Paddington STO. University Hospital of North Staffordshire UCL. University College Hospital UHW. University Hospital of Wales VIC. Victoria Hospital WAL. University Hospital Coventry WYT. Wythenshawe Hospital Hospitals Distribu)on of ranks of risk factor prevalence might be expected to homogenous across hospitals Further inves)ga)on required ? ?