Upgrade to Pro — share decks privately, control downloads, hide ads and more …

A bibliometric study of the literature of Open Science & Open Access

A bibliometric study of the literature of Open Science & Open Access

# important note: corrected version, August 2019 #

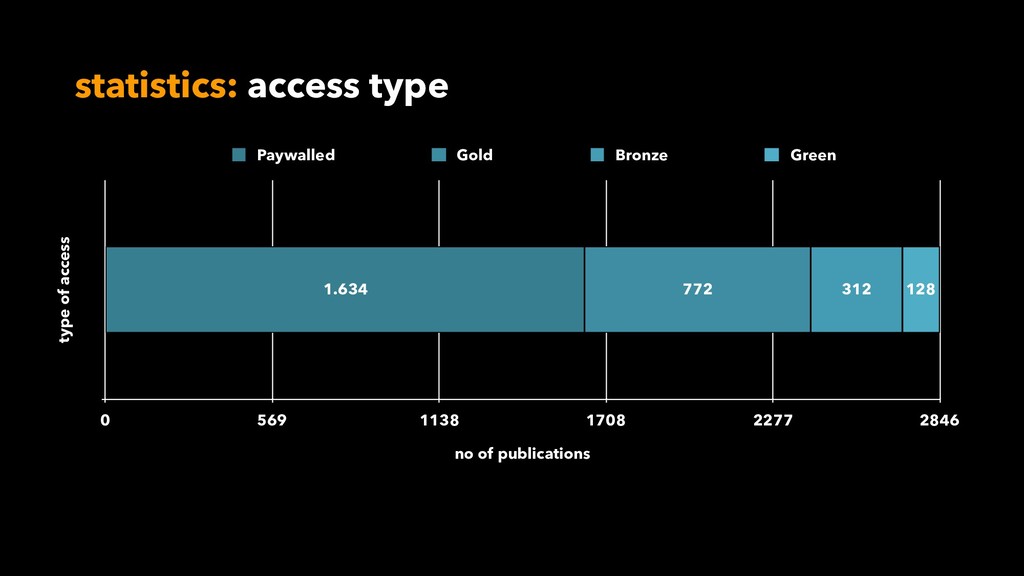
One of the necessary cultural changes on the way to Open Science is the commitment to its principles. Both the LIBER and LERU Roadmaps underline the importance of adopting consistent and robust practices that exemplify the benefits of Open Science. However, in the past several contradictions have been recorded, like for instance that many readers have encountered access fees on articles that discuss Open Access issues, as those were published in paywalled journals. It is important that every part of the discourse for Open Science to remain open and accessible to anyone who wishes to contribute. Therefore, gradually and steadily, a question is raised: what are the attributes of the literature about Open Access and Open Science?

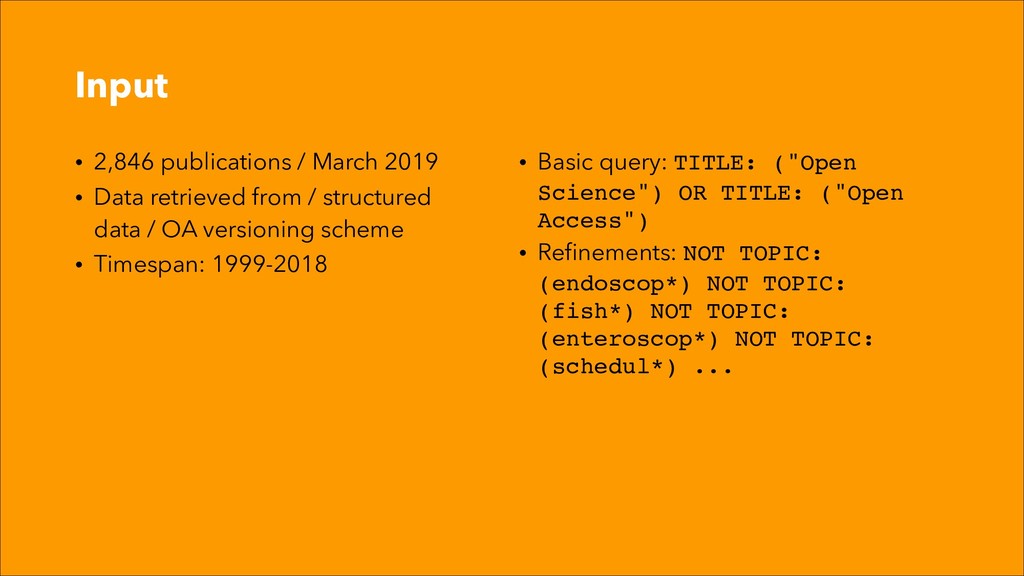
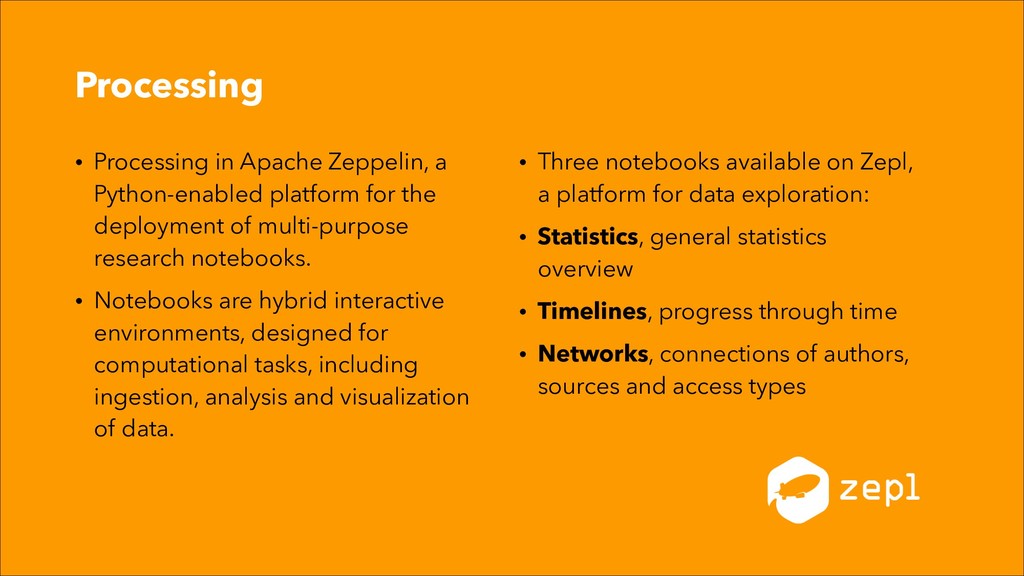
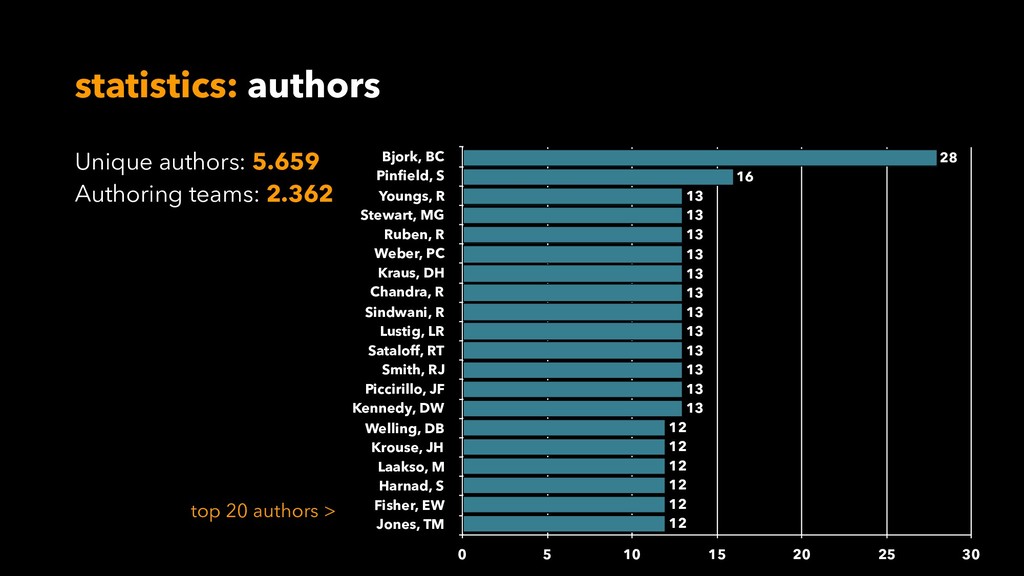
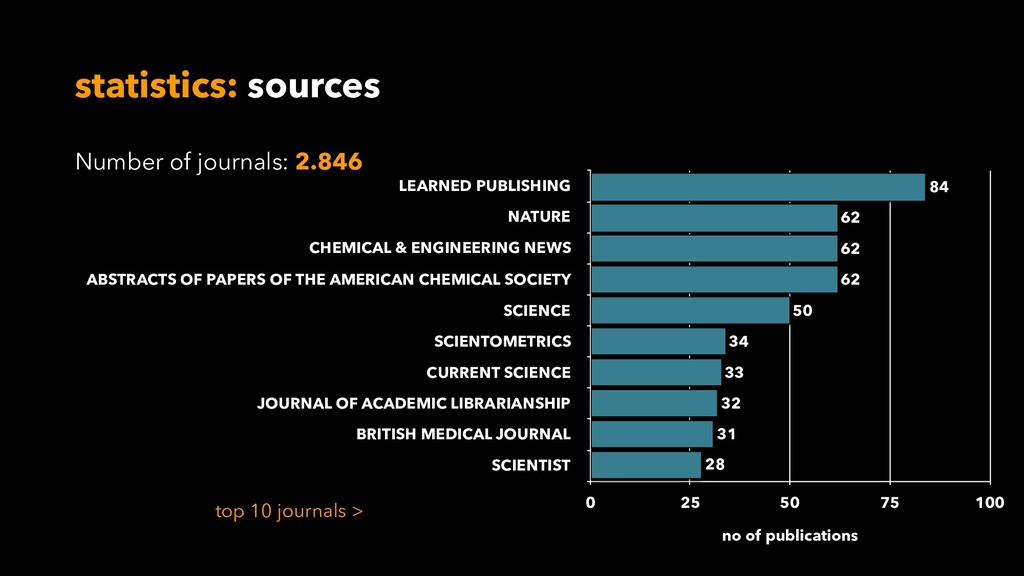
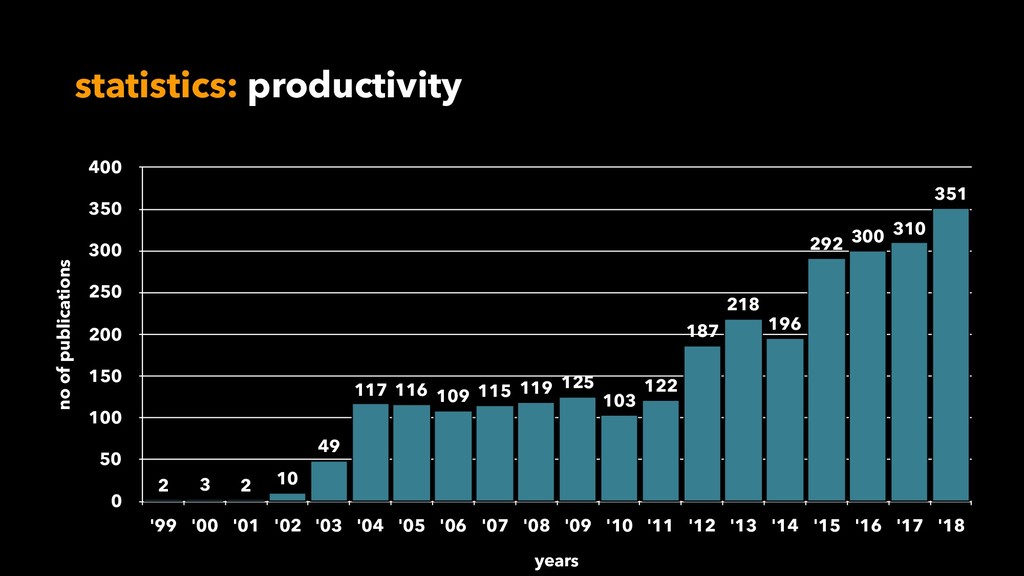
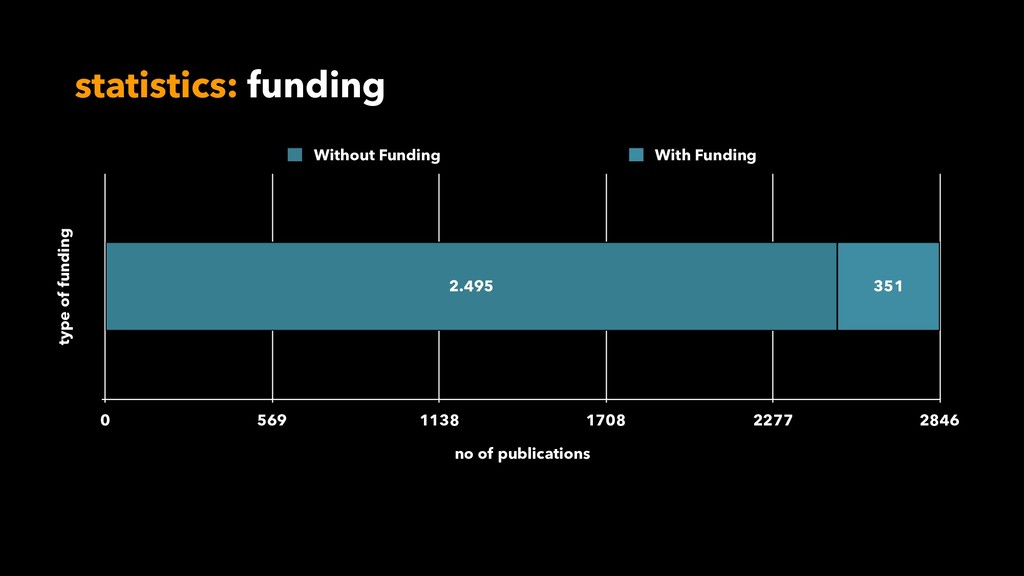
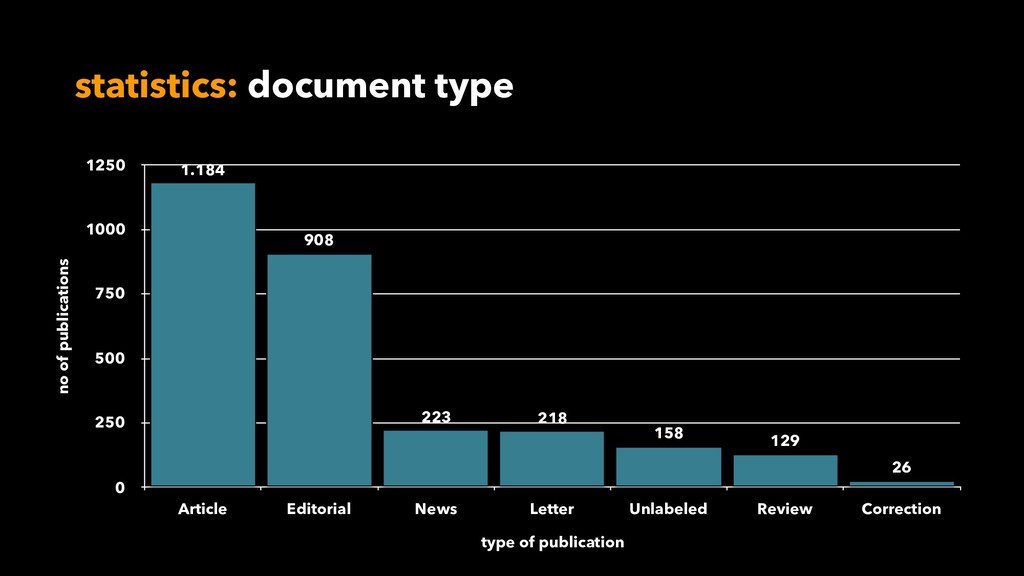
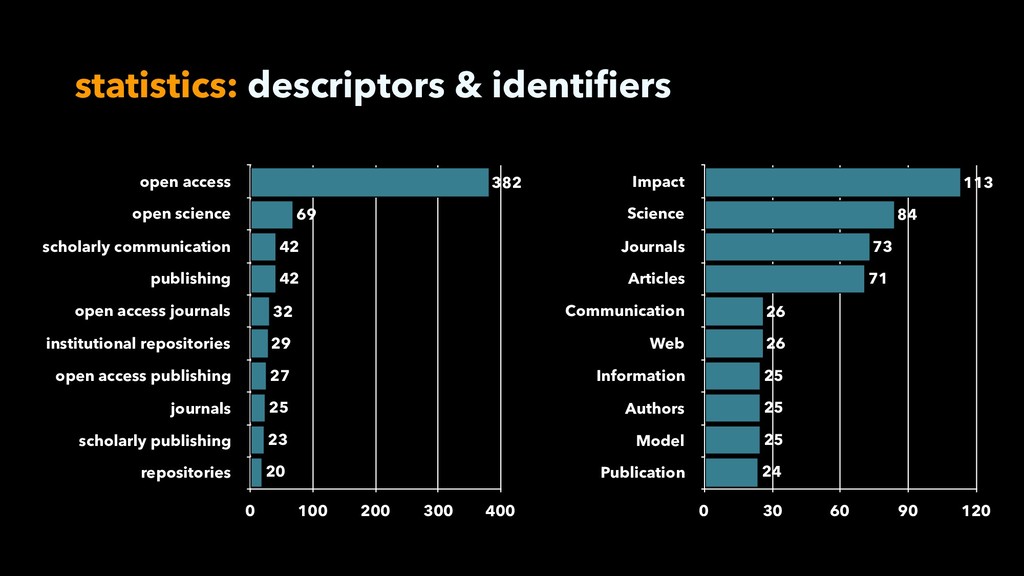
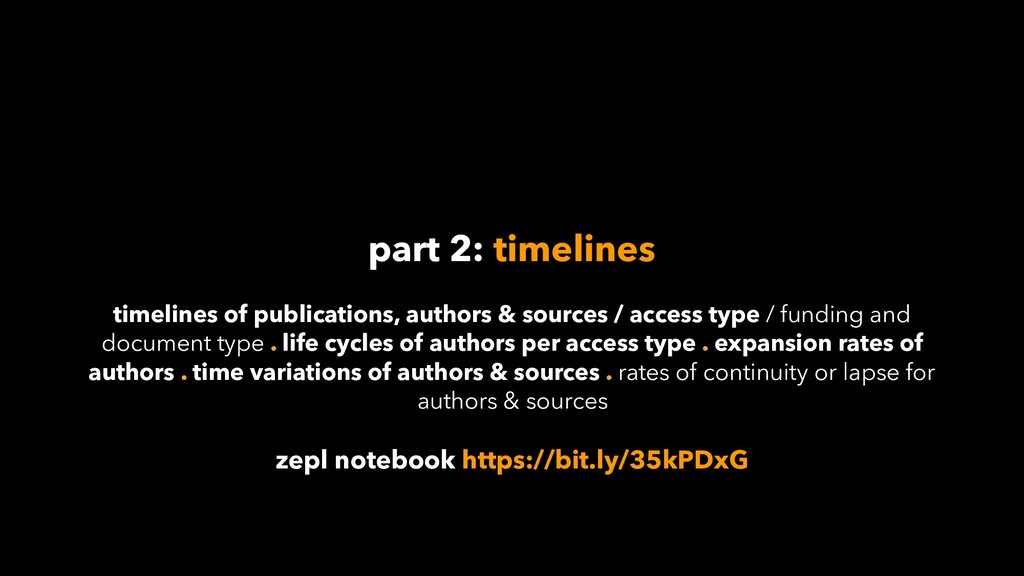
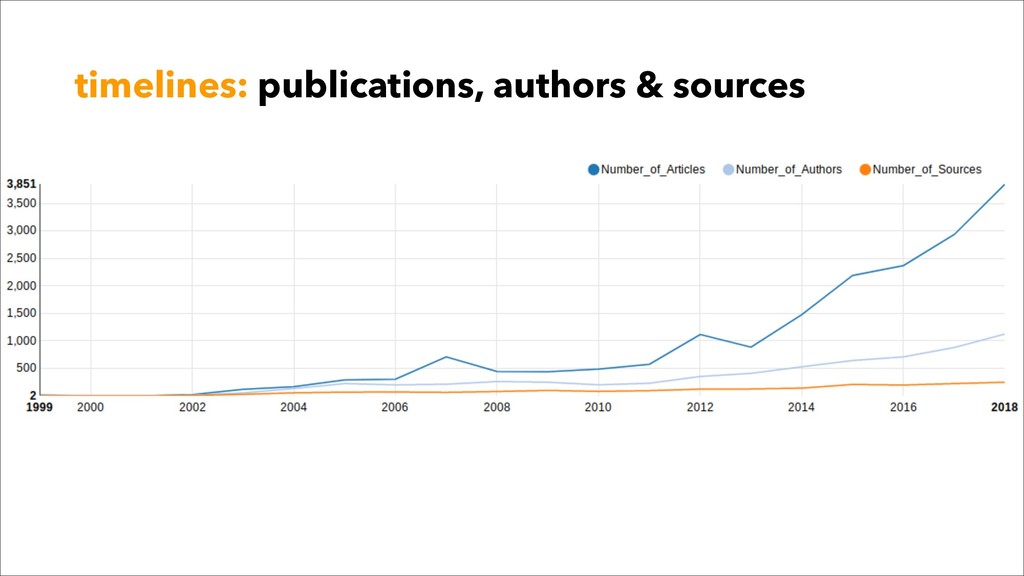
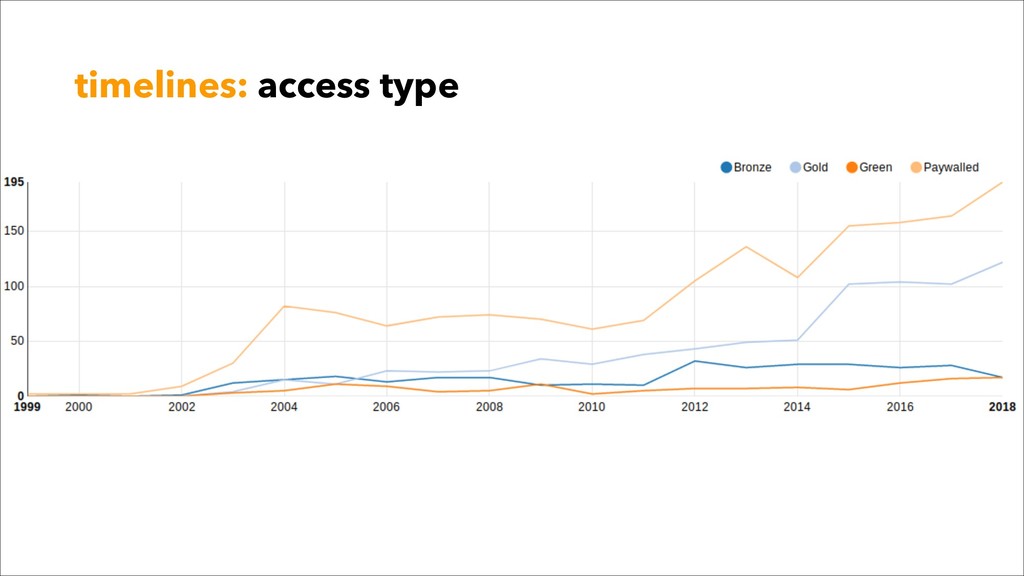
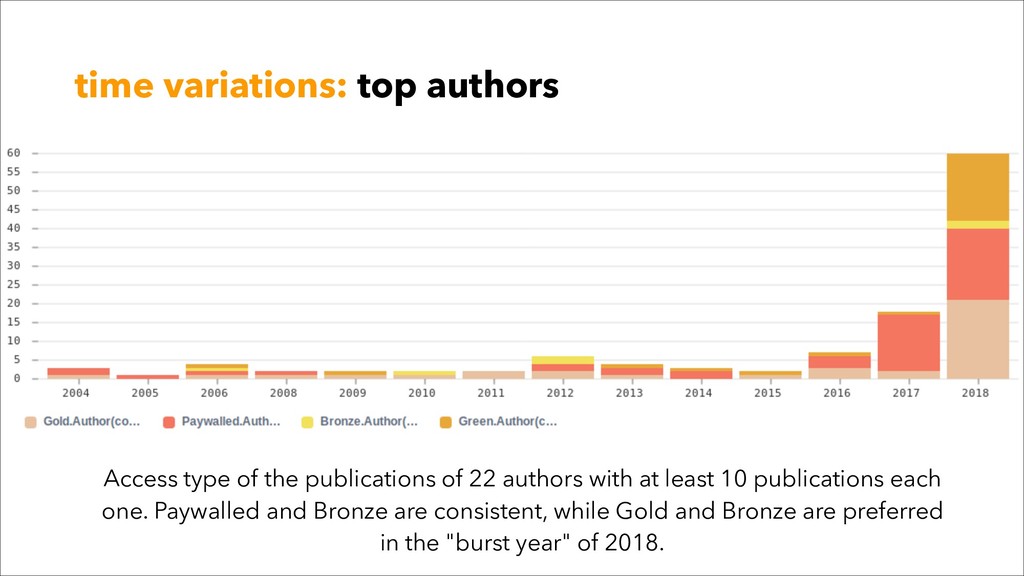
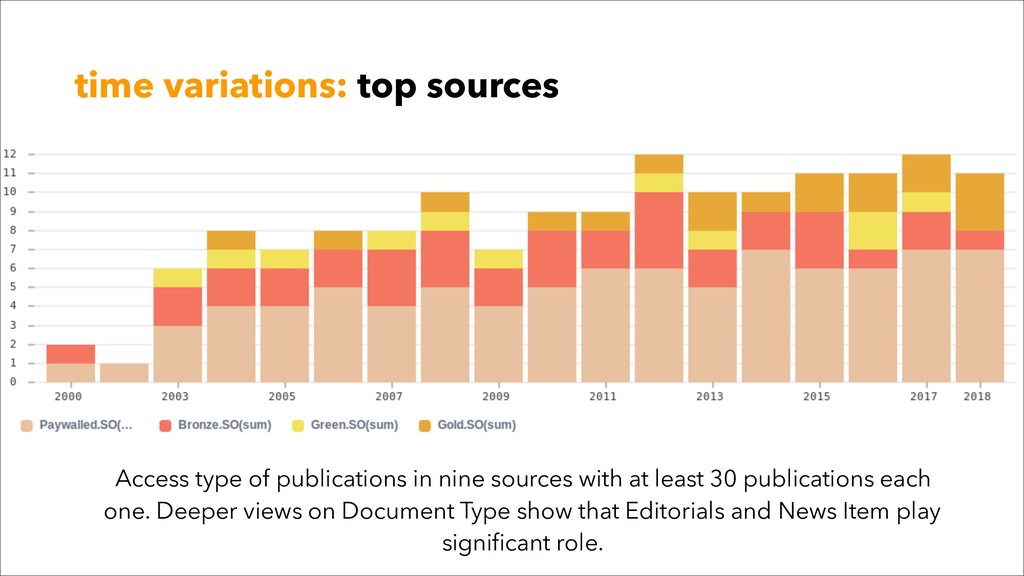
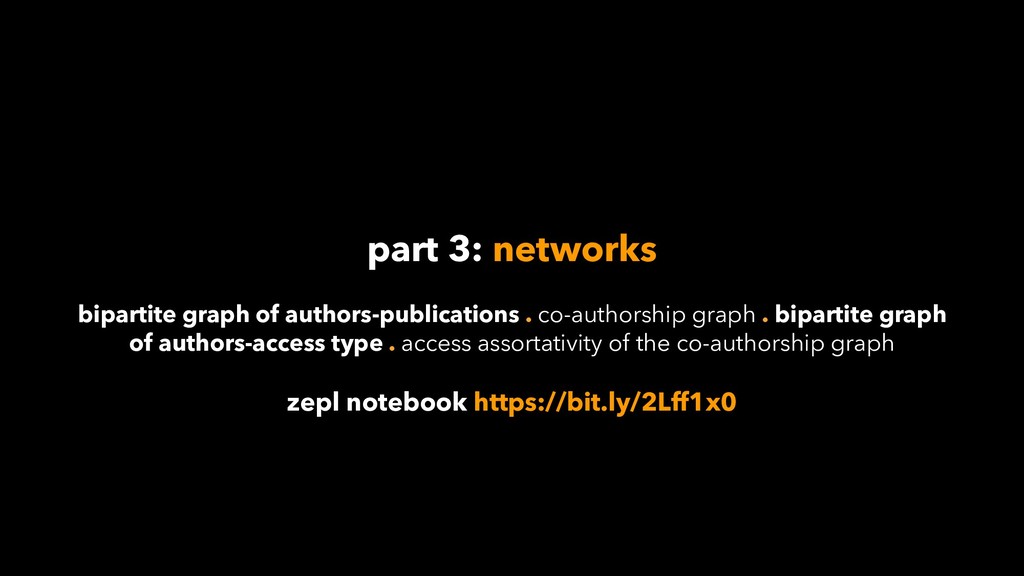
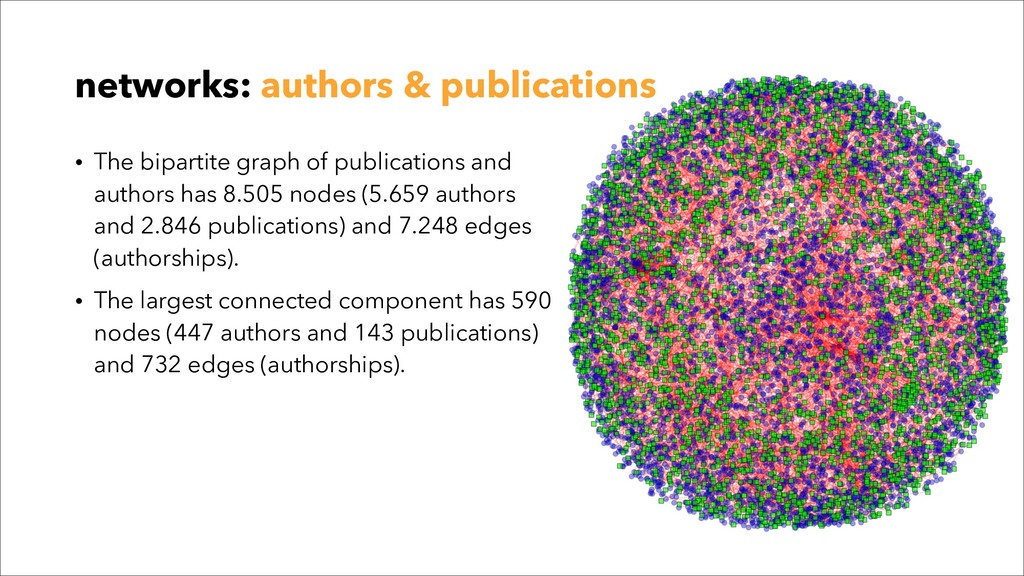
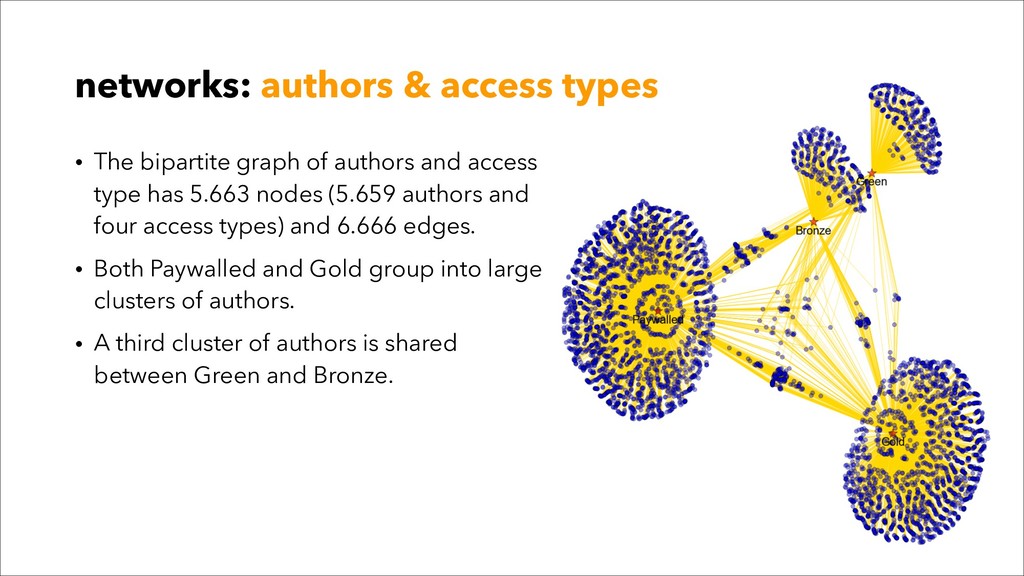
In this paper, we performed a three-tiered micro-analysis study of 2846 publications that focus on Open Science and Open Access, as indexed in Web of Science, in order to see how this literature has developed over the last twenty years. Initially, we were interested in finding how many of these publications were published openly and in which version, namely green, gold or bronze. However, using the open programming language Python, we conducted analyses to further explore the landscape of this literature and we were able to find the key figures that describe its growth rate and several other statistical measures on information, like the main journal venues and authors. We also calculated statistical measures of the types of these publications and whether they were financially supported or not. In the second tier of our analysis, we produced timelines that reflect the temporal progress of authors, journals and descriptors, starting from a time point shortly after the Santa Fe Declaration of Open Access. Finally, in the third tier, we produced networks of entities and performed analyses to identify the main authorship models, which together with other indicators, show if collaboration fosters in this literature and how its main entities are linked together. The study offers a thorough and detailed view on the bibliometric aspects of the “Open” literature conducted by open, transparent and reproducible tools.

More at: https://osf.io/u7azn

Giannis Tsakonas

June 28, 2019
Tweet

More Decks by Giannis Tsakonas

Other Decks in Research

Transcript

  1. a bibliometric study on the literature of Open Science and

    Open Access Giannis Tsakonas1 . Sergios Lenis2 . Μoses Boudourides3,4 1 Library & Information Center, University of Patras, Greece 2 University of Patras, Greece 3 School of Professional Studies, Northwestern University, USA 4 The Science of Networks in Communities (SONIC) Lab, Northwestern University, USA
  2. Input • 2,846 publications / March 2019 • Data retrieved

    from / structured data / OA versioning scheme • Timespan: 1999-2018 • Basic query: TITLE: ("Open Science") OR TITLE: ("Open Access") • Refinements: NOT TOPIC: (endoscop*) NOT TOPIC: (fish*) NOT TOPIC: (enteroscop*) NOT TOPIC: (schedul*) ...
  3. Processing • Processing in Apache Zeppelin, a Python-enabled platform for

    the deployment of multi-purpose research notebooks. • Notebooks are hybrid interactive environments, designed for computational tasks, including ingestion, analysis and visualization of data. • Three notebooks available on Zepl, a platform for data exploration: • Statistics, general statistics overview • Timelines, progress through time • Networks, connections of authors, sources and access types
  4. part 1: statistics authors . journals . productivity . access

    type . funding . document types . identifiers & descriptors . languages . times cited zepl notebook https://bit.ly/2VsZU6c
  5. statistics: authors Bjork, BC Pinfield, S Youngs, R Stewart, MG

    Ruben, R Weber, PC Kraus, DH Chandra, R Sindwani, R Lustig, LR Sataloff, RT Smith, RJ Piccirillo, JF Kennedy, DW Welling, DB Krouse, JH Laakso, M Harnad, S Fisher, EW Jones, TM 0 5 10 15 20 25 30 12 12 12 12 12 12 13 13 13 13 13 13 13 13 13 13 13 13 16 28 Unique authors: 5.659 Authoring teams: 2.362 top 20 authors >
  6. statistics: sources LEARNED PUBLISHING NATURE CHEMICAL & ENGINEERING NEWS ABSTRACTS

    OF PAPERS OF THE AMERICAN CHEMICAL SOCIETY SCIENCE SCIENTOMETRICS CURRENT SCIENCE JOURNAL OF ACADEMIC LIBRARIANSHIP BRITISH MEDICAL JOURNAL SCIENTIST no of publications 0 25 50 75 100 28 31 32 33 34 50 62 62 62 84 Number of journals: 2.846 top 10 journals >
  7. statistics: productivity no of publications 0 50 100 150 200

    250 300 350 400 years '99 '00 '01 '02 '03 '04 '05 '06 '07 '08 '09 '10 '11 '12 '13 '14 '15 '16 '17 '18 351 310 300 292 196 218 187 122 103 125 119 115 109 116 117 49 10 2 3 2
  8. statistics: access type type of access no of publications 0

    569 1138 1708 2277 2846 128 312 772 1.634 Paywalled Gold Bronze Green
  9. statistics: funding type of funding no of publications 0 569

    1138 1708 2277 2846 351 2.495 Without Funding With Funding
  10. statistics: document type no of publications 0 250 500 750

    1000 1250 type of publication Article Editorial News Letter Unlabeled Review Correction 26 129 158 218 223 908 1.184
  11. statistics: descriptors & identifiers Impact Science Journals Articles Communication Web

    Information Authors Model Publication 0 30 60 90 120 24 25 25 25 26 26 71 73 84 113 open access open science scholarly communication publishing open access journals institutional repositories open access publishing journals scholarly publishing repositories 0 100 200 300 400 20 23 25 27 29 32 42 42 69 382
  12. part 2: timelines timelines of publications, authors & sources /

    access type / funding and document type . life cycles of authors per access type . expansion rates of authors . time variations of authors & sources . rates of continuity or lapse for authors & sources zepl notebook https://bit.ly/35kPDxG
  13. lifecycles: authors Excluding 2018, the majority of the authors in

    our sample publish only once and then disappear (83%, 2017). First time authors have a highest at (27.6%, 2004), where as 2016 was a "draining" year (11.3%).
  14. expansion rates: authors The ratio of First Time Authors and

    the One-Off Authors in a year to all existing authors in a year.
  15. time variations: top authors Access type of the publications of

    22 authors with at least 10 publications each one. Paywalled and Bronze are consistent, while Gold and Bronze are preferred in the "burst year" of 2018.
  16. time variations: top sources Access type of publications in nine

    sources with at least 30 publications each one. Deeper views on Document Type show that Editorials and News Item play significant role.
  17. part 3: networks bipartite graph of authors-publications . co-authorship graph

    . bipartite graph of authors-access type . access assortativity of the co-authorship graph zepl notebook https://bit.ly/2Lff1x0
  18. • The bipartite graph of publications and authors has 8.505

    nodes (5.659 authors and 2.846 publications) and 7.248 edges (authorships). • The largest connected component has 590 nodes (447 authors and 143 publications) and 732 edges (authorships). networks: authors & publications
  19. • The bipartite graph of authors and access type has

    5.663 nodes (5.659 authors and four access types) and 6.666 edges. • Both Paywalled and Gold group into large clusters of authors. • A third cluster of authors is shared between Green and Bronze. networks: authors & access types
  20. Some conclusions • "Open Access" is semantically ambiguous term /

    similar terms in medical informatics, electrical engineering, rural planning and land management, drug policies, fishery, etc. / manual cleaning is needed, but not perfect. • We observed similar growth trends like in other fields / steady growth after 2004 > upscaling after 2012. • We also observed that the field is expanding / there are many occasional authors / few are the consistently publishing ones / fresh authors represent approx. 10% each year.