Upgrade to Pro — share decks privately, control downloads, hide ads and more …

Prometheus for Practitioners: Migrating to Prometheus at Fastly

Marcus Barczak
September 05, 2018

Prometheus for Practitioners: Migrating to Prometheus at Fastly

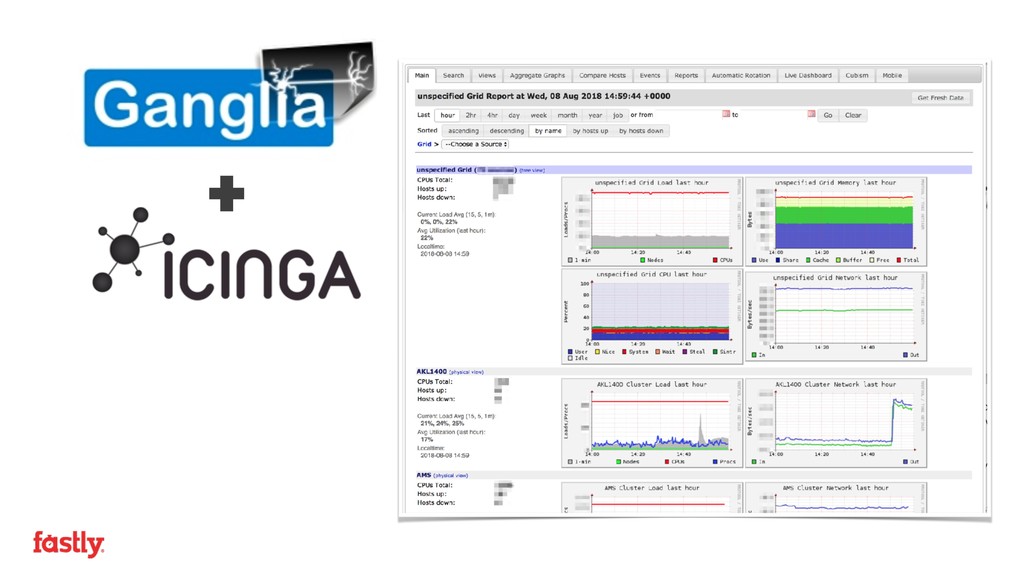
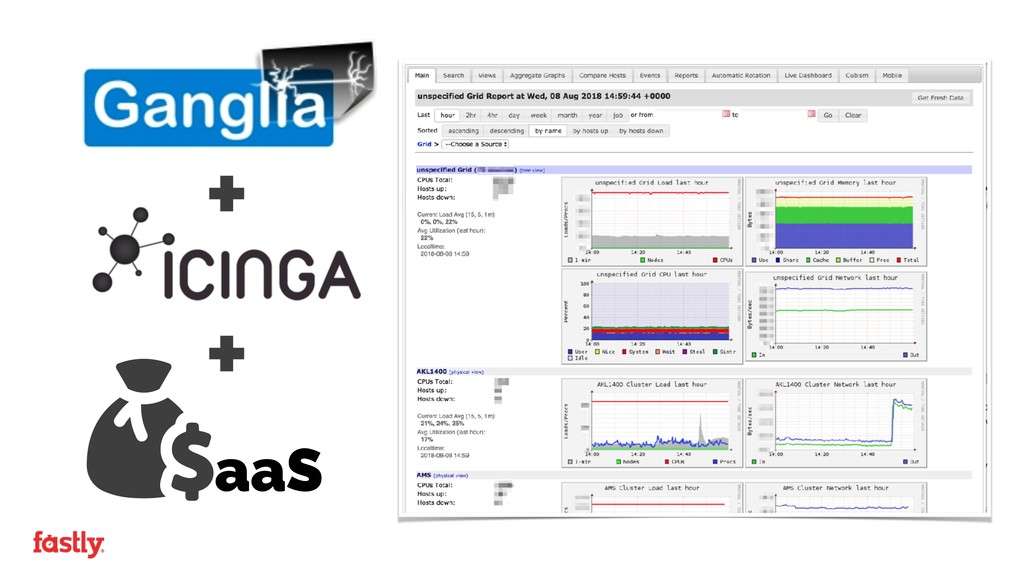
Over the past 6 months at Fastly we’ve migrated away from our legacy monitoring systems and have deployed Prometheus as our primary system for infrastructure and application monitoring.

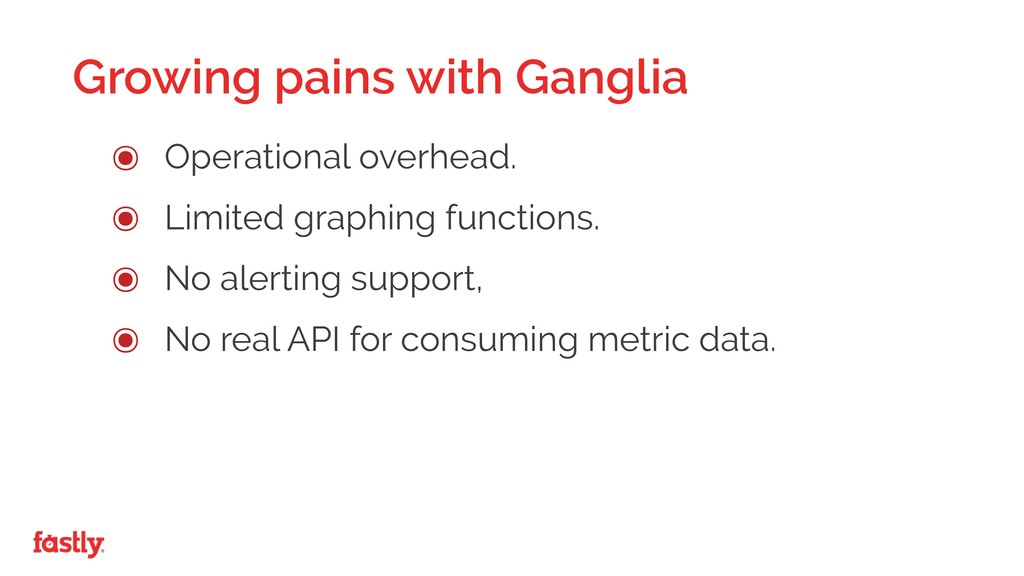
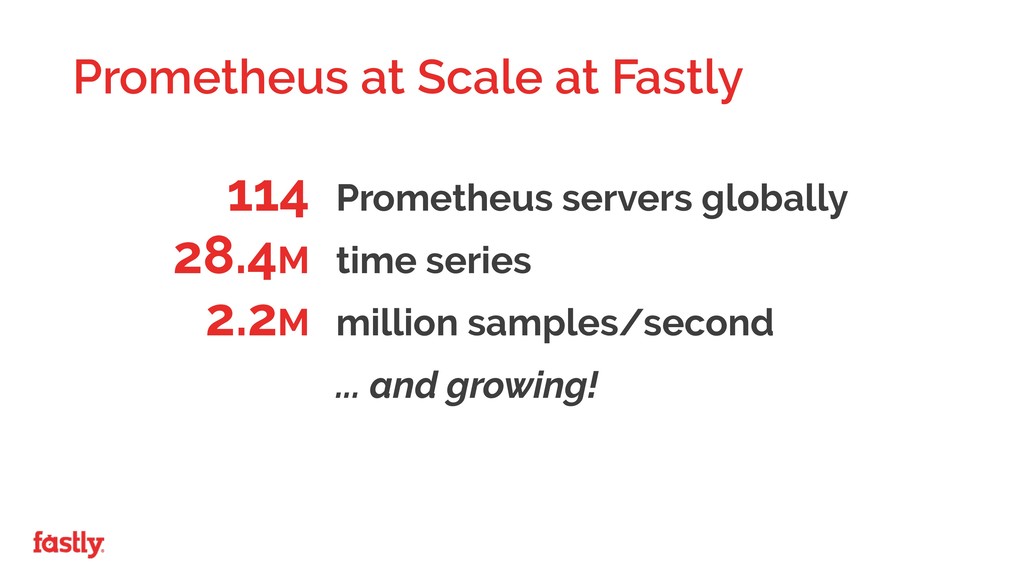
The Prometheus approach posed some unique challenges over traditional monitoring systems, whilst at the same time enabling us to easily scale our monitoring infrastructure alongside our global network growth.

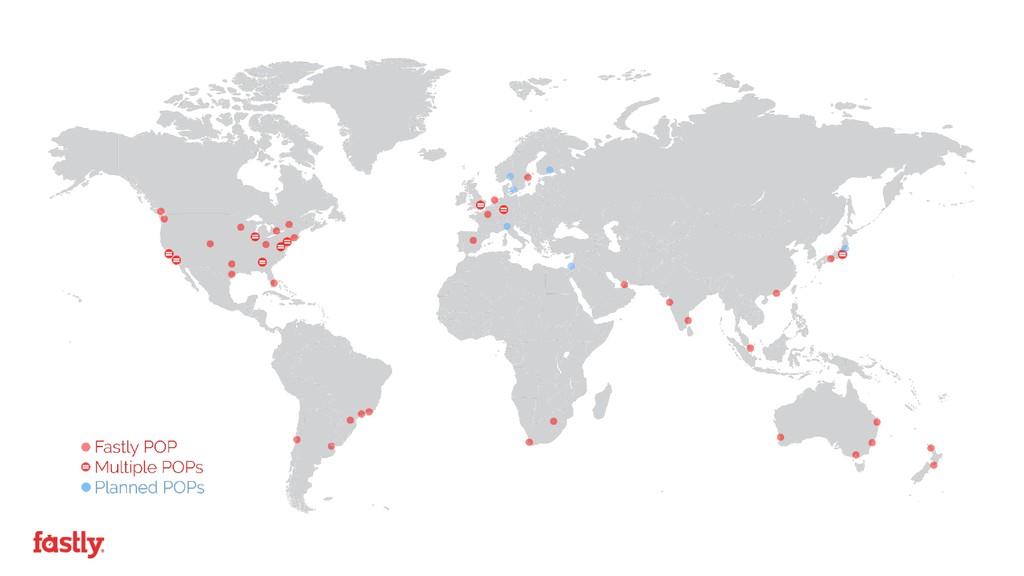
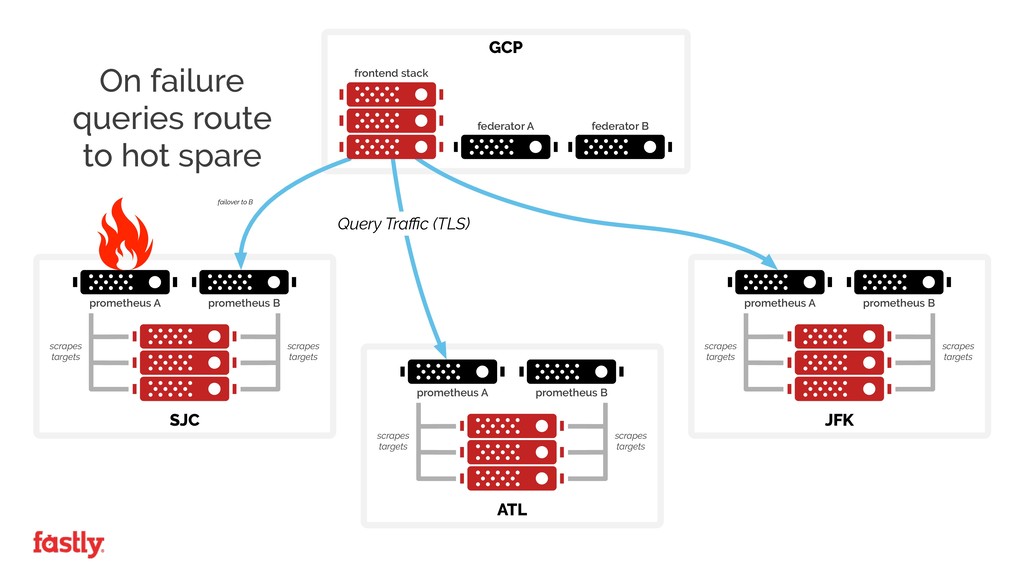
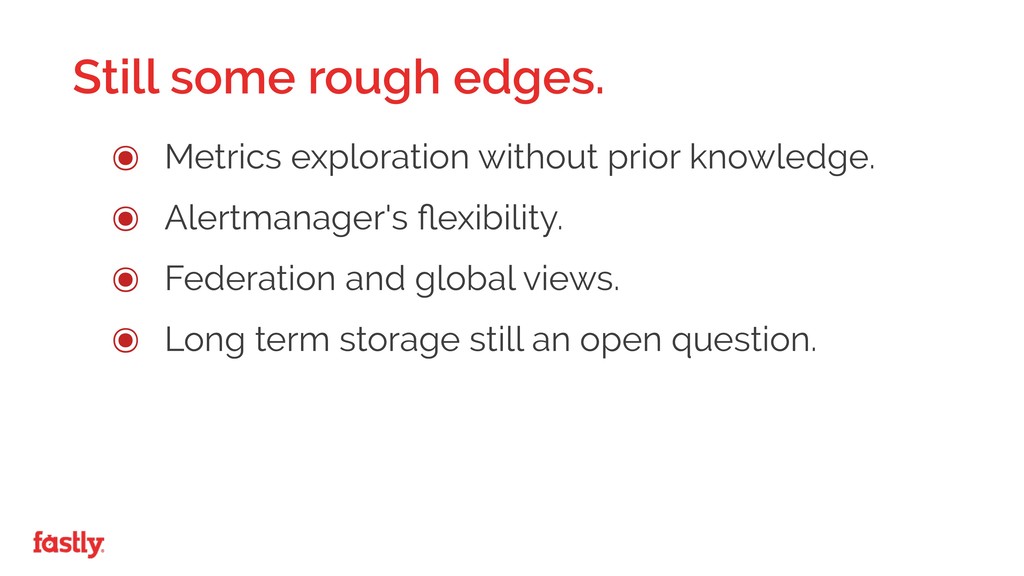
It hasn't been completely smooth sailing and deploying Prometheus across a globe spanning network serving over 10% of the world’s internet traffic has raised its fair share of technical and challenges in moving from centralized push based monitoring systems to a heavily distributed pull based architecture.

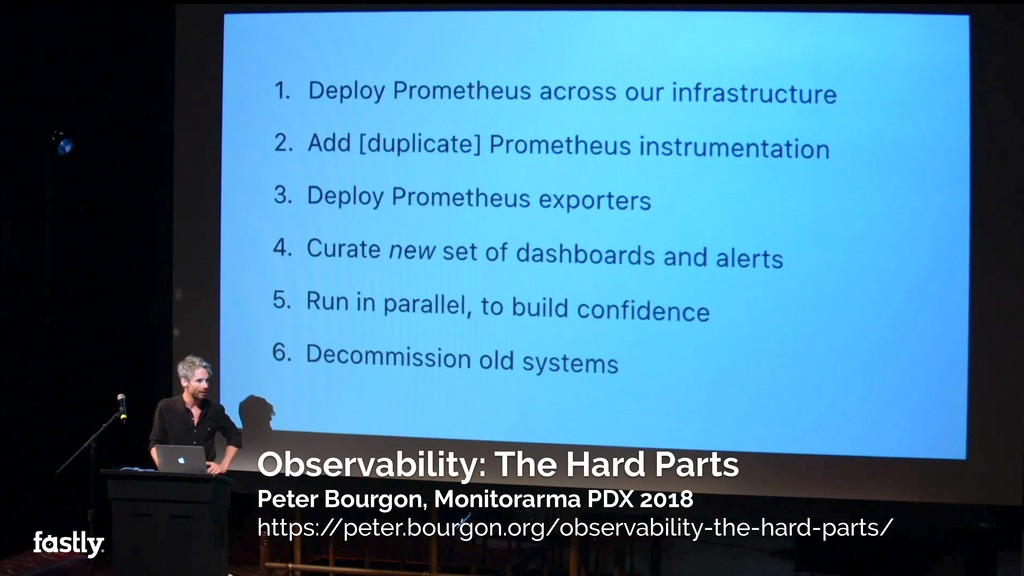
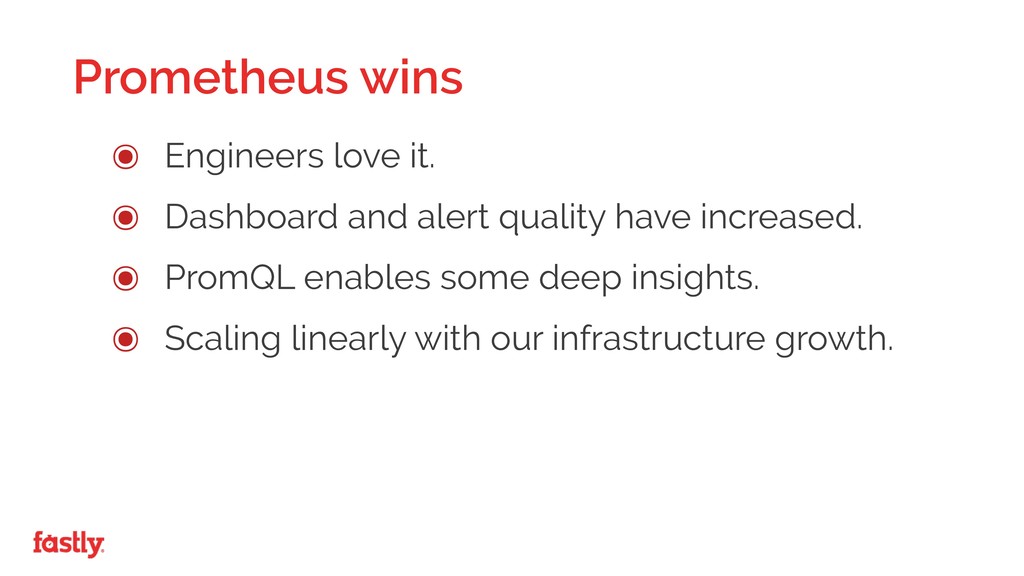
In this presentation you will learn how we addressed these challenges in ways that deviate slightly from conventional wisdom, the mistakes we made along the way, and how the new system has been received by our teams.

We hope that our experiences can help you better understand, from a practical perspective, how to be adapt your knowledge of monitoring past and apply it so be successfully introduce Prometheus to your organization.

Marcus Barczak

September 05, 2018
Tweet

More Decks by Marcus Barczak

Other Decks in Technology

Transcript

  1. Observability: The Hard Parts Peter Bourgon, Monitorarma PDX 2018 https:/

    /peter.bourgon.org/observability-the-hard-parts/
  2. Prometheus for Practioners Migrating to Prometheus at Fastly Observability: The

    "Easy" Parts Monitorama EU 2018 | Marcus Barczak @ickymettle
  3. +

  4. ๏ Operational overhead. ๏ Limited graphing functions. ๏ No alerting

    support, ๏ No real API for consuming metric data. Growing pains with Ganglia
  5. ๏ Now supporting two systems. ๏ Where do I put

    my metrics? ๏ Still writing external plugins and agents. ๏ Monitoring treated as a "post-release" phase. Growing pains doubled
  6. ๏ Scale with our infrastructure growth, ๏ Be easy to

    deploy and operate. ๏ Engineer friendly instrumentation libraries. ๏ First class API support for data access. ๏ To reboot our monitoring culture. Project goals
  7. ?

  8. ๏ Build a proof of concept. ๏ Pair with pilot

    team to instrument their services. ๏ Iterate through the rest. ๏ Run both systems in parallel. ๏ Decommission SaaS system and Ganglia. Getting started
  9. prometheus A prometheus B scrapes targets SJC scrapes targets prometheus

    A prometheus B scrapes targets JFK scrapes targets prometheus A prometheus B scrapes targets ATL scrapes targets GCP federator A federator B frontend stack Query Traffic (TLS)
  10. prometheus A prometheus B scrapes targets SJC scrapes targets prometheus

    A prometheus B scrapes targets JFK scrapes targets prometheus A prometheus B scrapes targets ATL scrapes targets GCP federator A federator B frontend stack Query Traffic (TLS) failover to B On failure queries route to hot spare
  11. Prometheus Server Software Stack Ghost Tunnel TLS termination and auth.

    Service Discovery Sidecar Target configuration Rules Loader Recording and Alert rules Prometheus
  12. Prometheus Server Software Stack Ghost Tunnel TLS termination and auth.

    Service Discovery Sidecar Target configuration Rules Loader Recording and Alert rules Prometheus Typical Server Software Stack Service Discovery Proxy Service discovery and TLS exporter proxy Exporters Built into services or sidecar
  13. ๏ Automatic discovery of targets. ๏ Self-service registration of exporter

    endpoints, ๏ TLS encryption for all exporter traffic. ๏ Minimal exposure of exporter TCP ports. Service discovery requirements
  14. Prometheus Server Software Stack Ghost Tunnel TLS termination and auth.

    PromSD Sidecar Target configuration Prometheus Typical Server Software Stack PromSD Proxy Service discovery and TLS exporter proxy Exporters Built into services or sidecar generates config for prometheus scrapes proxied targets over TLS queries for available targets
  15. promsd sidecar "exporter_hosts": [ "10.0.0.1", "10.0.0.2", "10.0.0.3", "10.0.0.4" ] configly

    fetch list of hosts in a datacenter 1 promsd proxy request /targets endpoint for each host to get list of available scrape targets 3 2 3 output all targets as a file service discovery JSON file 4 Prometheus reads the file and scrapes the configured targets. { "targets": [ “10.0.0.1:9702”, “10.0.0.2:9702” ], "labels": { "__metrics_path__": “/node_exporter_9100/metrics", "job": “node_exporter” } }, { "targets": [ “10.0.0.1:9702”, “10.0.0.2:9702” ], "labels": { "__metrics_path__": "/varnishstat_exporter_19102/metrics", "job": "varnishstat_exporter" } } PromSD sidecar
  16. promsd proxy fetch list of installed systemd services node_exporter process_exporter

    systemd "node_exporter": { "prometheus_properties": { "target": "127.0.0.1:9100" } }, … "varnishstat_exporter": { "prometheus_properties": { "target": "127.0.0.1:19102" } } for each corresponding systemd service fetch the local exporter target address varnishstat_exporter 1 3 2 3 configly exposes an API used by prometheus and promsd sidecar /node_exporter_9100/metrics /varnish_exporter_19102/metrics /targets sidecar PromSD proxy
  17. ๏ Really easy to leverage the file SD mechanism. ๏

    New targets can be added with one line of config. ๏ TLS and authentication everywhere. ๏ Single exporter port open per host. It worked!
  18. Prometheus at Scale at Fastly 114 Prometheus servers globally 28.4M

    time series 2.2M million samples/second * ... and growing!
  19. ๏ Engineers love it. ๏ Dashboard and alert quality have

    increased. ๏ PromQL enables some deep insights. ๏ Scaling linearly with our infrastructure growth. Prometheus wins
  20. ๏ Metrics exploration without prior knowledge. ๏ Alertmanager's flexibility. ๏

    Federation and global views. ๏ Long term storage still an open question. Still some rough edges.