Upgrade to Pro — share decks privately, control downloads, hide ads and more …

Visualizing Agility: Agile Metrics that Matter

Visualizing Agility: Agile Metrics that Matter

By: Jay Packlick

Improving

May 29, 2013
Tweet

More Decks by Improving

Other Decks in Technology

Transcript

  1. Visualizing  Agility  
    Metrics  That  Matter  
    Jay  Packlick    @jpacklick  
    [email protected]  

    View Slide

  2. Me  –  Jay  Packlick  
    •  Traveler  
    •  Guitar  Player  
    •  Nerd    

    View Slide

  3. Why  do  we  need  metrics?  
    How  do  we  decide  
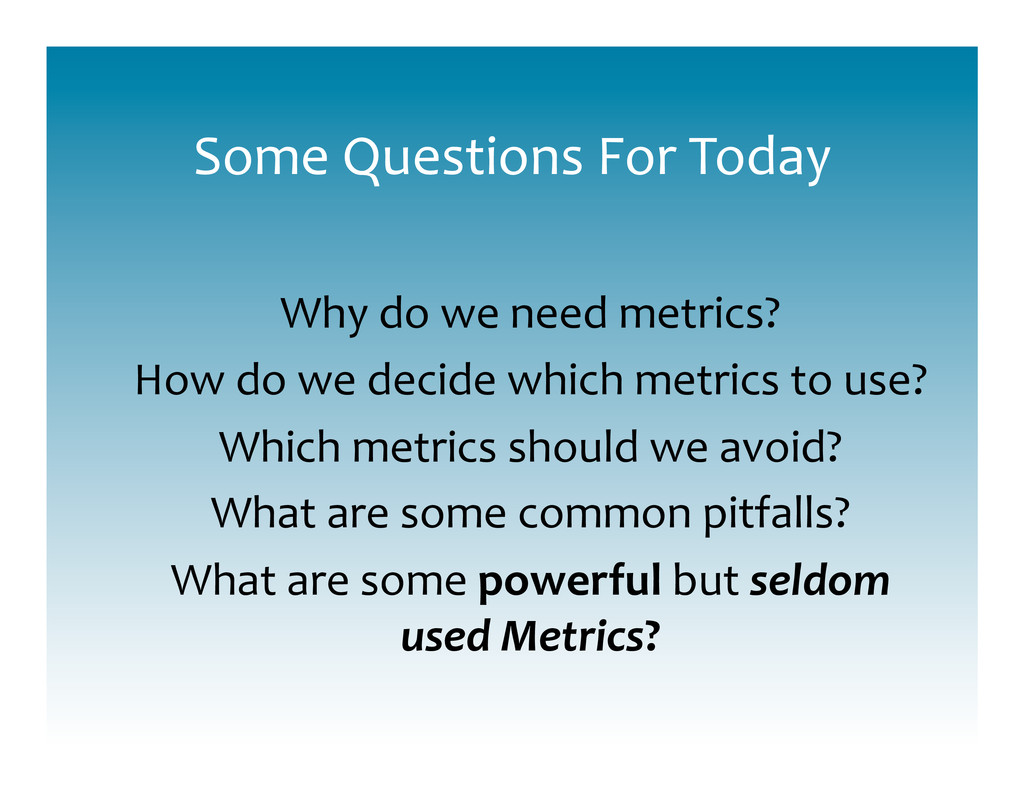
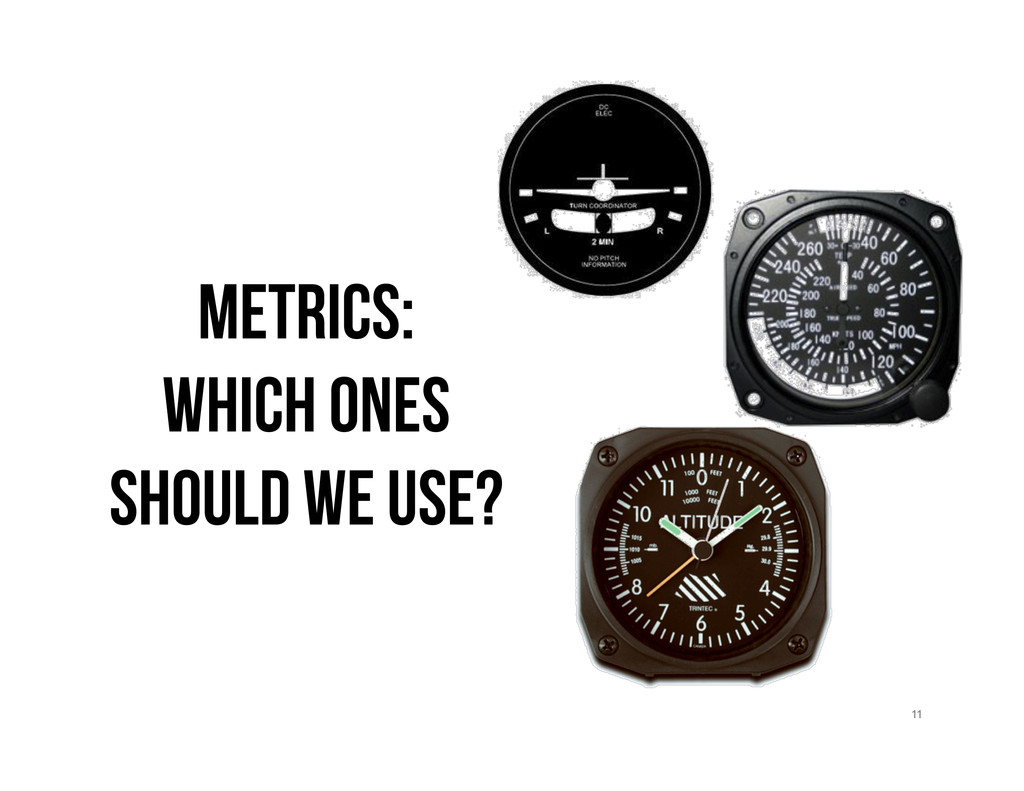
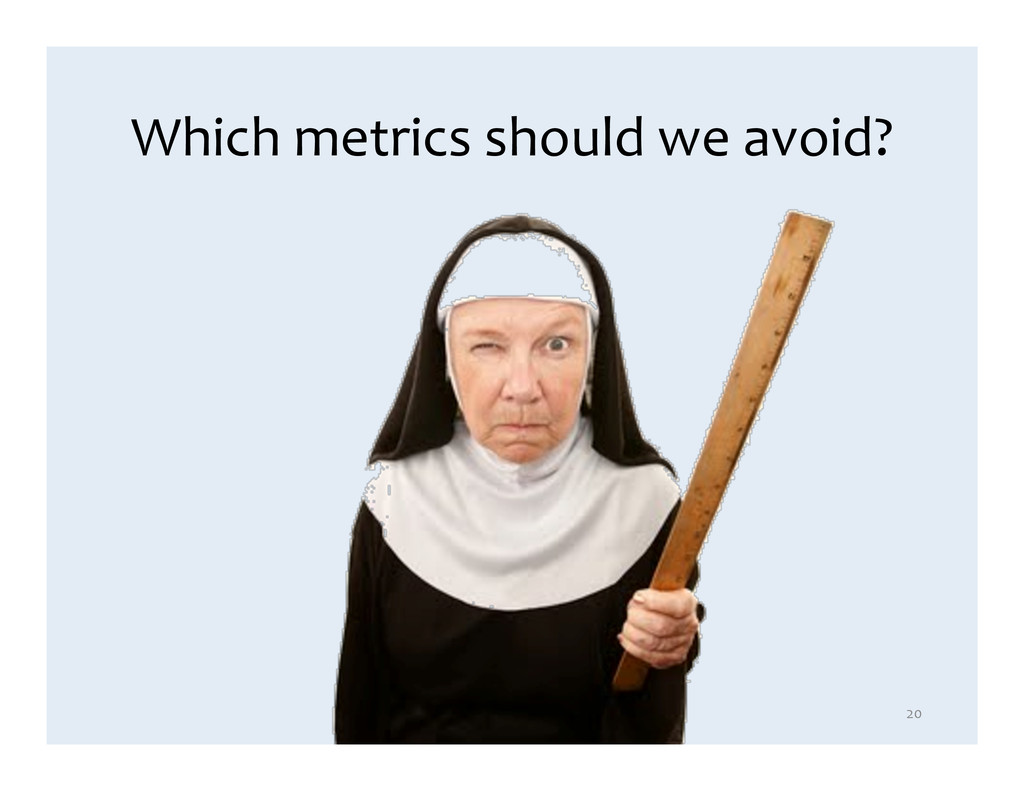
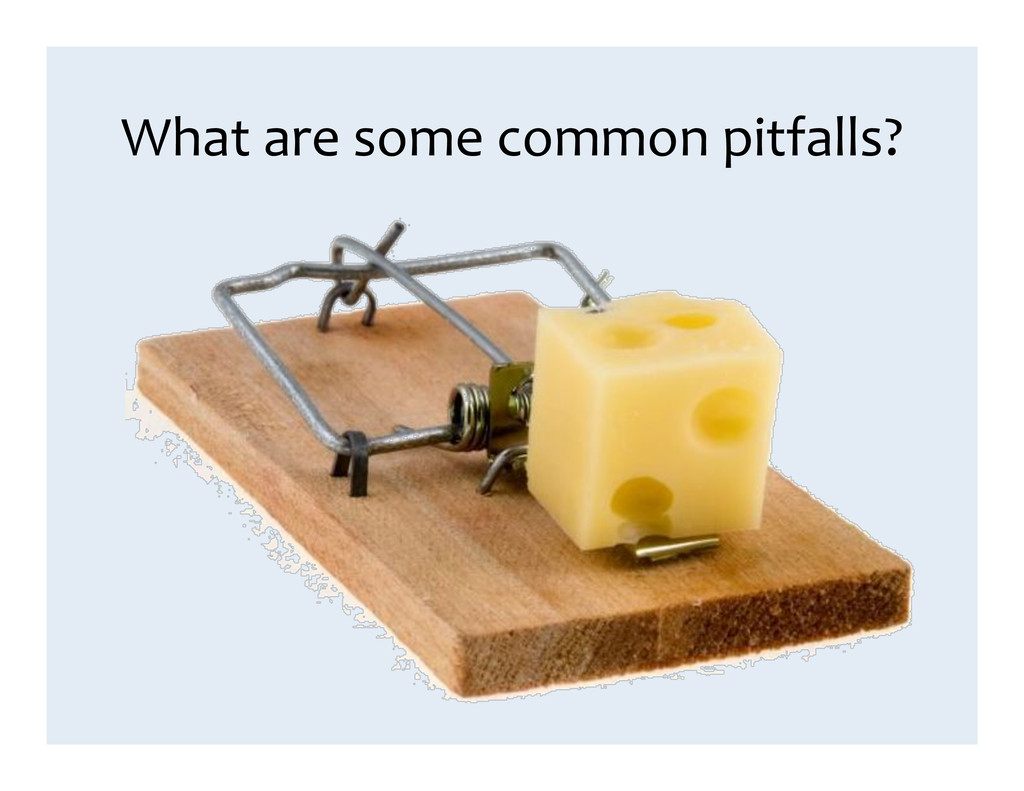
which  metrics  to  use?  
    Which  metrics  should  we  avoid?  
    What  are  some  common  pitfalls?  
    What  are  some  powerful  but  seldom  
    used  Metrics?    
     
    Some  Questions  For  Today  

    View Slide

  4. View Slide

  5. View Slide

  6. The world as we
    imagine it to be….
    … is very often
    different than the
    world that exists.

    View Slide

  7. Consequences  of  delayed  feedback  

    View Slide

  8. View Slide

  9. View Slide

  10. View Slide

  11. 11  
    Metrics:
    which Ones
    SHOULD WE Use?

    View Slide

  12. View Slide

  13. Potential  Value    
    Seconds…

    Car

    Lengths

    Which  has  more  value?  

    View Slide

  14. View Slide

  15. Potential  Value    
    Lines of

    Code

    How  are  we  performing?  

    View Slide

  16. ‘Easy’ TO MEASURE != Valuable

    View Slide

  17. Potential  Value    
    Features

    Accepted

    Lines of

    Code

    How  are  we  performing?  

    View Slide

  18. Metrics  Effect  How  We  Behave  

    View Slide

  19. “Tell  me  how  you  will  measure  me  and  I  will  tell  
    you  how  I  will  behave”  –  Eli  Goldratt  
    So…Be Careful What
    You Ask For

    View Slide

  20. Which  metrics  should  we  avoid?  
    20  

    View Slide

  21. Potential  Value    
    Average

    Velocity

    How  many  features  can  we  complete  this  
    Sprint?  

    View Slide

  22. Be Careful What You Ask For

    View Slide

  23. Potential  For  Evil    

    View Slide

  24. Potential  for  Evil  
    Potential  Value    
    Features

    Accepted

    Lines of

    Code

    Average

    Velocity

    How  Well  Are  We  Performing?  

    View Slide

  25. What  are  some  Agile  metrics?  
    Potential  for  Evil    
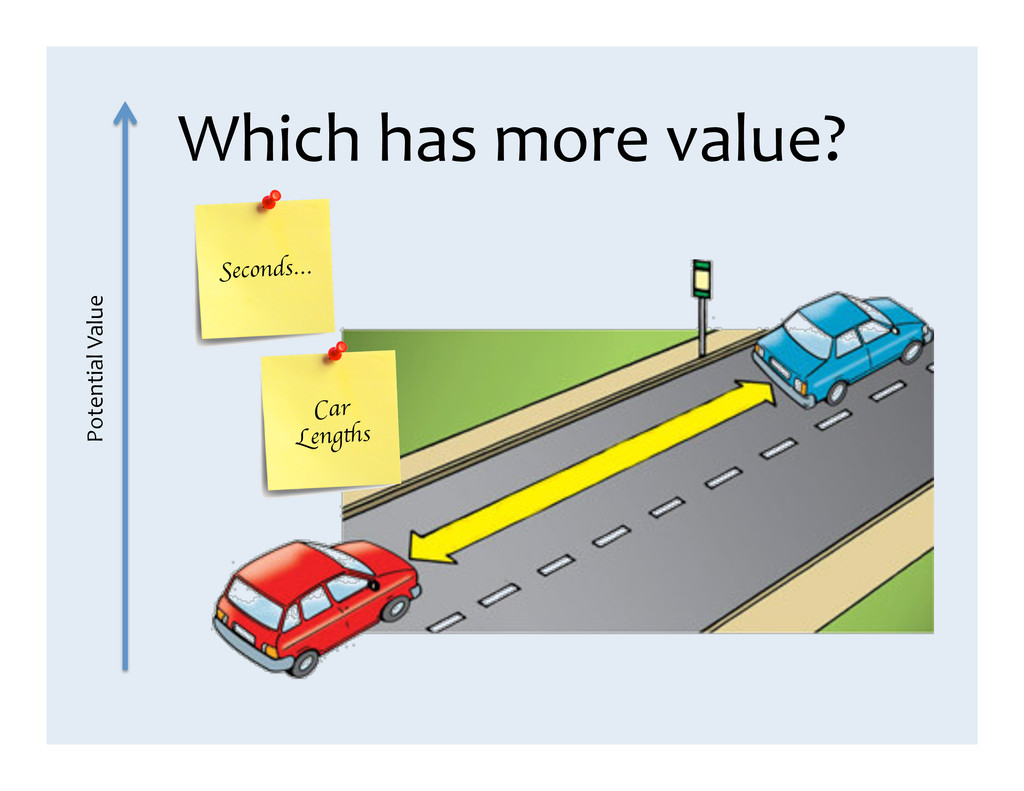
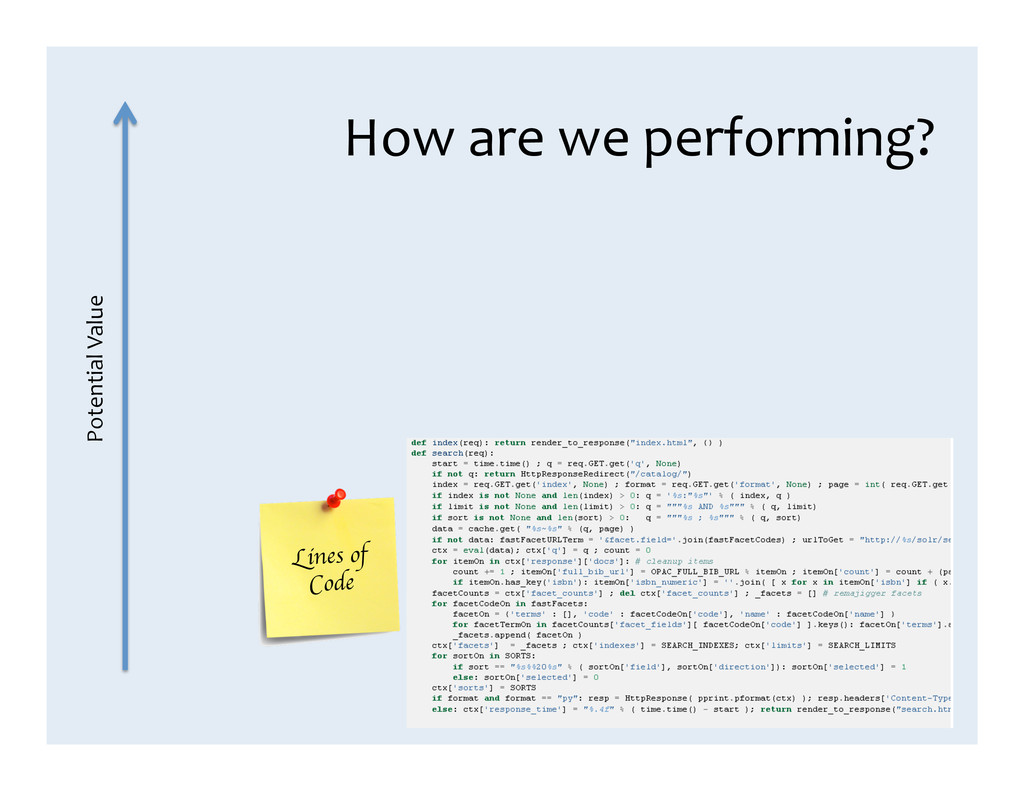
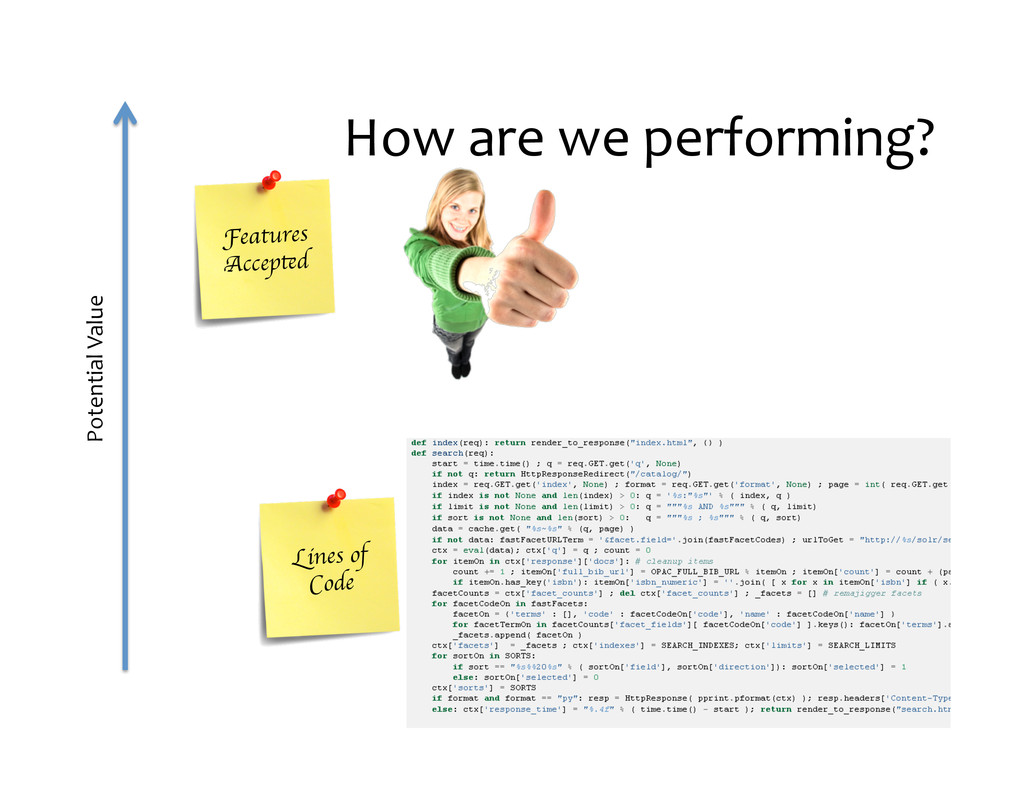
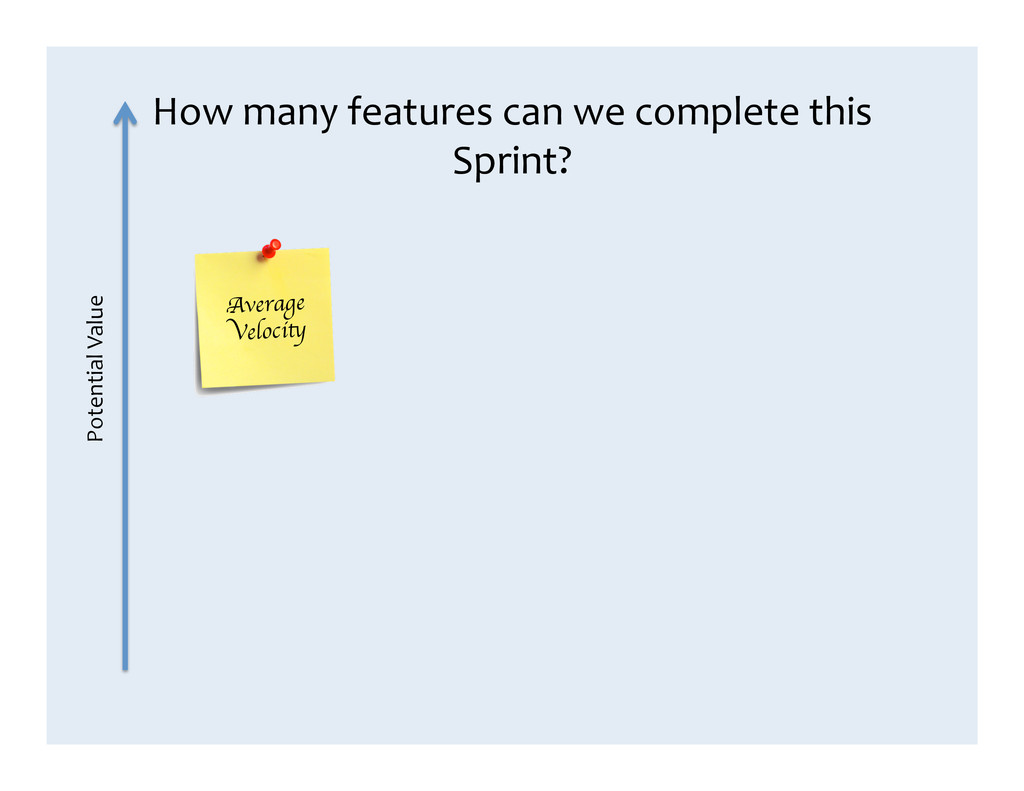
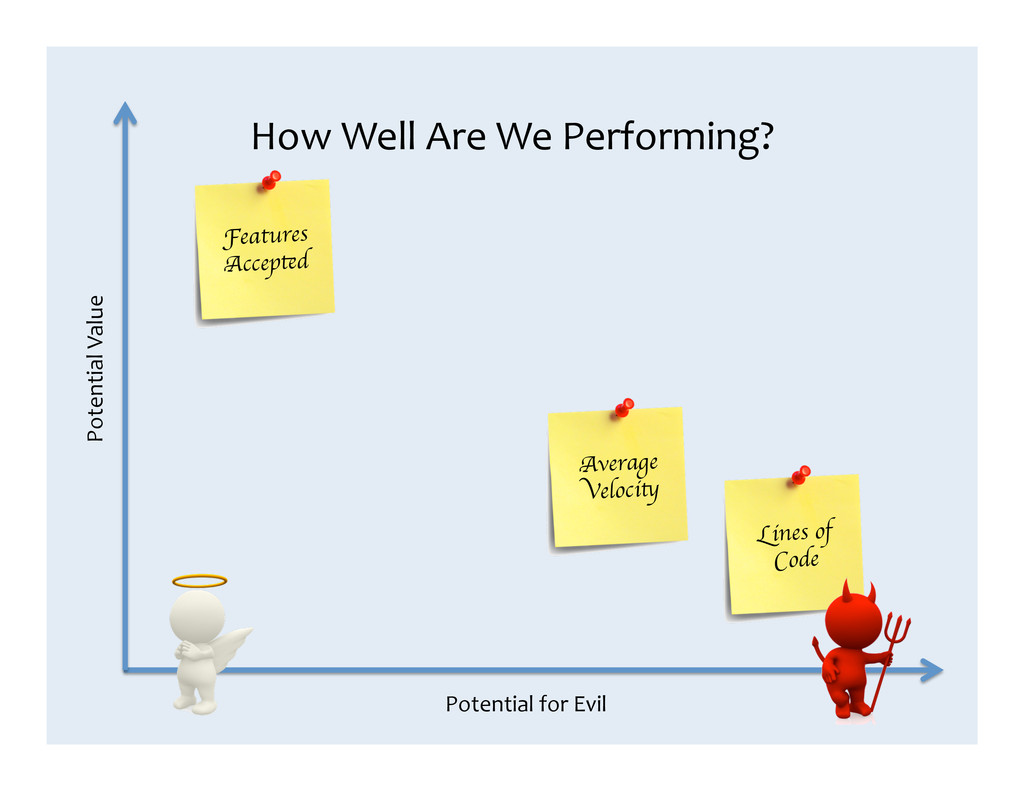
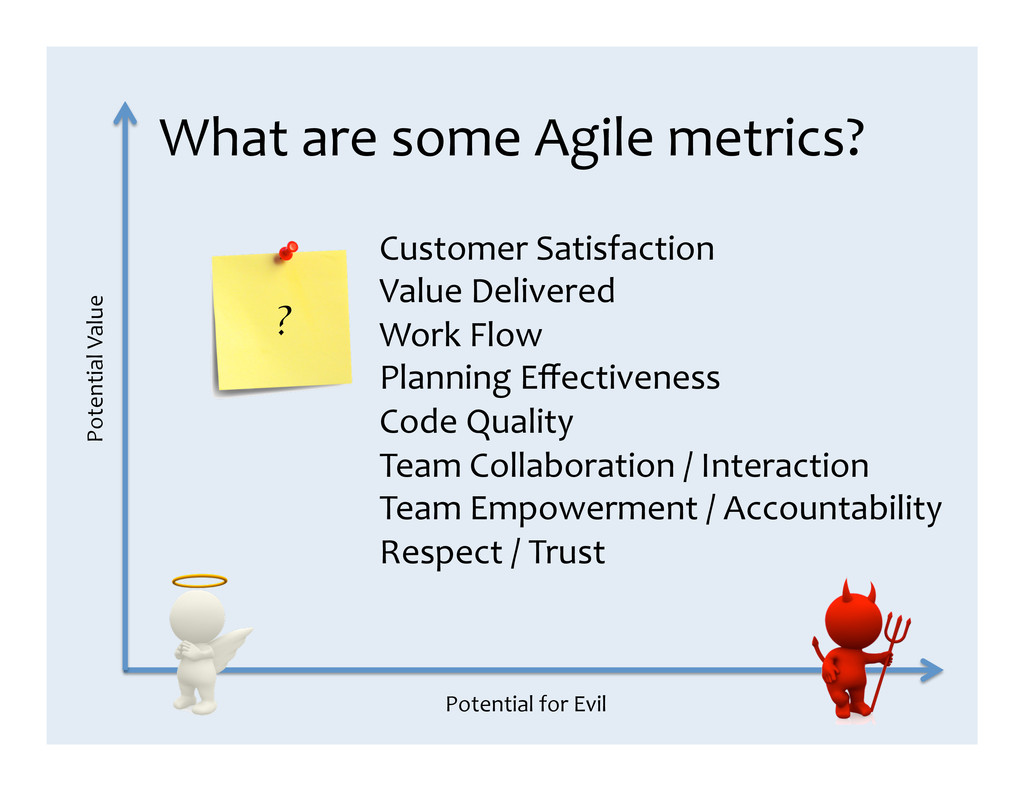
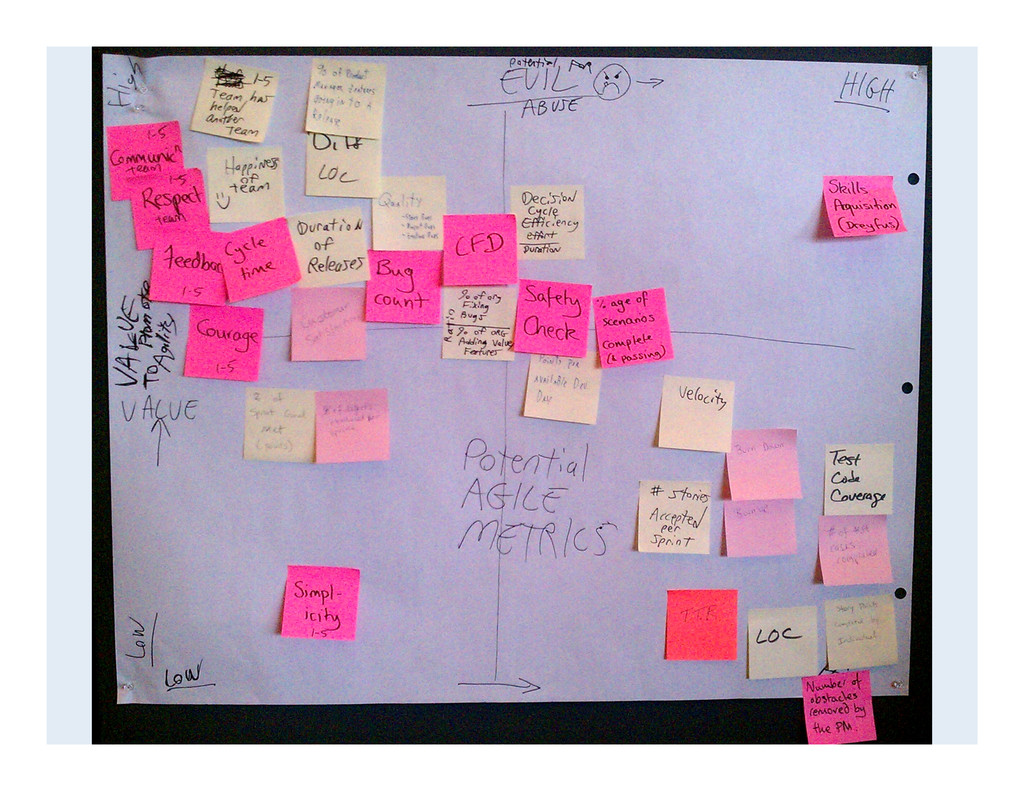
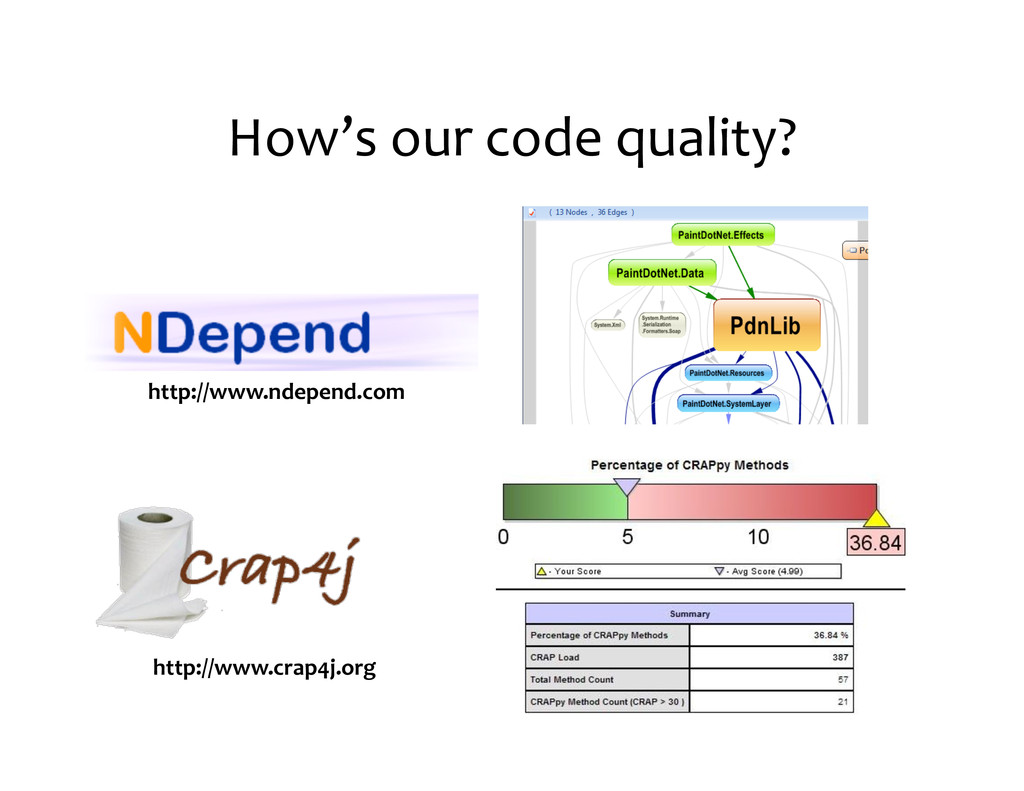
    Potential  Value    
    Customer  Satisfaction  
    Value  Delivered  
    Work  Flow  
    Planning  Effectiveness  
    Code  Quality  
    Team  Collaboration  /  Interaction  
    Team  Empowerment  /  Accountability  
    Respect  /  Trust  
    ?

    View Slide

  26. View Slide

  27. What  are  some  common  pitfalls?  

    View Slide

  28. Page    28  
    Project Goals
    Cost  to  respond  
    $  
    Cost  to  respond  
    $$$$$  
    “…We  have  come  to  value…  
    Responding  to  Change”  

    View Slide

  29. Agile  Assessments…  

    View Slide

  30. Consider  ‘Merit  Badges’  Instead  

    View Slide

  31. View Slide

  32. Metrics:  Make  Em  Visible!    
    32  
    0%  
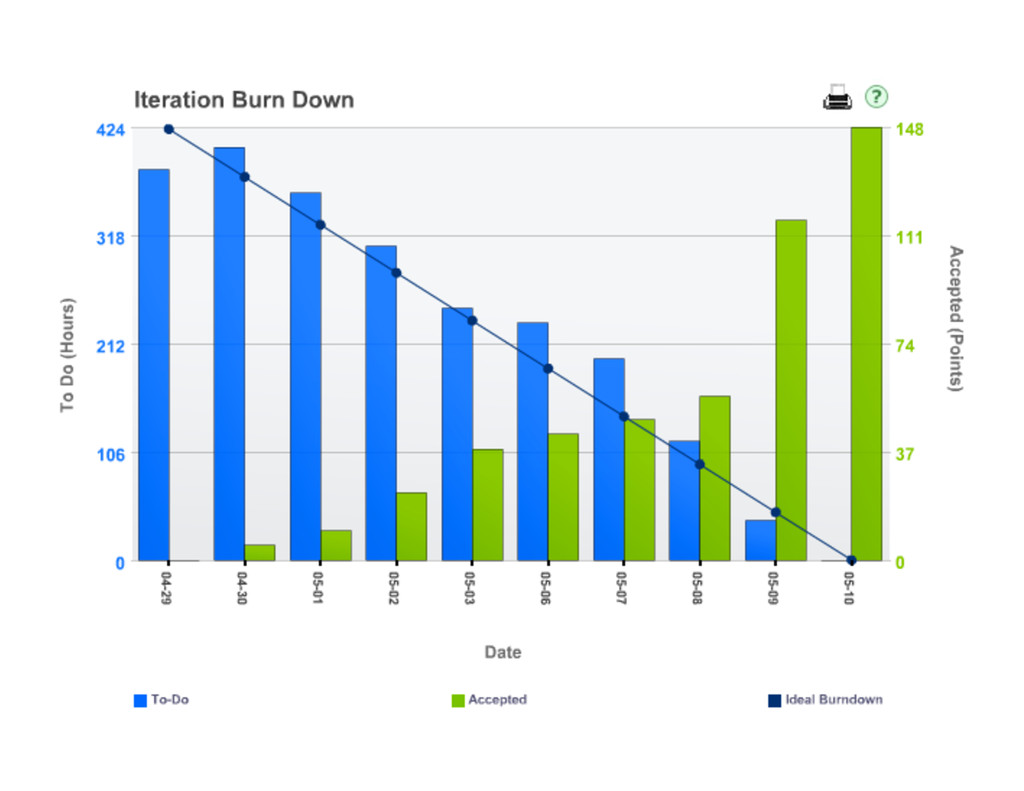
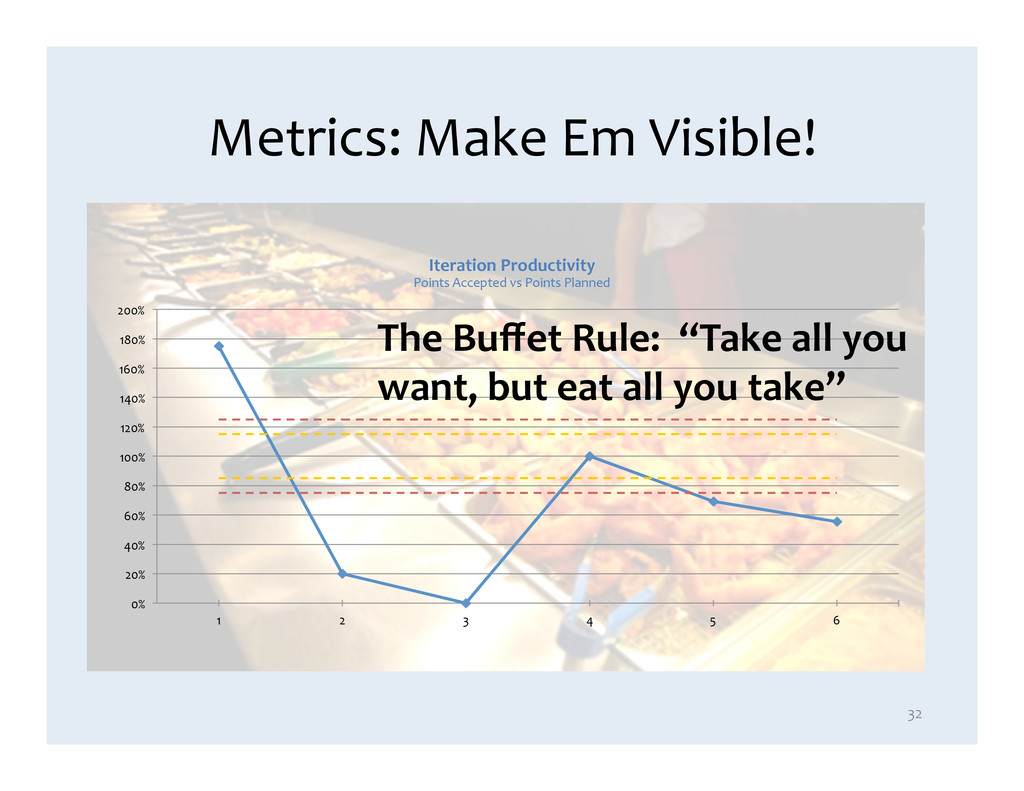
    20%  
    40%  
    60%  
    80%  
    100%  
    120%  
    140%  
    160%  
    180%  
    200%  
    1   2   3   4   5   6  
    Iteration  Productivity  
    Points  Accepted  vs  Points  Planned  
    The  Buffet  Rule:    “Take  all  you  
    want,  but  eat  all  you  take”  

    View Slide

  33. Consider  Project  Sliders  

    View Slide

  34. What are some powerful (but
    seldom used) metrics?

    View Slide

  35. Lead  Time  
    Cycle  Time  
    WIP  
    Remaining  to  be  done  
    Scope  Increase  
    How  is  our  throughput?  

    View Slide

  36. How  much  time  do  we  
    spend  waiting?  
    “Agile  is  the  art  of  eliminating  delay”    
    –  Alan  Shalloway  

    View Slide

  37. Process  Cycle  Efficiency  (PCE)  
    Page    37  
    %  Time  
    Effort  
    Delay  
    =    100%  PCE  (  zero  delay  )    
    6  days  effort  
    6  days  duration  
    Effort  =    
    Duration  

    View Slide

  38. Process  Cycle  Efficiency  (PCE)  
    Page    38  
    %  Time  
    Effort  
    Delay  
    Duration  =  19  days    
    =  31%  PCE  
    6  days  effort  
    19  days  duration  
    Effort  =  6  
    days  

    View Slide

  39. Process  Cycle  Efficiency  (PCE)  
    Page    39  
    %  Time  
    Effort  
    Delay  
    Duration  =  14  days    
    =  43%  PCE  
    6  days  effort  
    14  days  duration  
    Effort  =  6  
    days  

    View Slide

  40. How’s  our  code  quality?  
    http://www.crap4j.org  
    http://www.ndepend.com  

    View Slide

  41. What  question  are  we  trying  to  answer?  
    What’s  the  
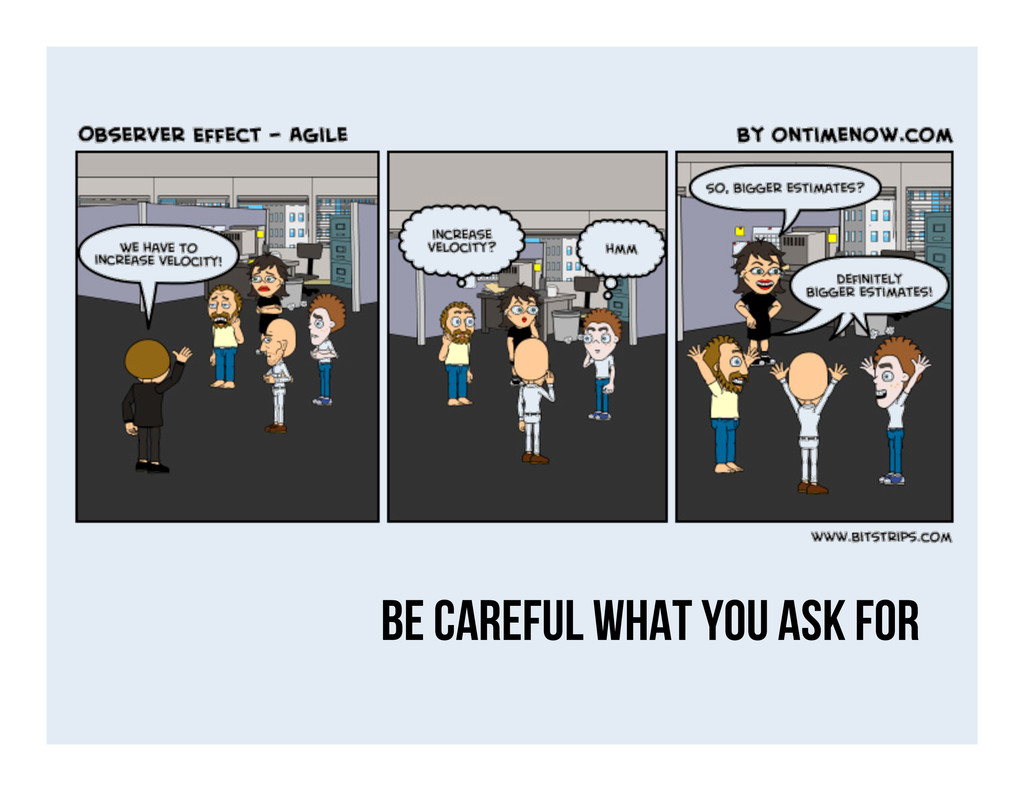
goal  (target  condition)?  
    Who  is  the  target  audience?  
    What’s  the  relative  value  of  the  metric?  
    What  undesirable  behavior  might  this  drive?  
    How  will  people  try  to  game  it?    
    How  are  we  going  to  make  it  visible?  
    In  deciding  which  metric  to  use  
    Ask…  

    View Slide

  42. Jay  Packlick  
    @jpacklick  
    [email protected]  
    www.linkedin.com/in/jpacklick/  
    agileorganizations.wordpress.com  

    View Slide