Upgrade to Pro — share decks privately, control downloads, hide ads and more …

Veridion - IT Press Tour #69 September 2026

Veridion - IT Press Tour #69 September 2026

Avatar for The IT Press Tour

The IT Press Tour PRO

September 02, 2026

More Decks by The IT Press Tour

Other Decks in Technology

Transcript

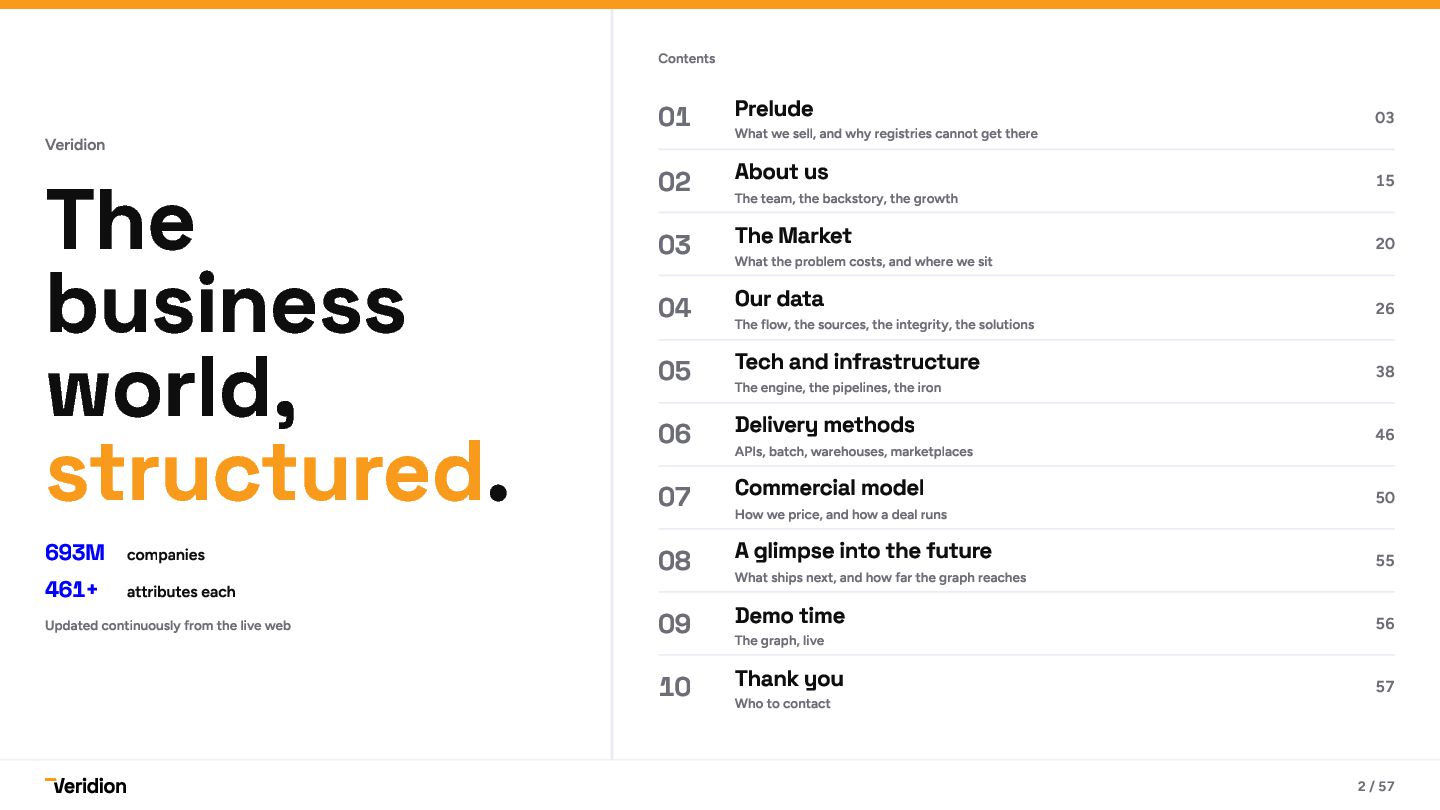
  1. Contents The business world, structured. Veridion 693M companies 461+ attributes

    each Updated continuously from the live web 01 02 03 04 05 06 07 08 09 10 Prelude 03 About us 15 The Market 20 Our data 26 Tech and infrastructure 38 Delivery methods 46 Commercial model 50 A glimpse into the future 55 Demo time 56 Thank you 57 What we sell, and why registries cannot get there The team, the backstory, the growth What the problem costs, and where we sit The flow, the sources, the integrity, the solutions The engine, the pipelines, the iron APIs, batch, warehouses, marketplaces How we price, and how a deal runs What ships next, and how far the graph reaches The graph, live Who to contact 2 / 57
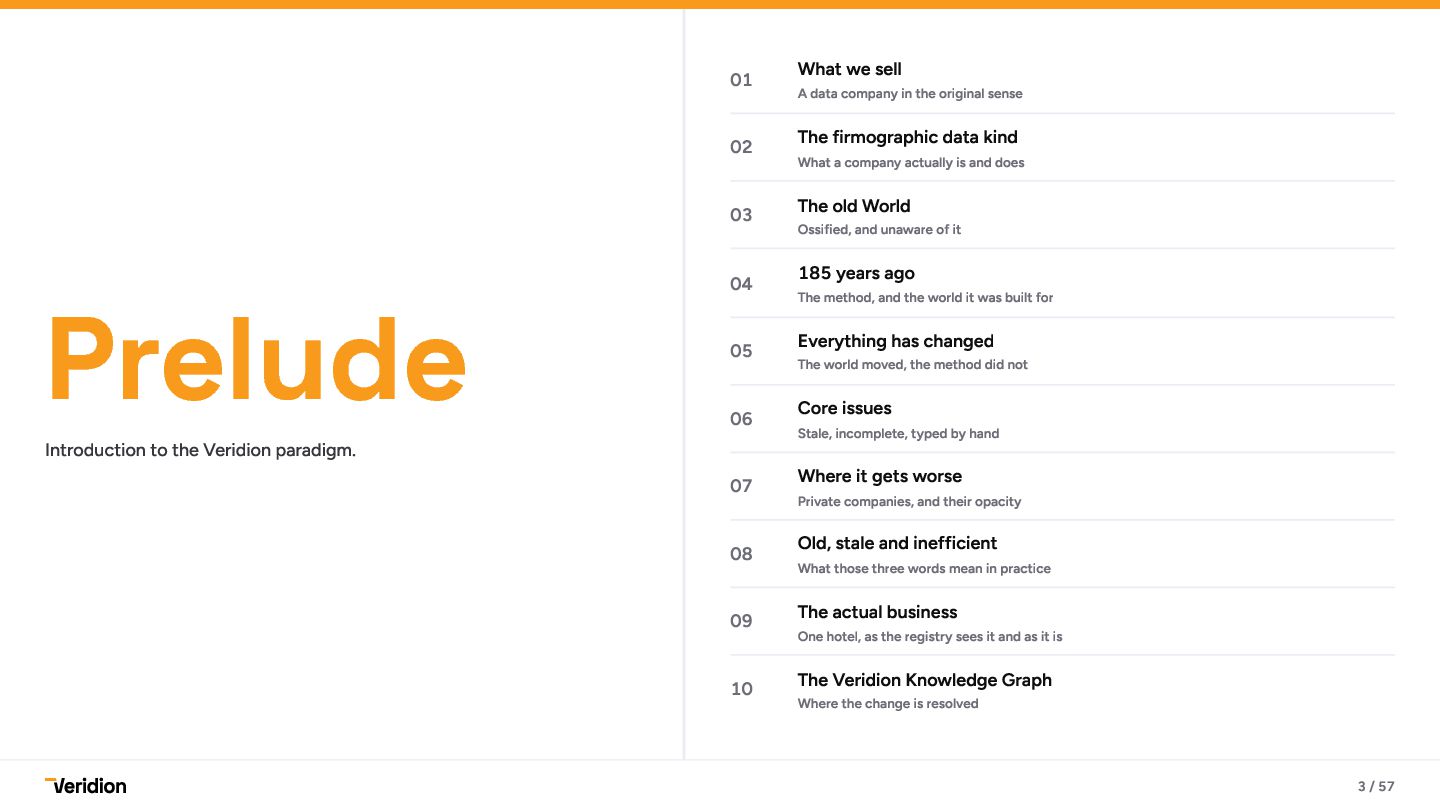
  2. Prelude Introduction to the Veridion paradigm. 01 What we sell

    02 The firmographic data kind 03 The old World 04 185 years ago 05 Everything has changed 06 Core issues 07 Where it gets worse 08 Old, stale and inefficient 09 The actual business 10 The Veridion Knowledge Graph A data company in the original sense What a company actually is and does Ossified, and unaware of it The method, and the world it was built for The world moved, the method did not Stale, incomplete, typed by hand Private companies, and their opacity What those three words mean in practice One hotel, as the registry sees it and as it is Where the change is resolved 3 / 57
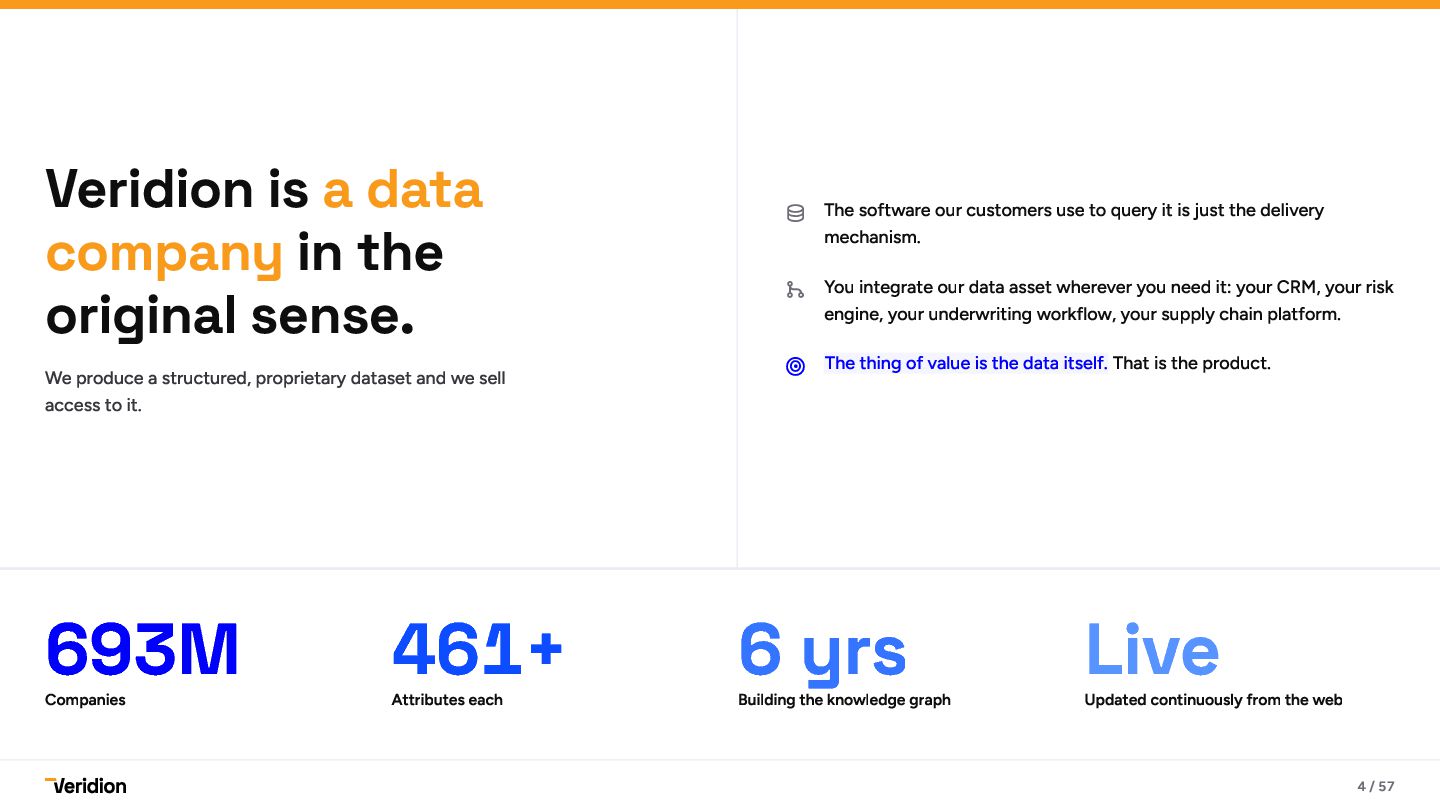
  3. Veridion is a data company in the original sense. We

    produce a structured, proprietary dataset and we sell access to it. 693M Companies 461+ Attributes each  The software our customers use to query it is just the delivery mechanism.  You integrate our data asset wherever you need it: your CRM, your risk engine, your underwriting workflow, your supply chain platform.  The thing of value is the data itself. That is the product. 6 yrs Building the knowledge graph Live Updated continuously from the web 4 / 57
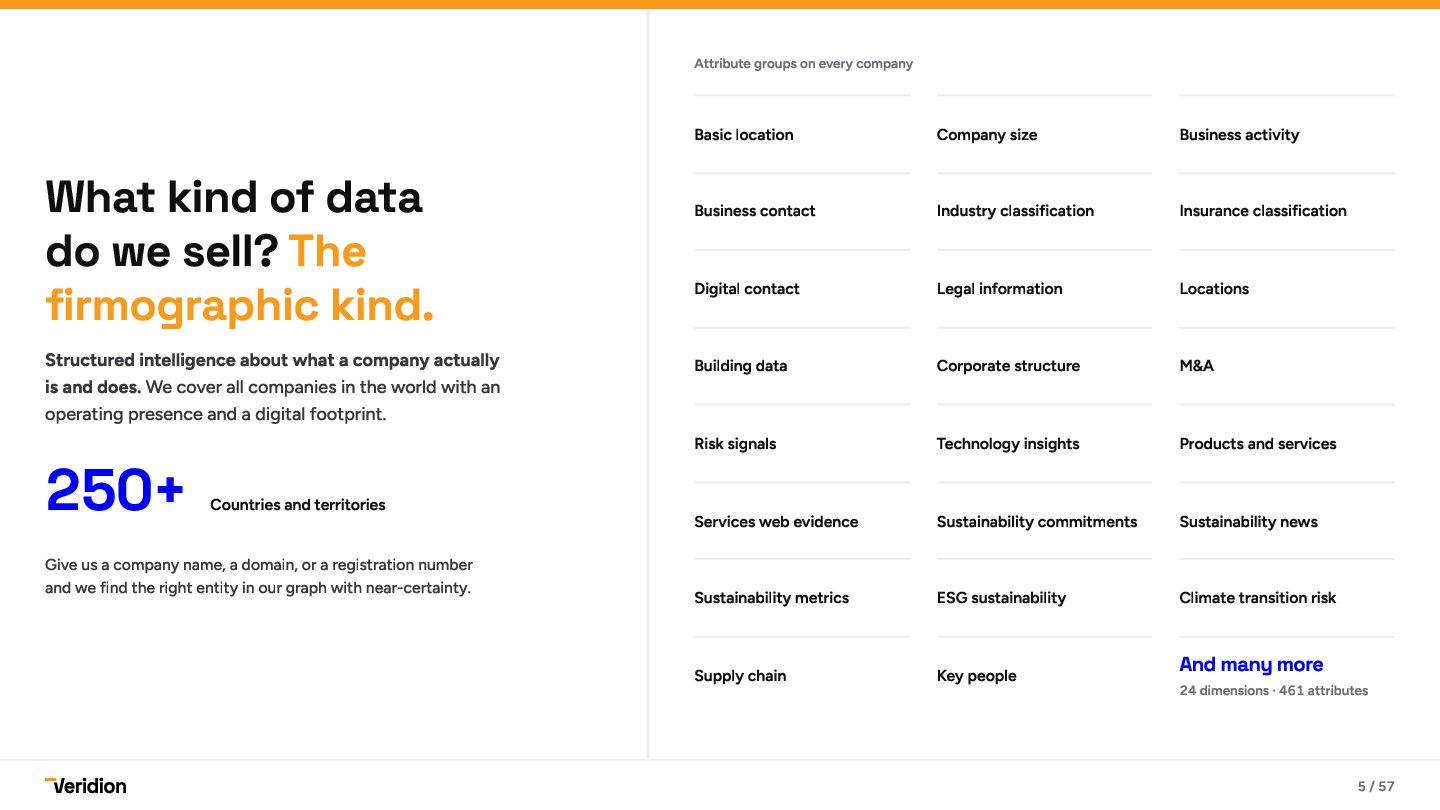
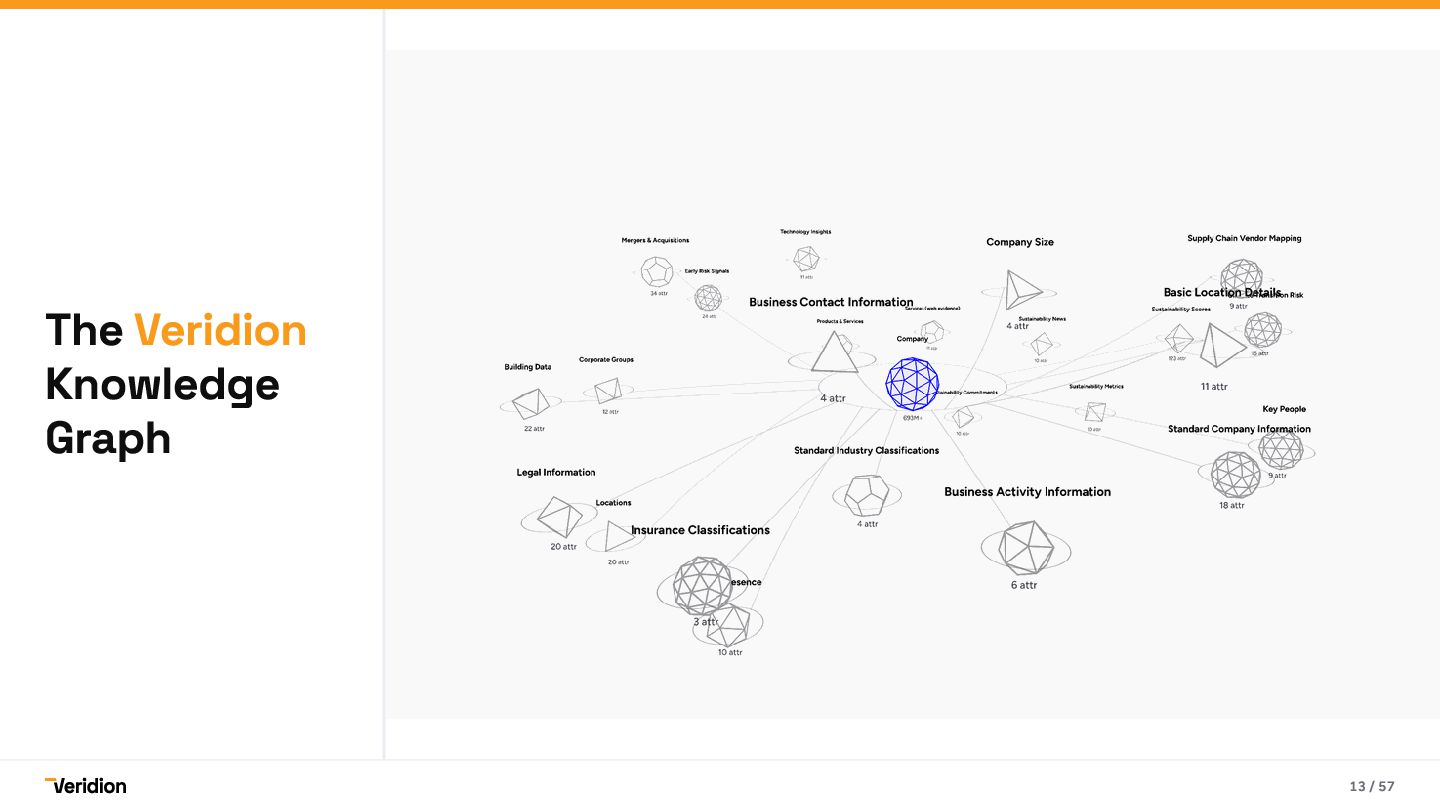
  4. Attribute groups on every company What kind of data do

    we sell? The firmographic kind. Structured intelligence about what a company actually is and does. We cover all companies in the world with an operating presence and a digital footprint. 250+ Countries and territories Give us a company name, a domain, or a registration number and we find the right entity in our graph with near-certainty. Basic location Company size Business activity Business contact Industry classification Insurance classification Digital contact Legal information Locations Building data Corporate structure M&A Risk signals Technology insights Products and services Services web evidence Sustainability commitments Sustainability news Sustainability metrics ESG sustainability Climate transition risk Supply chain Key people And many more 24 dimensions · 461 attributes 5 / 57
  5. The old World One major drawback runs through every incumbent,

    and through every buyer downstream of them. The bigger problem: the industry is highly ossified, and unaware of how deprecated the old paradigm has become. That deprecation is our edge. 6 / 57
  6. Core issues In 2026, registry data is still the backbone

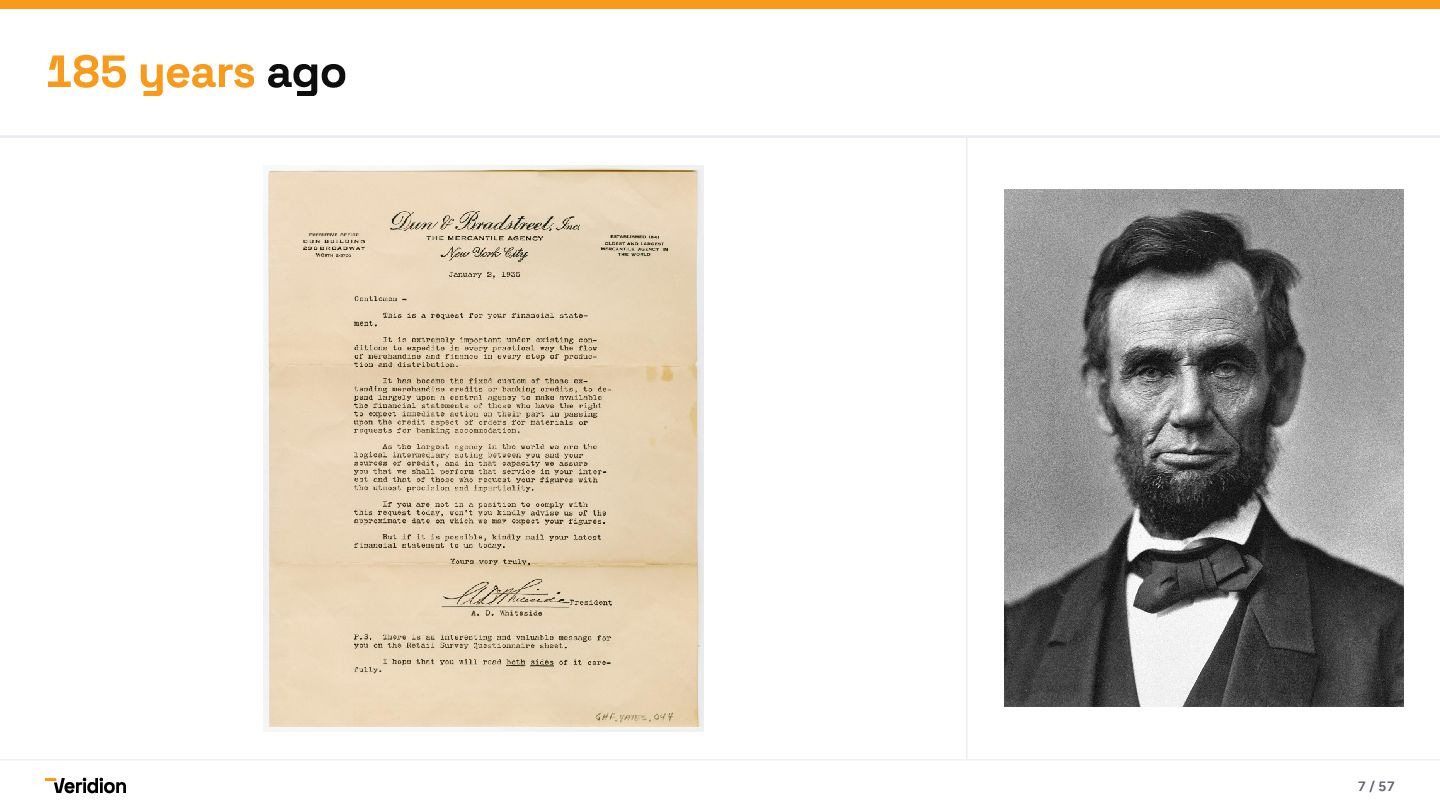
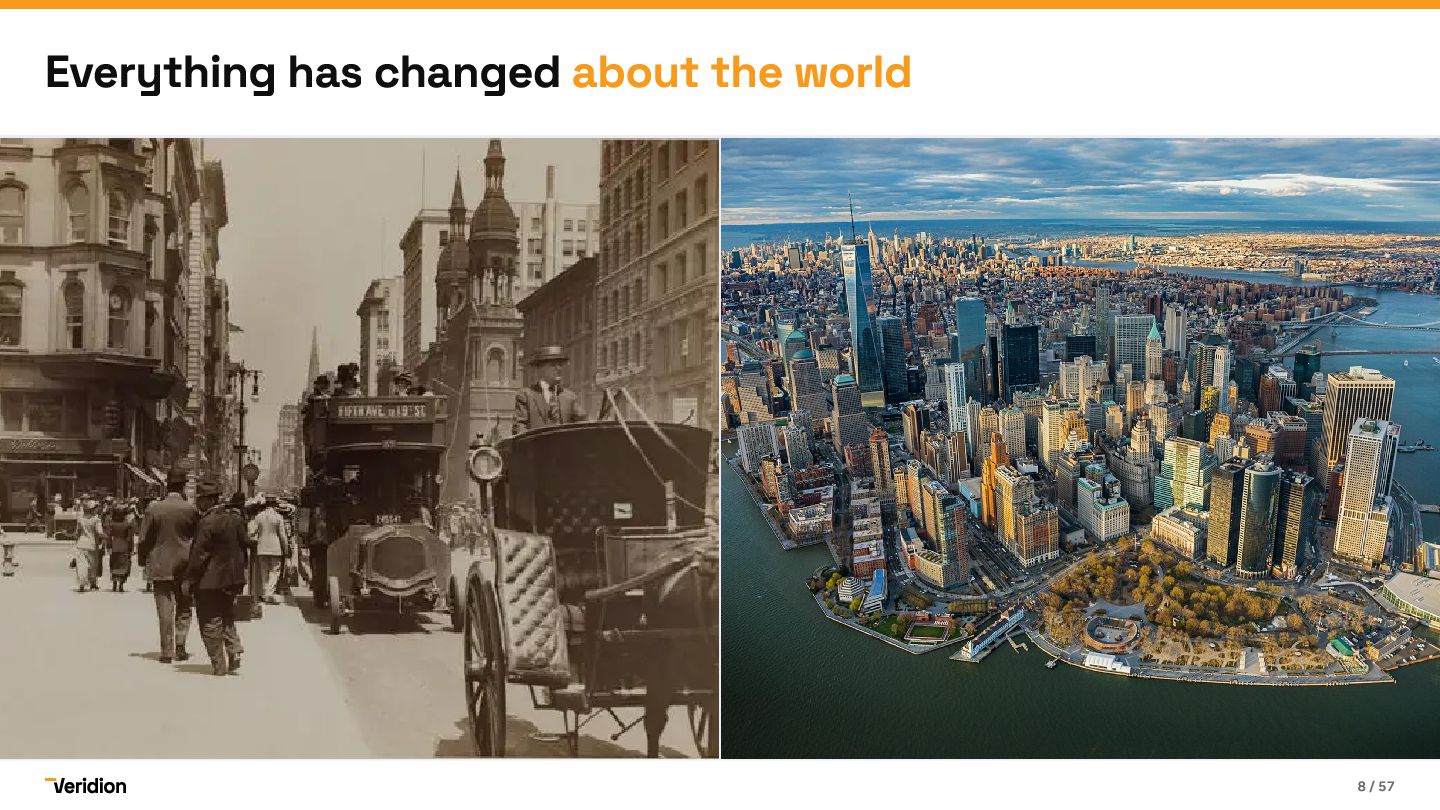
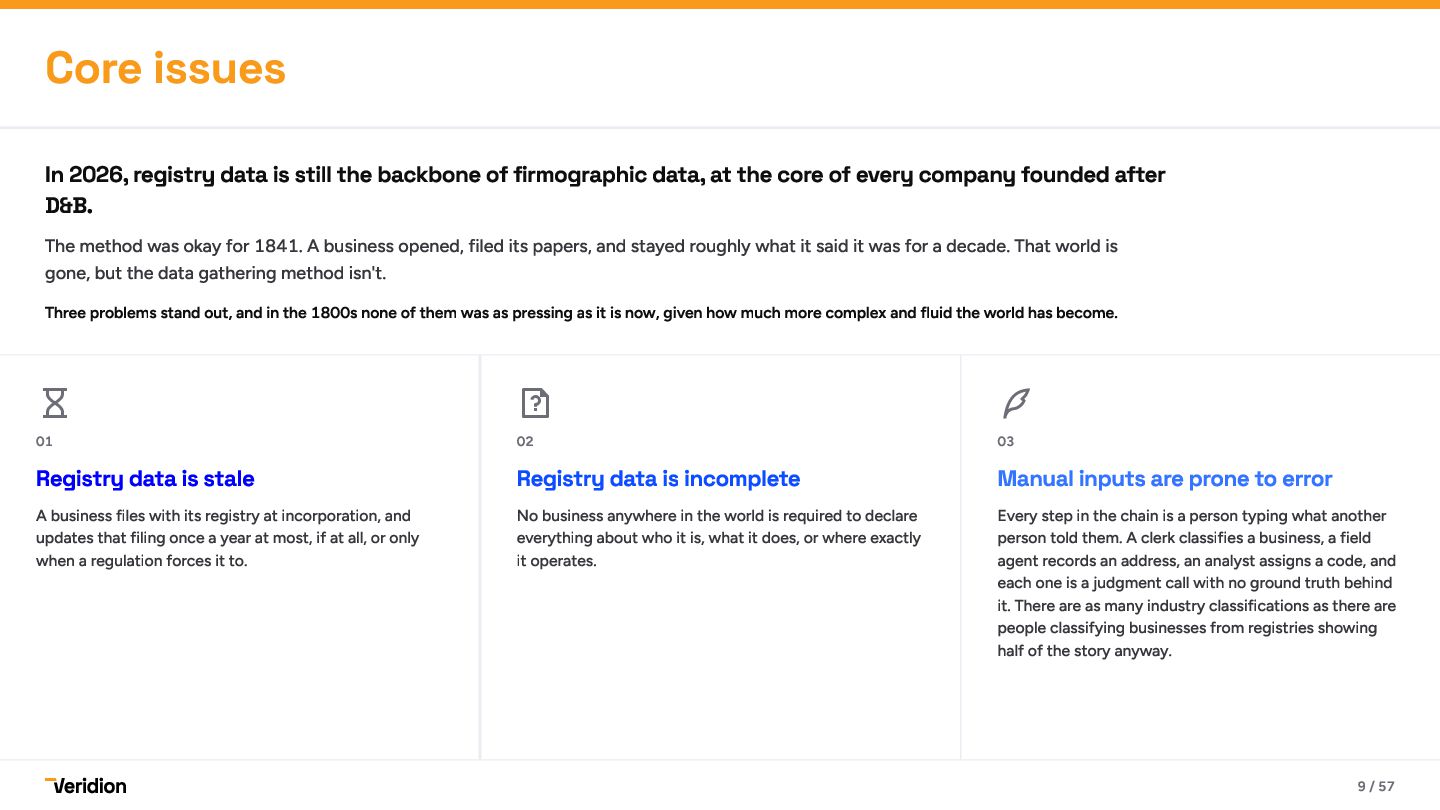
    of firmographic data, at the core of every company founded after D&B. The method was okay for 1841. A business opened, filed its papers, and stayed roughly what it said it was for a decade. That world is gone, but the data gathering method isn't. Three problems stand out, and in the 1800s none of them was as pressing as it is now, given how much more complex and fluid the world has become.    01 02 03 A business files with its registry at incorporation, and updates that filing once a year at most, if at all, or only when a regulation forces it to. No business anywhere in the world is required to declare everything about who it is, what it does, or where exactly it operates. Every step in the chain is a person typing what another person told them. A clerk classifies a business, a field agent records an address, an analyst assigns a code, and each one is a judgment call with no ground truth behind it. There are as many industry classifications as there are people classifying businesses from registries showing half of the story anyway. Registry data is stale Registry data is incomplete Manual inputs are prone to error 9 / 57
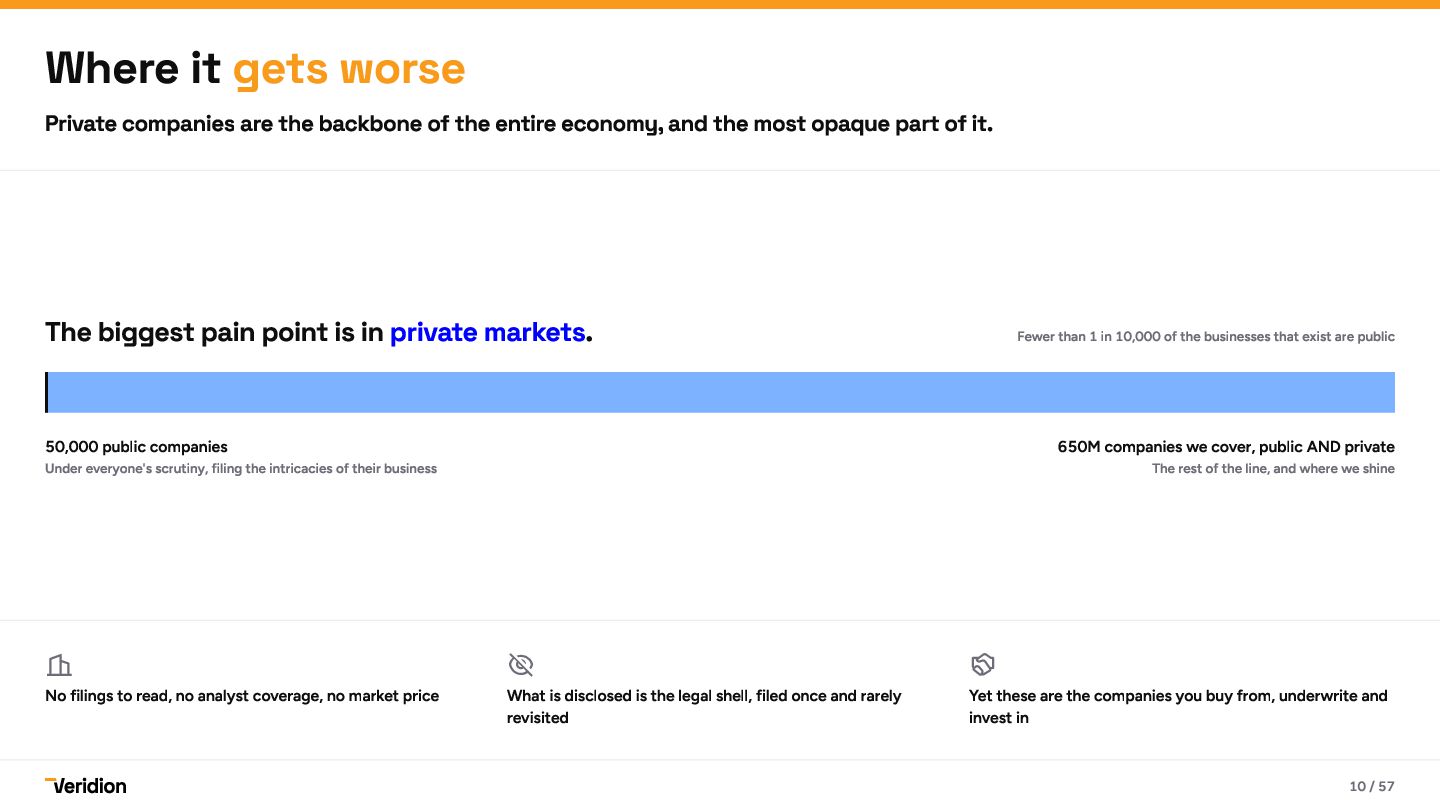
  7. Where it gets worse Private companies are the backbone of

    the entire economy, and the most opaque part of it. The biggest pain point is in private markets. Fewer than 1 in 10,000 of the businesses that exist are public 50,000 public companies 650M companies we cover, public AND private Under everyone's scrutiny, filing the intricacies of their business The rest of the line, and where we shine    No filings to read, no analyst coverage, no market price What is disclosed is the legal shell, filed once and rarely revisited Yet these are the companies you buy from, underwrite and invest in 10 / 57
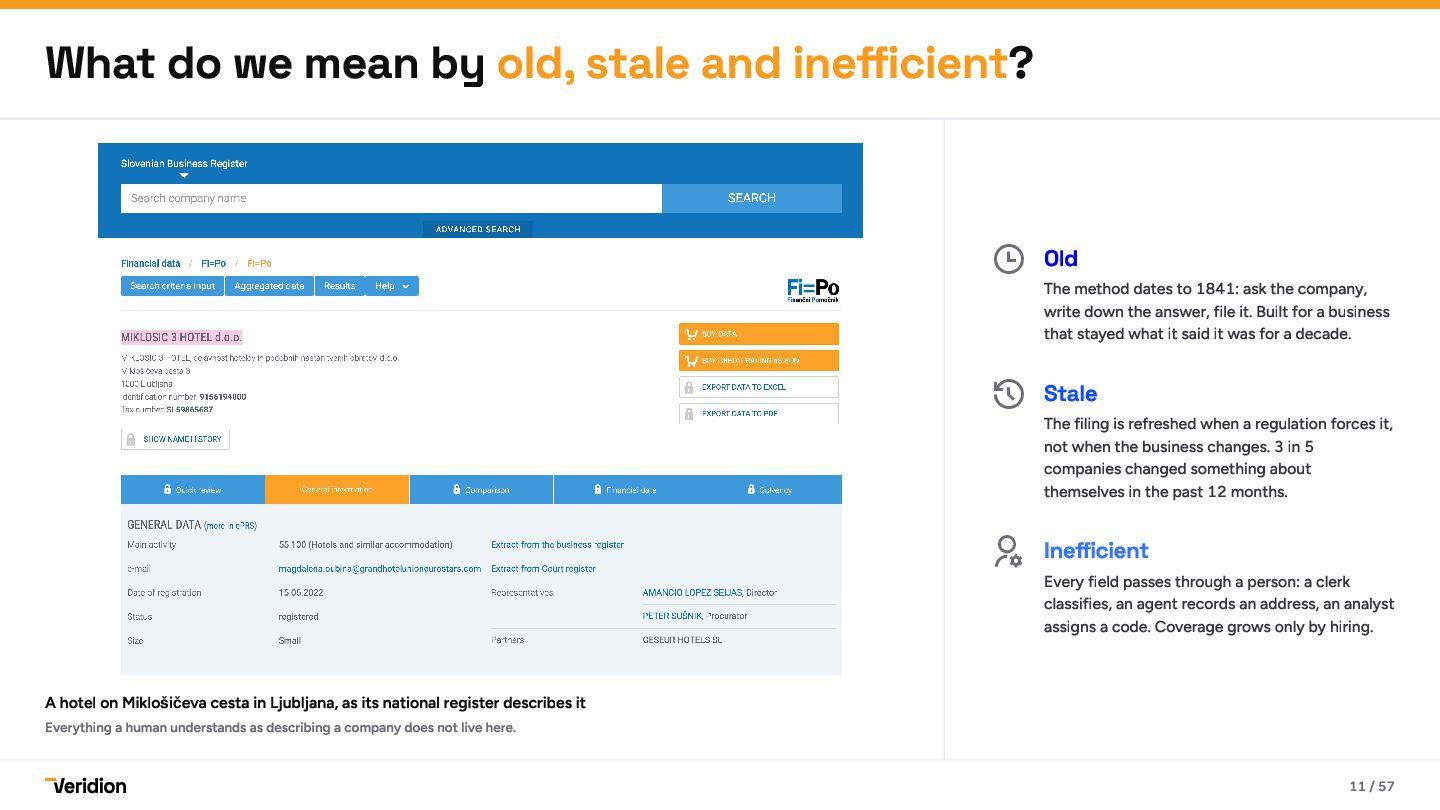
  8. What do we mean by old, stale and inefficient? 

    Old The method dates to 1841: ask the company, write down the answer, file it. Built for a business that stayed what it said it was for a decade.  Stale The filing is refreshed when a regulation forces it, not when the business changes. 3 in 5 companies changed something about themselves in the past 12 months.  Inefficient Every field passes through a person: a clerk classifies, an agent records an address, an analyst assigns a code. Coverage grows only by hiring. A hotel on Miklošičeva cesta in Ljubljana, as its national register describes it Everything a human understands as describing a company does not live here. 11 / 57
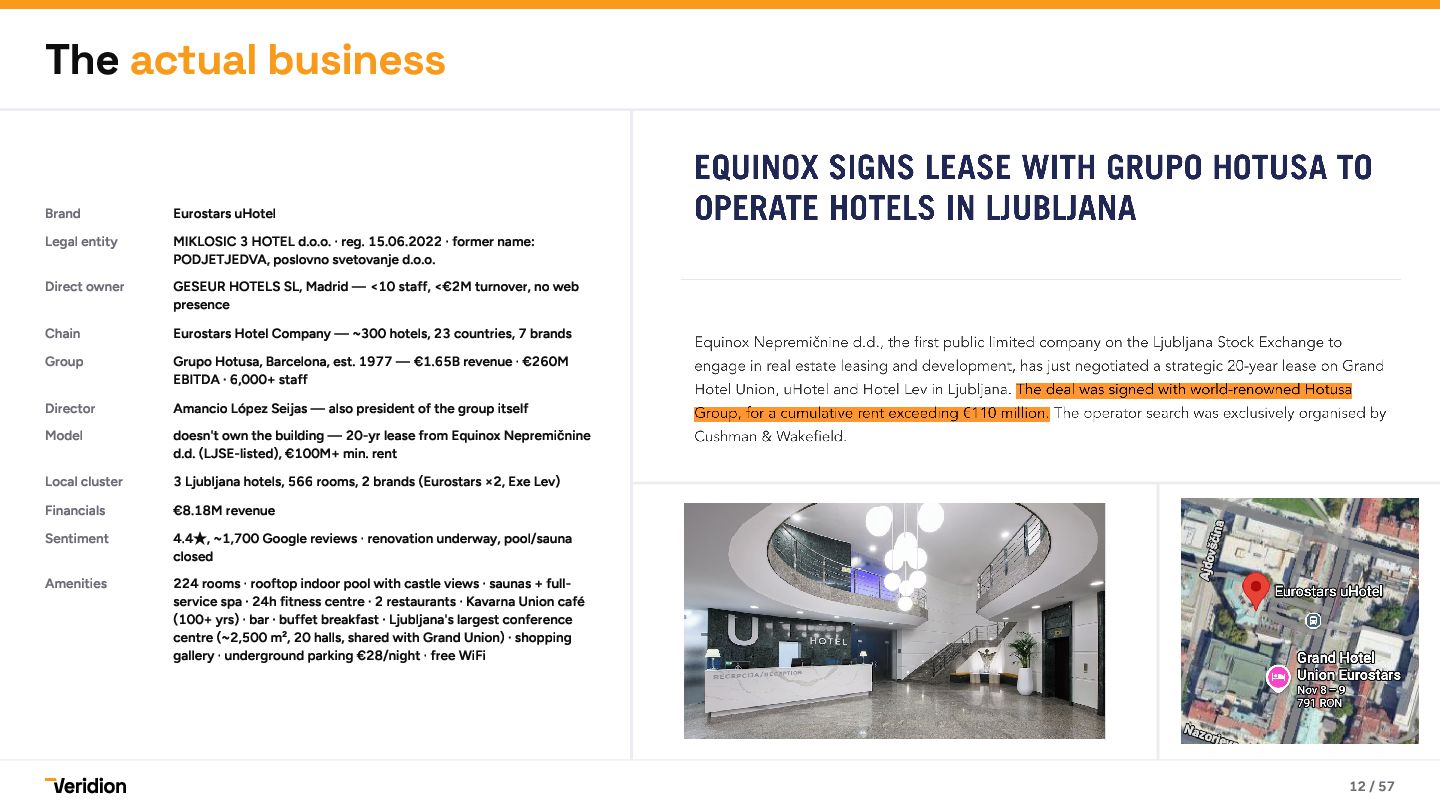
  9. The actual business Brand Legal entity Direct owner Chain Group

    Director Model Local cluster Financials Sentiment Amenities Eurostars uHotel MIKLOSIC 3 HOTEL d.o.o. · reg. 15.06.2022 · former name: PODJETJEDVA, poslovno svetovanje d.o.o. GESEUR HOTELS SL, Madrid — <10 staff, <€2M turnover, no web presence Eurostars Hotel Company — ~300 hotels, 23 countries, 7 brands Grupo Hotusa, Barcelona, est. 1977 — €1.65B revenue · €260M EBITDA · 6,000+ staff Amancio López Seijas — also president of the group itself doesn't own the building — 20-yr lease from Equinox Nepremičnine d.d. (LJSE-listed), €100M+ min. rent 3 Ljubljana hotels, 566 rooms, 2 brands (Eurostars ×2, Exe Lev) €8.18M revenue 4.4★, ~1,700 Google reviews · renovation underway, pool/sauna closed 224 rooms · rooftop indoor pool with castle views · saunas + fullservice spa · 24h fitness centre · 2 restaurants · Kavarna Union café (100+ yrs) · bar · buffet breakfast · Ljubljana's largest conference centre (~2,500 m², 20 halls, shared with Grand Union) · shopping gallery · underground parking €28/night · free WiFi 12 / 57
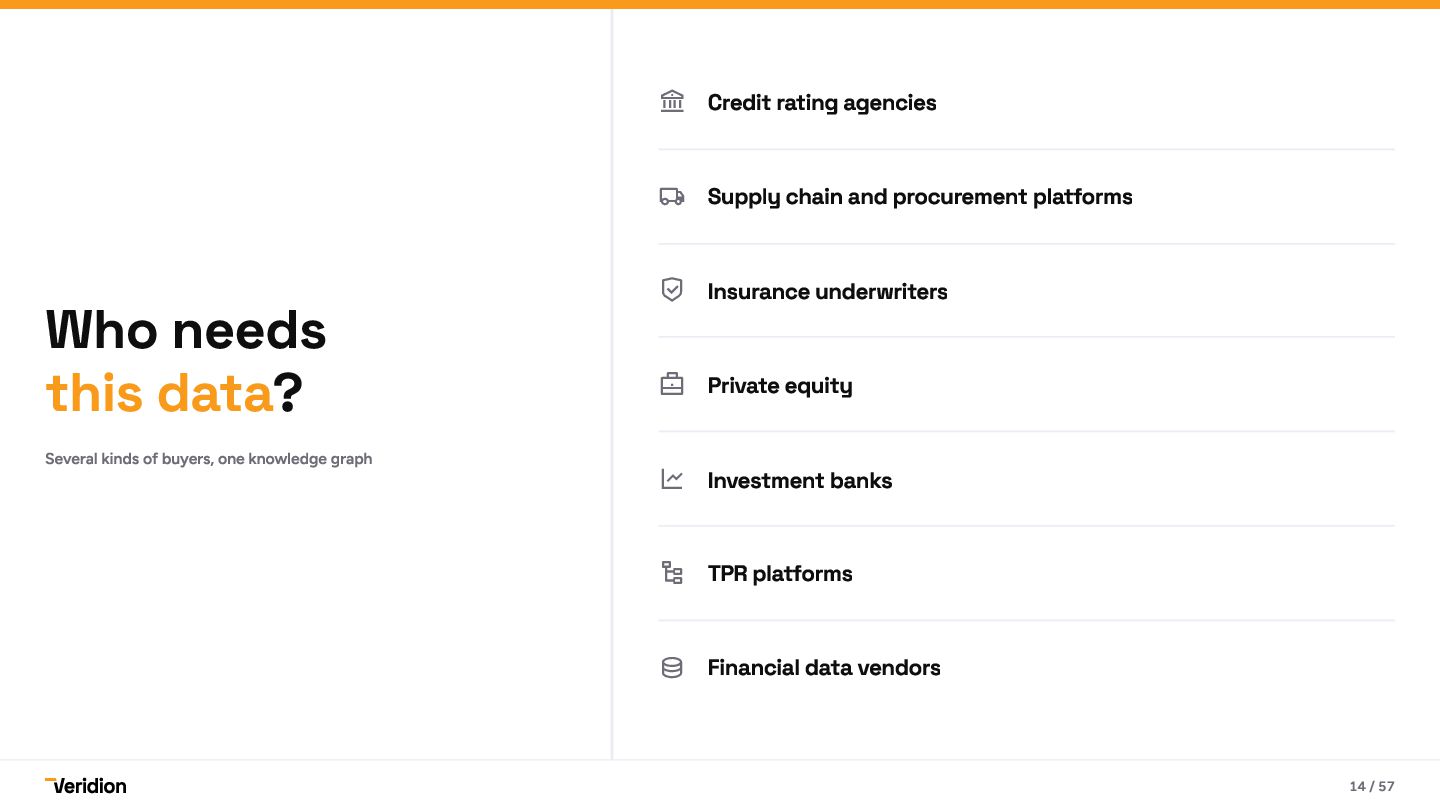
  10. Who needs this data? Several kinds of buyers, one knowledge

    graph  Credit rating agencies  Supply chain and procurement platforms  Insurance underwriters  Private equity  Investment banks  TPR platforms  Financial data vendors 14 / 57
  11. About us Who builds the graph, and how the company

    got here. 01 Hello, world! The team and the founders 02 The backstory Prospecting by hand, and the question that followed 03 Soleadify → Veridion The rename, from veritas 04 Our growth Funding, revenue and the customers 15 / 57
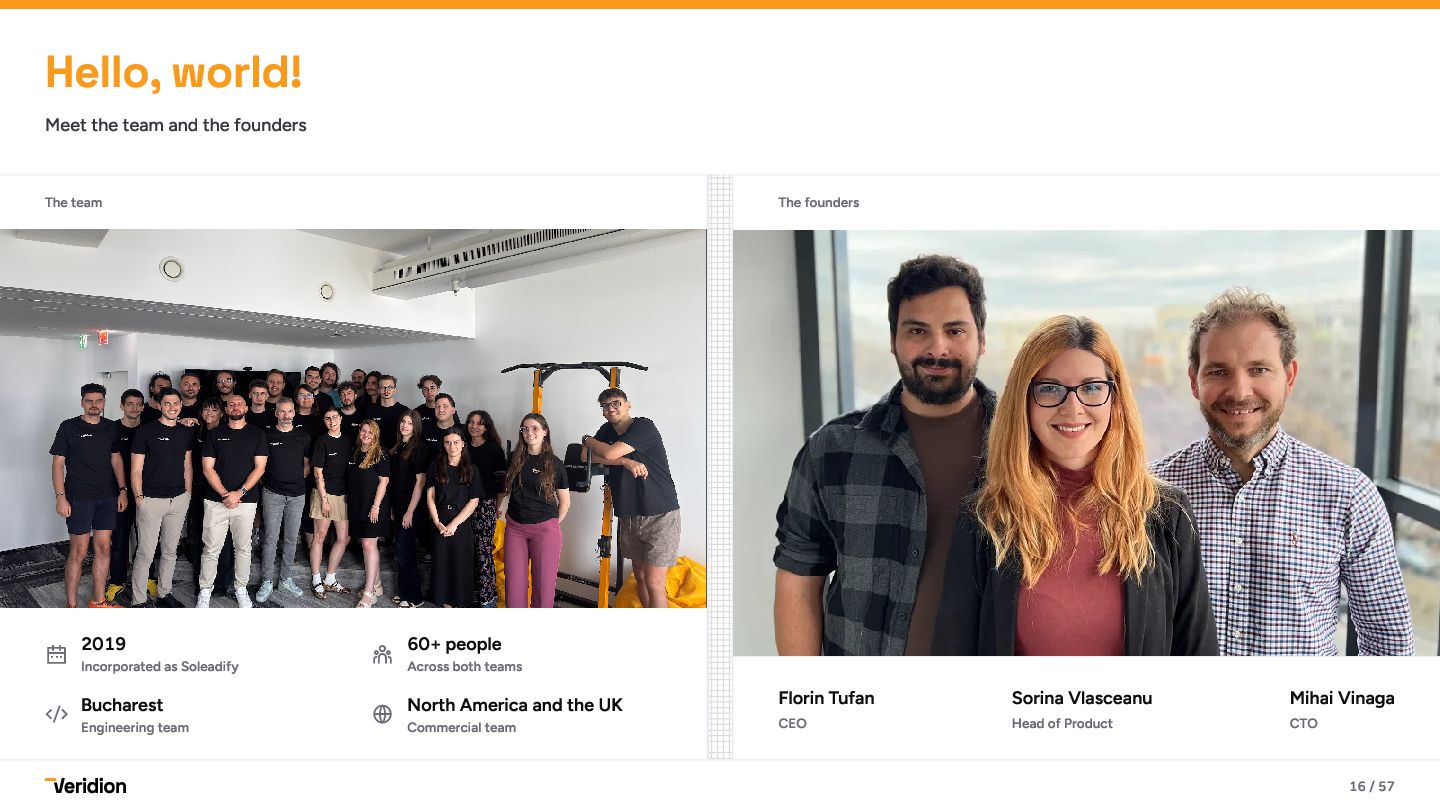
  12. Hello, world! Meet the team and the founders The team

    2019 The founders 60+ people  Incorporated as Soleadify  Across both teams  Bucharest Engineering team America and the UK  North Commercial team Florin Tufan CEO Sorina Vlasceanu Head of Product Mihai Vinaga CTO 16 / 57
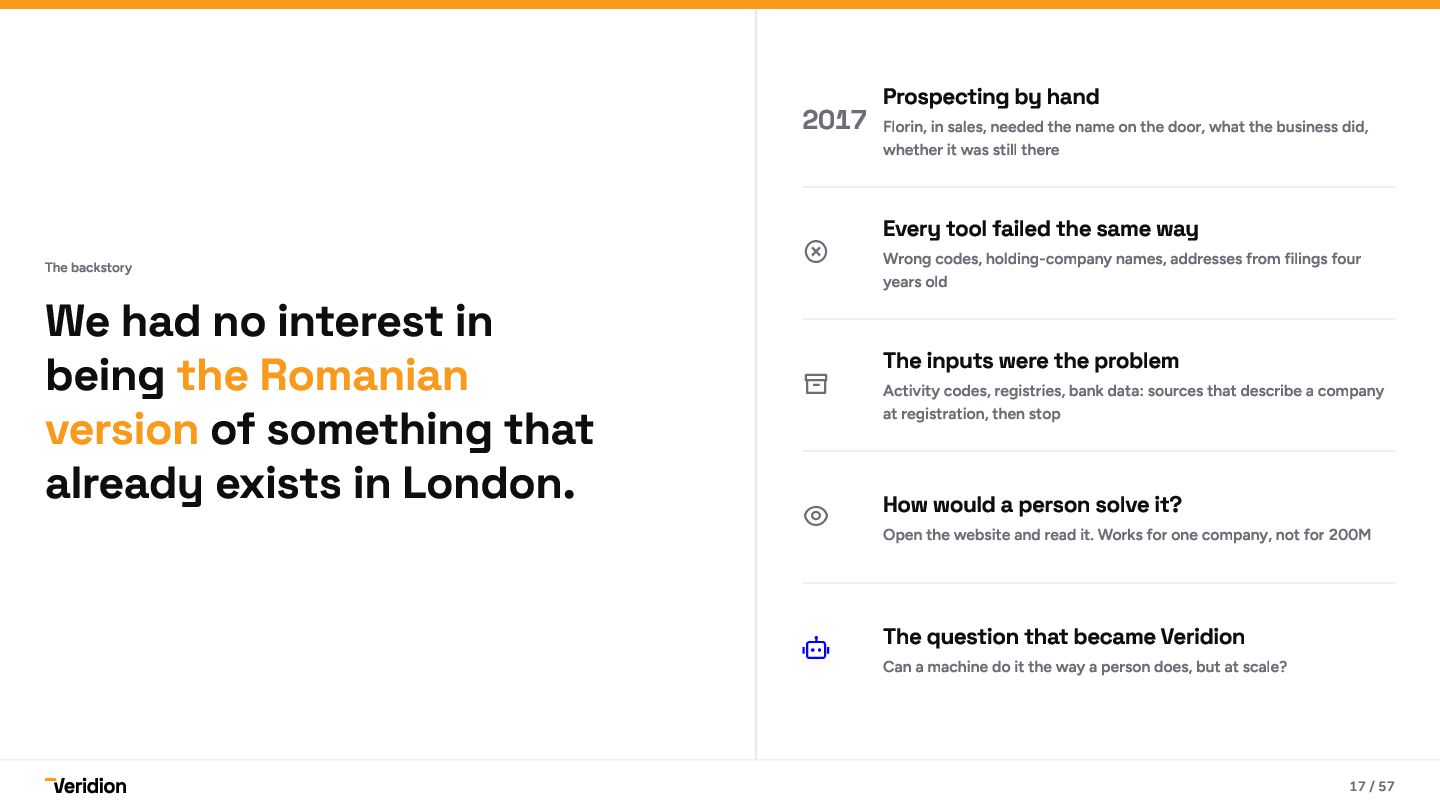
  13. Prospecting by hand 2017 Florin, in sales, needed the name

    on the door, what the business did, whether it was still there The backstory We had no interest in being the Romanian version of something that already exists in London.   Every tool failed the same way Wrong codes, holding-company names, addresses from filings four years old The inputs were the problem Activity codes, registries, bank data: sources that describe a company at registration, then stop  How would a person solve it?  The question that became Veridion Open the website and read it. Works for one company, not for 200M Can a machine do it the way a person does, but at scale? 17 / 57
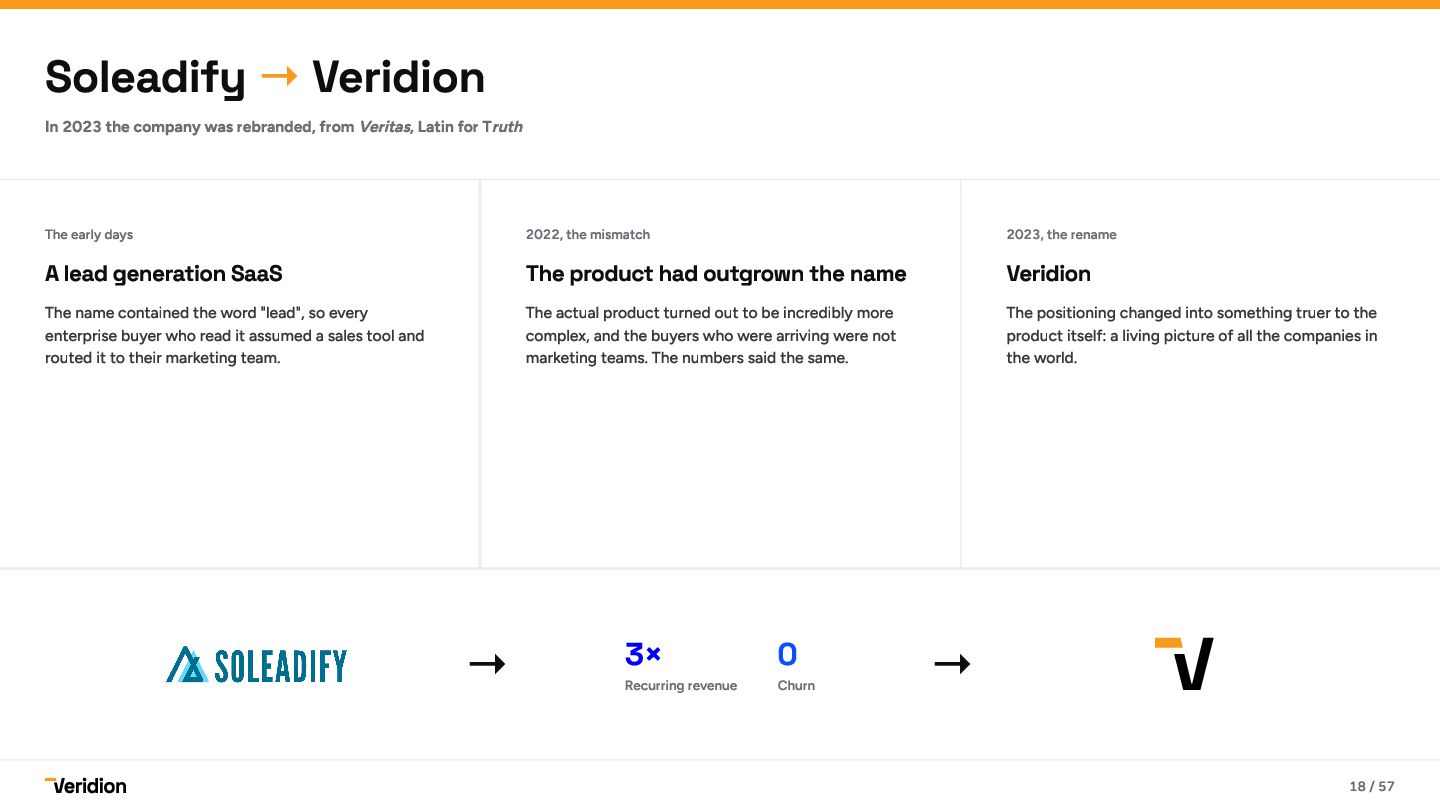
  14. Soleadify → Veridion In 2023 the company was rebranded, from

    Veritas, Latin for Truth The early days 2022, the mismatch 2023, the rename The name contained the word "lead", so every enterprise buyer who read it assumed a sales tool and routed it to their marketing team. The actual product turned out to be incredibly more complex, and the buyers who were arriving were not marketing teams. The numbers said the same. The positioning changed into something truer to the product itself: a living picture of all the companies in the world. A lead generation SaaS The product had outgrown the name → 3× Recurring revenue 0 Churn Veridion → 18 / 57
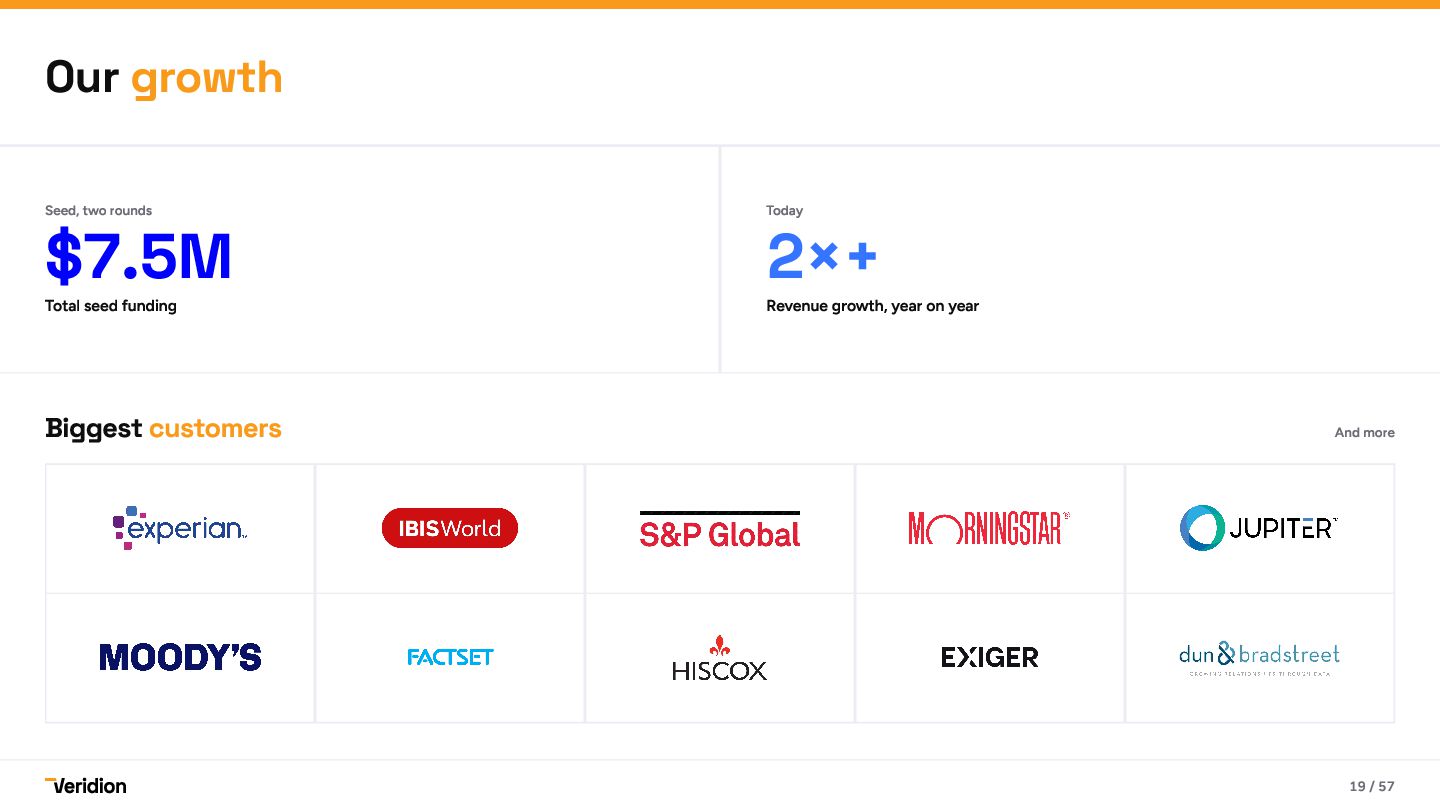
  15. Our growth $7.5M 2×+ Seed, two rounds Today Total seed

    funding Revenue growth, year on year Biggest customers And more 19 / 57
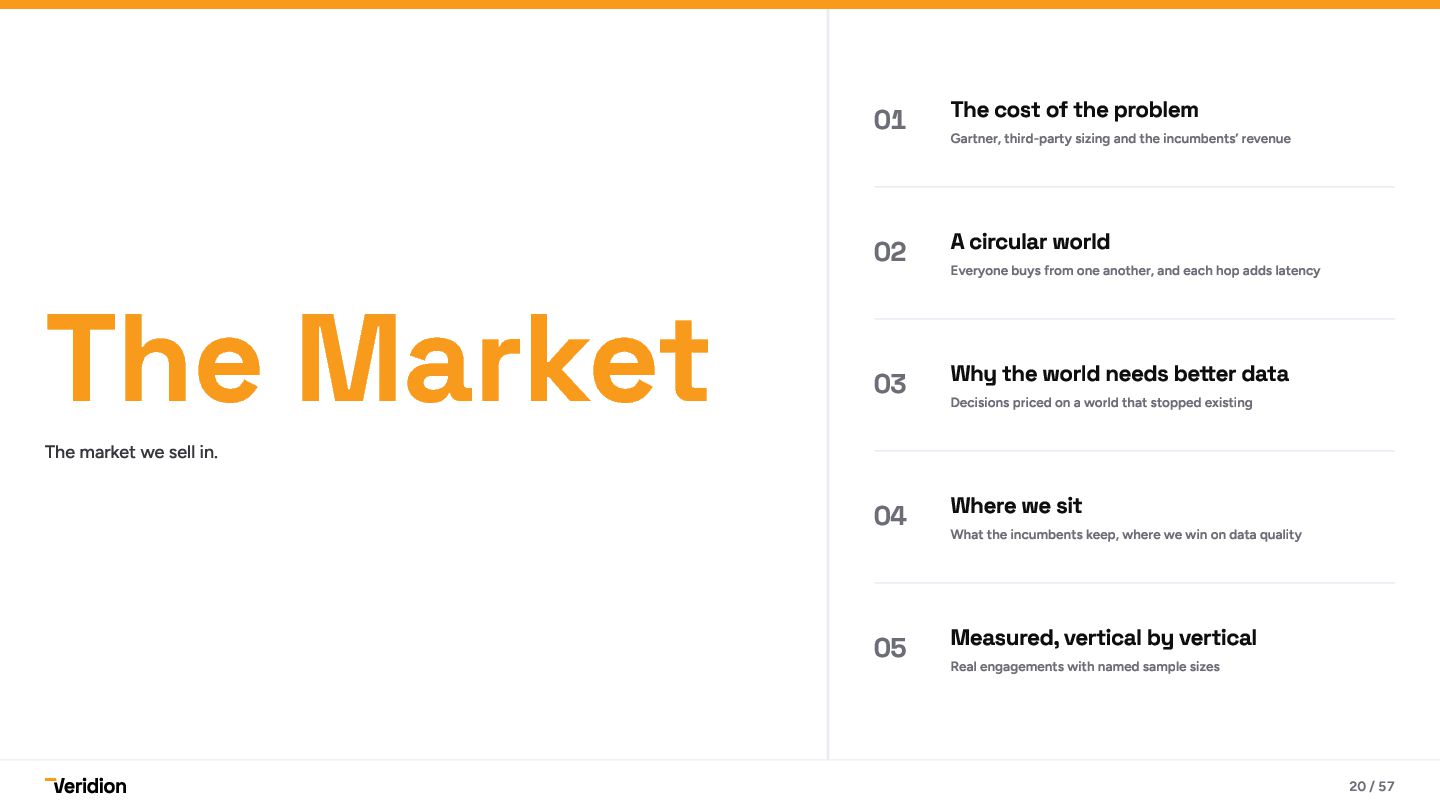
  16. 01 The cost of the problem Gartner, third-party sizing and

    the incumbents’ revenue The Market 02 A circular world Everyone buys from one another, and each hop adds latency 03 Why the world needs better data Decisions priced on a world that stopped existing The market we sell in. 04 Where we sit What the incumbents keep, where we win on data quality 05 Measured, vertical by vertical Real engagements with named sample sizes 20 / 57
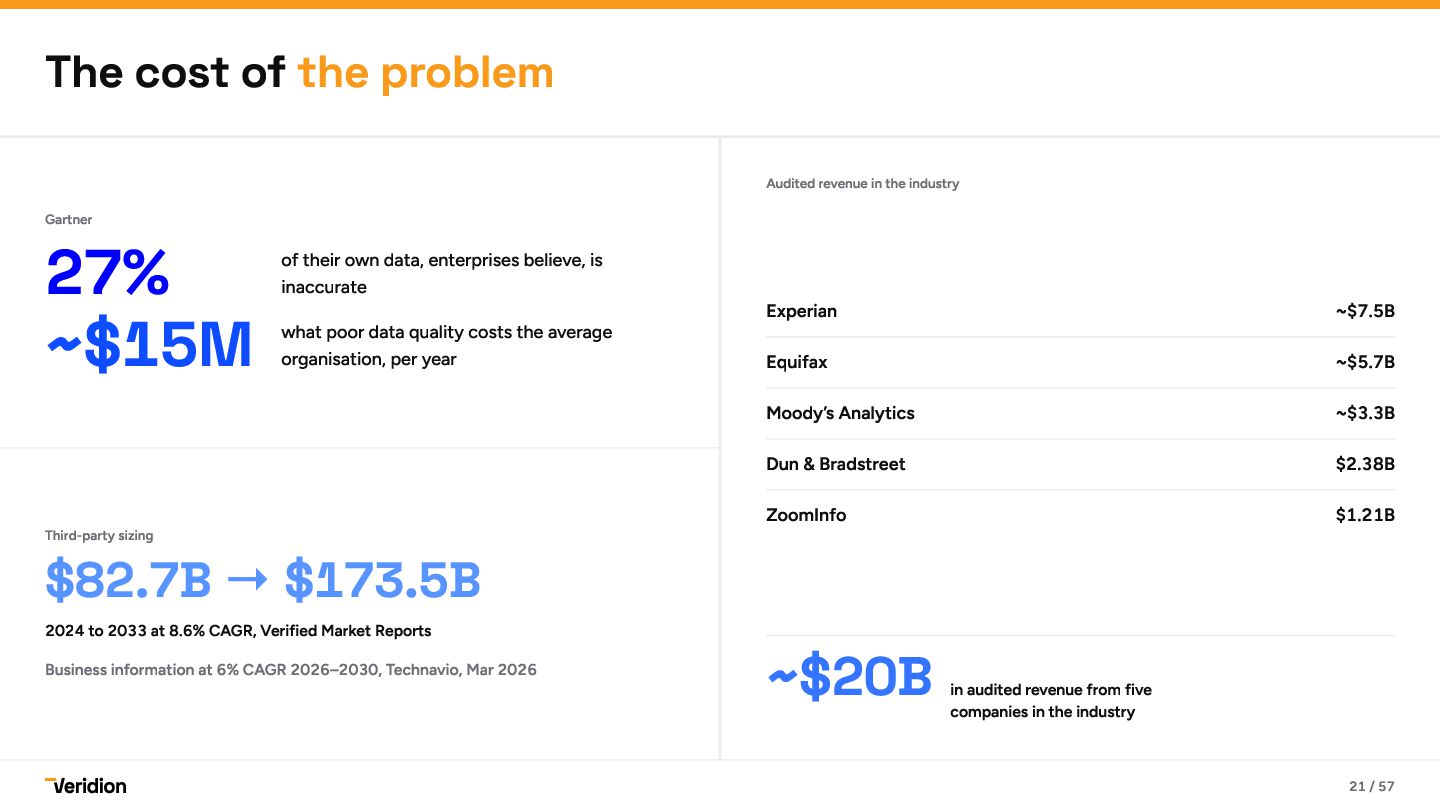
  17. The cost of the problem 27% ~$15M Audited revenue in

    the industry Gartner of their own data, enterprises believe, is inaccurate what poor data quality costs the average organisation, per year $82.7B → $173.5B Third-party sizing 2024 to 2033 at 8.6% CAGR, Verified Market Reports Business information at 6% CAGR 2026–2030, Technavio, Mar 2026 Experian ~$7.5B Equifax ~$5.7B Moody’s Analytics ~$3.3B Dun & Bradstreet $2.38B ZoomInfo $1.21B ~$20B in audited revenue from five companies in the industry 21 / 57
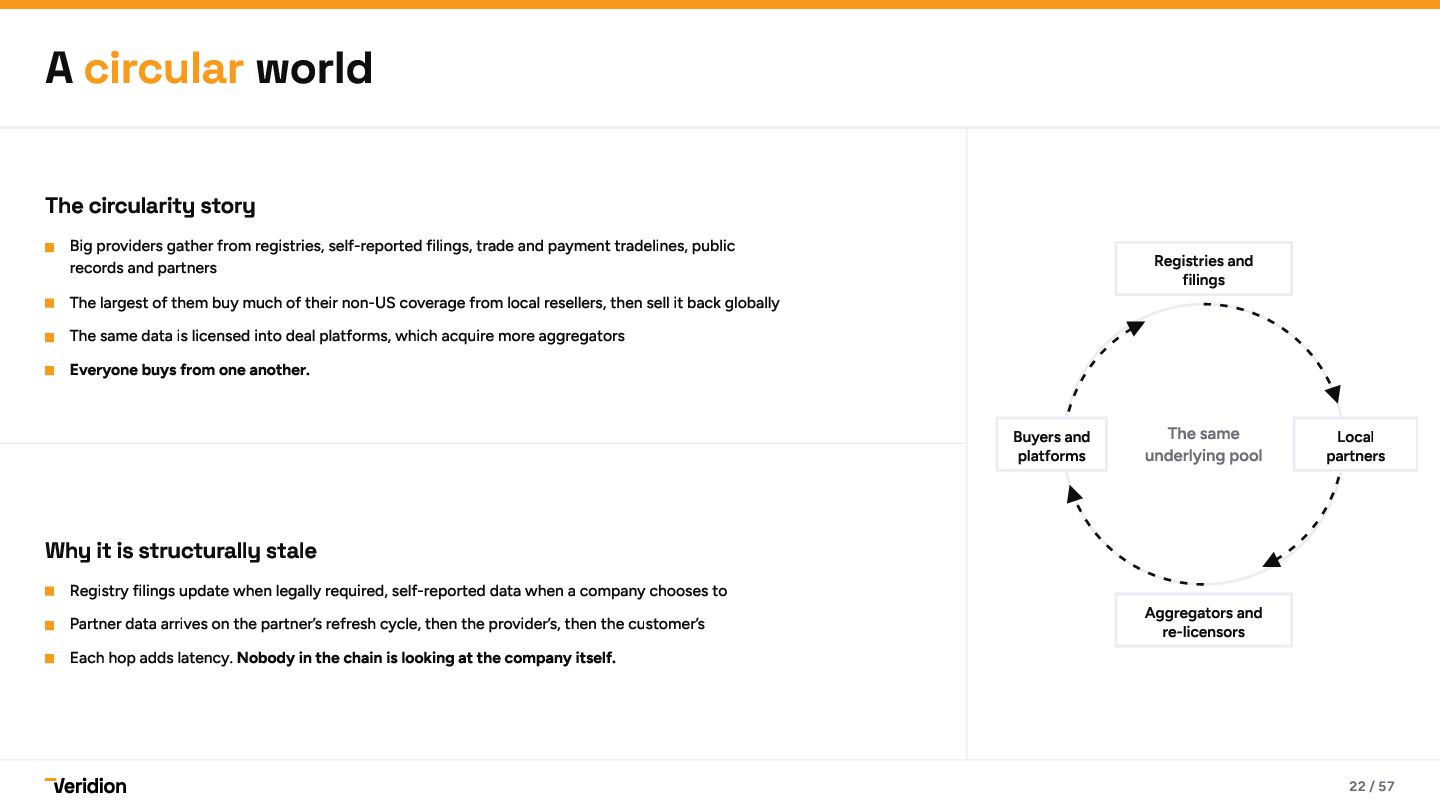
  18. A circular world The circularity story Big providers gather from

    registries, self-reported filings, trade and payment tradelines, public records and partners Registries and filings The largest of them buy much of their non-US coverage from local resellers, then sell it back globally The same data is licensed into deal platforms, which acquire more aggregators Everyone buys from one another. Buyers and platforms The same underlying pool Local partners Why it is structurally stale Registry filings update when legally required, self-reported data when a company chooses to Partner data arrives on the partner’s refresh cycle, then the provider’s, then the customer’s Each hop adds latency. Nobody in the chain is looking at the company itself. Aggregators and re-licensors 22 / 57
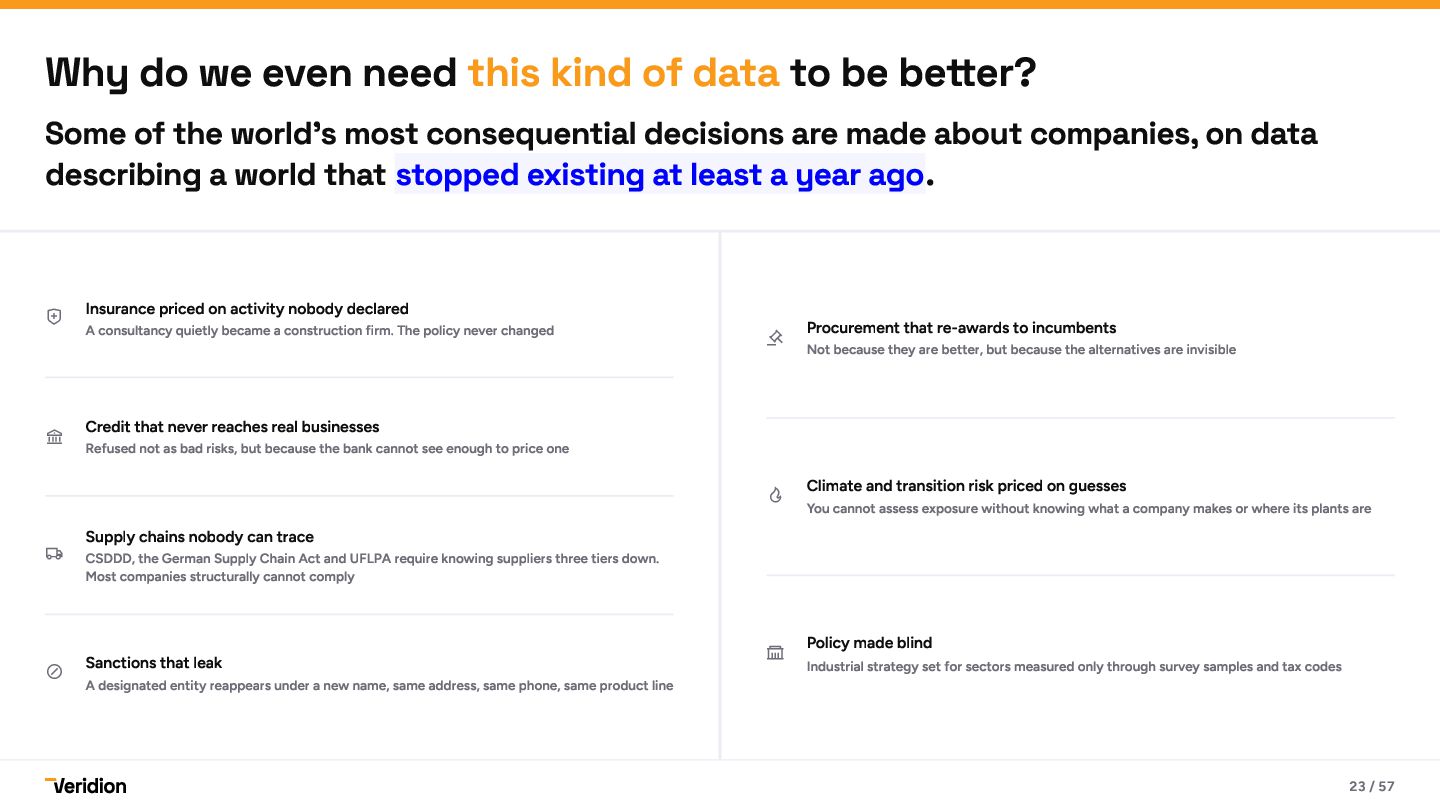
  19. Why do we even need this kind of data to

    be better? Some of the world's most consequential decisions are made about companies, on data describing a world that stopped existing at least a year ago.    Insurance priced on activity nobody declared A consultancy quietly became a construction firm. The policy never changed  Procurement that re-awards to incumbents  Climate and transition risk priced on guesses  Policy made blind Not because they are better, but because the alternatives are invisible Credit that never reaches real businesses Refused not as bad risks, but because the bank cannot see enough to price one You cannot assess exposure without knowing what a company makes or where its plants are Supply chains nobody can trace CSDDD, the German Supply Chain Act and UFLPA require knowing suppliers three tiers down. Most companies structurally cannot comply Sanctions that leak  A designated entity reappears under a new name, same address, same phone, same product line Industrial strategy set for sectors measured only through survey samples and tax codes 23 / 57
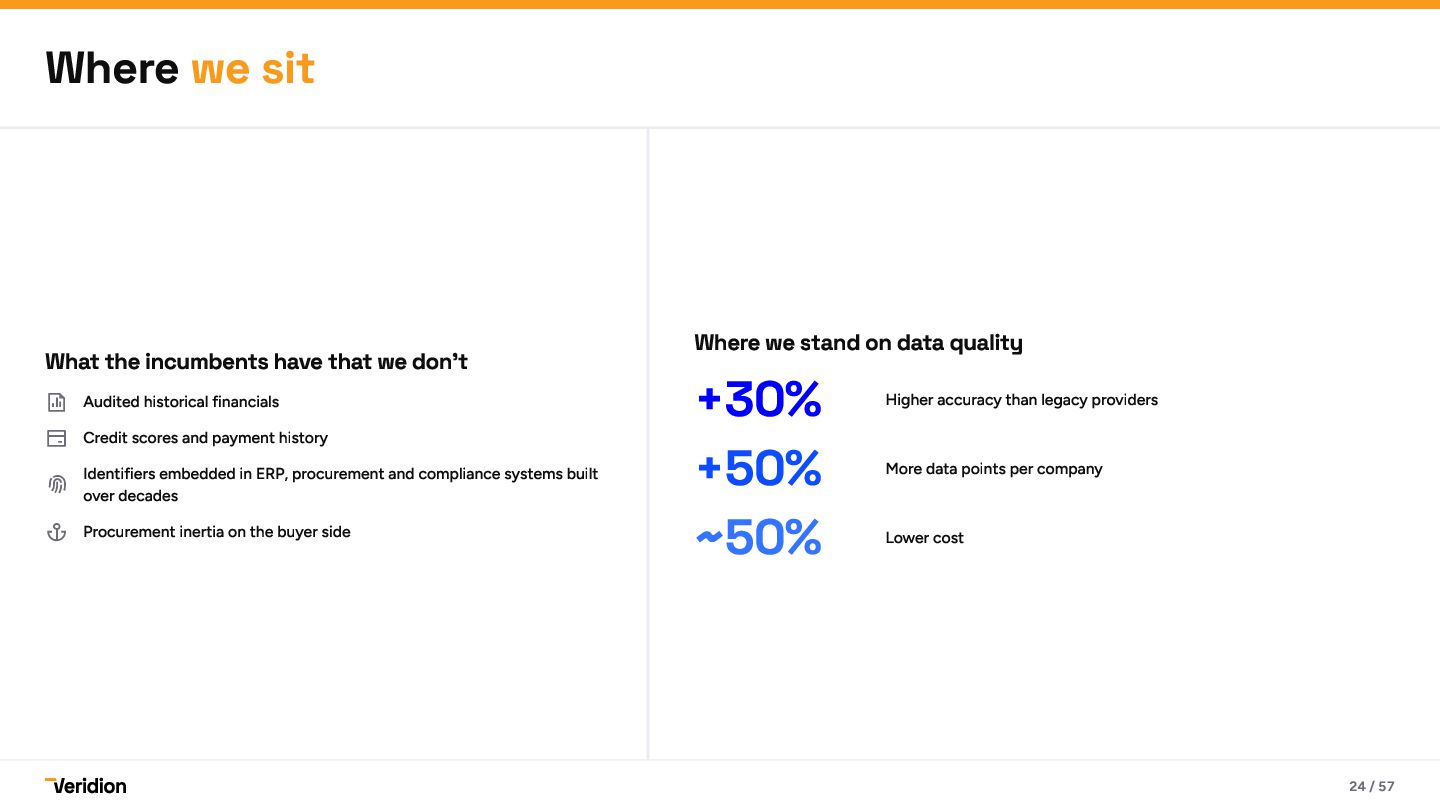
  20. Where we sit What the incumbents have that we don’t

     Audited historical financials  Credit scores and payment history Identifiers embedded in ERP, procurement and compliance systems built  over decades  Procurement inertia on the buyer side Where we stand on data quality +30% +50% ~50% Higher accuracy than legacy providers More data points per company Lower cost 24 / 57
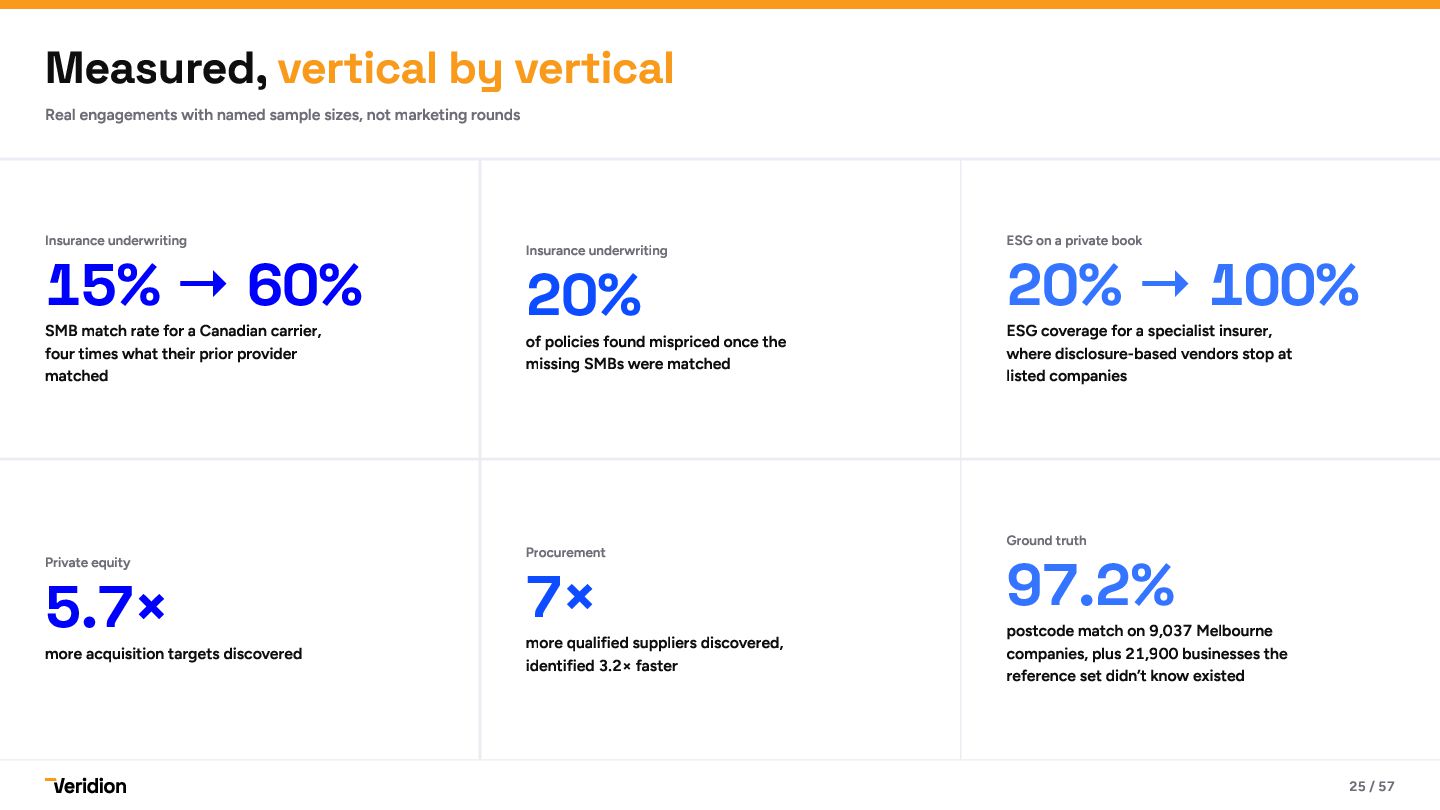
  21. Measured, vertical by vertical Real engagements with named sample sizes,

    not marketing rounds 15% → 60% Insurance underwriting SMB match rate for a Canadian carrier, four times what their prior provider matched 5.7× Private equity more acquisition targets discovered 20% Insurance underwriting of policies found mispriced once the missing SMBs were matched 7× Procurement more qualified suppliers discovered, identified 3.2× faster 20% → 100% ESG on a private book ESG coverage for a specialist insurer, where disclosure-based vendors stop at listed companies 97.2% Ground truth postcode match on 9,037 Melbourne companies, plus 21,900 businesses the reference set didn’t know existed 25 / 57
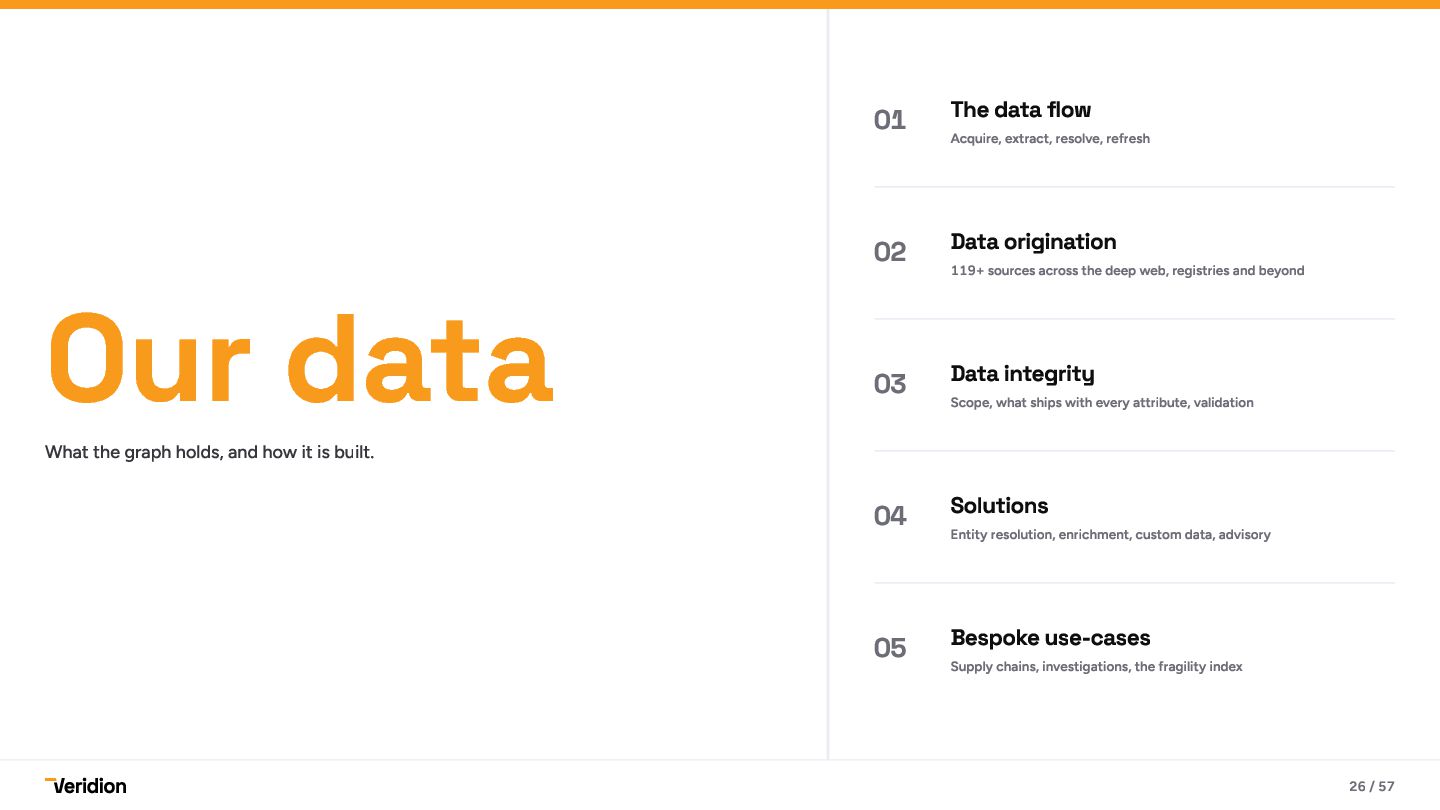
  22. 01 The data flow Acquire, extract, resolve, refresh Our data

    02 Data origination 119+ sources across the deep web, registries and beyond 03 Data integrity Scope, what ships with every attribute, validation What the graph holds, and how it is built. 04 Solutions Entity resolution, enrichment, custom data, advisory 05 Bespoke use-cases Supply chains, investigations, the fragility index 26 / 57
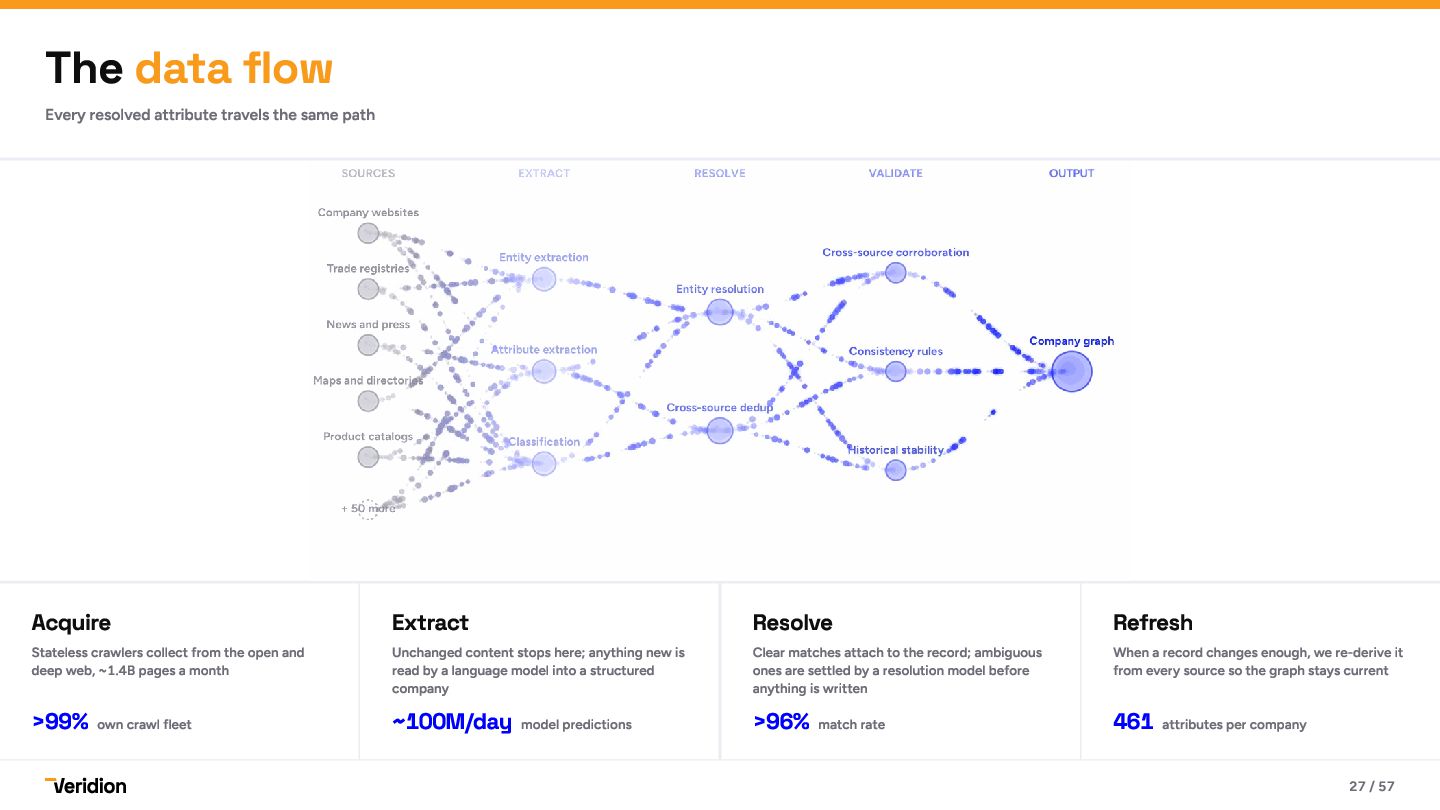
  23. The data flow Every resolved attribute travels the same path

    Acquire Extract Resolve Refresh >99% own crawl fleet ~100M/day model predictions >96% match rate 461 attributes per company Stateless crawlers collect from the open and deep web, ~1.4B pages a month Unchanged content stops here; anything new is read by a language model into a structured company Clear matches attach to the record; ambiguous ones are settled by a resolution model before anything is written When a record changes enough, we re-derive it from every source so the graph stays current 27 / 57
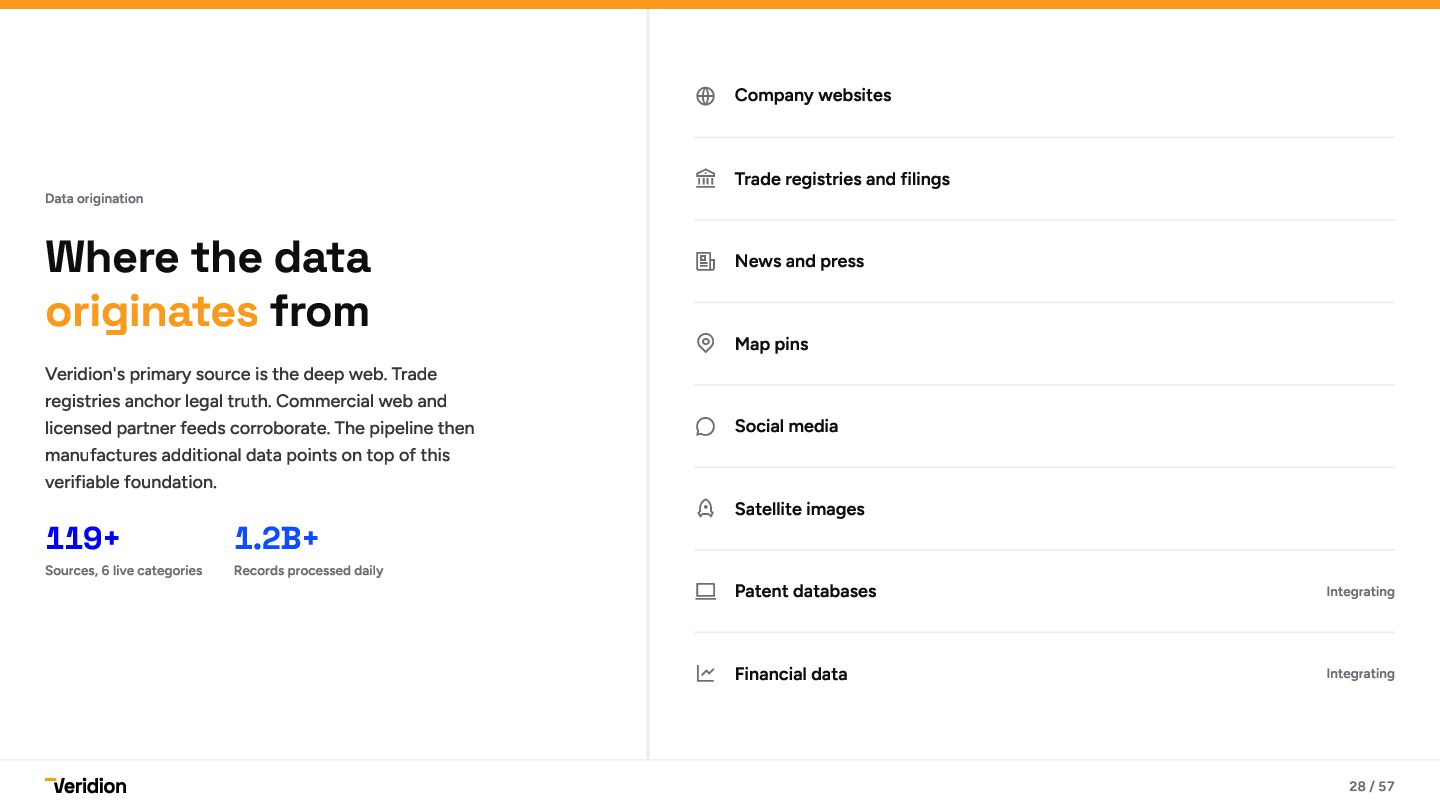
  24.  Company websites  Trade registries and filings Data origination

    Where the data originates from Veridion's primary source is the deep web. Trade registries anchor legal truth. Commercial web and licensed partner feeds corroborate. The pipeline then manufactures additional data points on top of this verifiable foundation. 119+ Sources, 6 live categories 1.2B+ Records processed daily  News and press  Map pins  Social media  Satellite images  Patent databases Integrating  Financial data Integrating 28 / 57
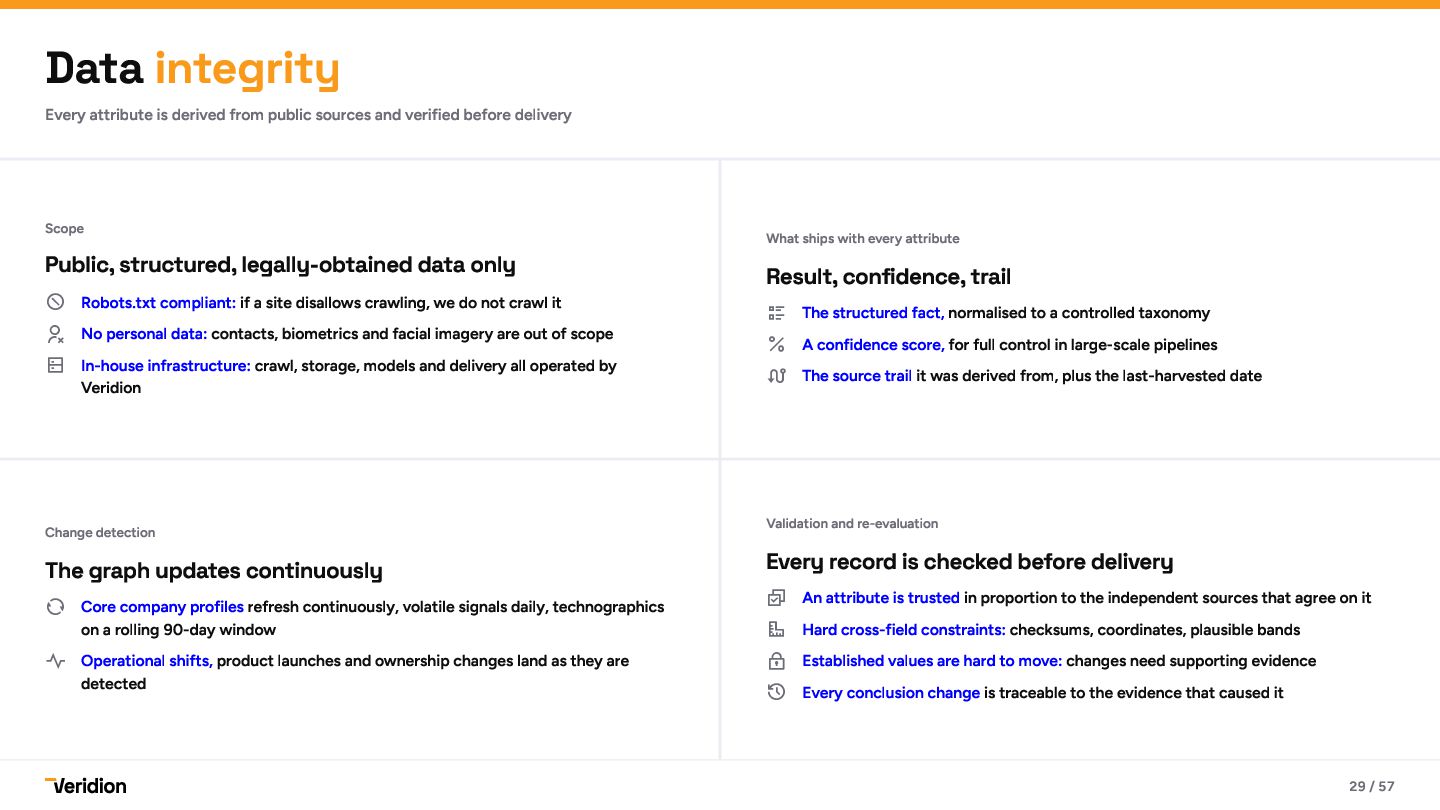
  25. Data integrity Every attribute is derived from public sources and

    verified before delivery Scope Public, structured, legally-obtained data only  Robots.txt compliant: if a site disallows crawling, we do not crawl it  No personal data: contacts, biometrics and facial imagery are out of scope  In-house infrastructure: crawl, storage, models and delivery all operated by Veridion What ships with every attribute Result, confidence, trail  The structured fact, normalised to a controlled taxonomy  A confidence score, for full control in large-scale pipelines  The source trail it was derived from, plus the last-harvested date Change detection Validation and re-evaluation  Core company profiles refresh continuously, volatile signals daily, technographics  An attribute is trusted in proportion to the independent sources that agree on it The graph updates continuously Every record is checked before delivery on a rolling 90-day window  Operational shifts, product launches and ownership changes land as they are detected  Hard cross-field constraints: checksums, coordinates, plausible bands  Established values are hard to move: changes need supporting evidence  Every conclusion change is traceable to the evidence that caused it 29 / 57
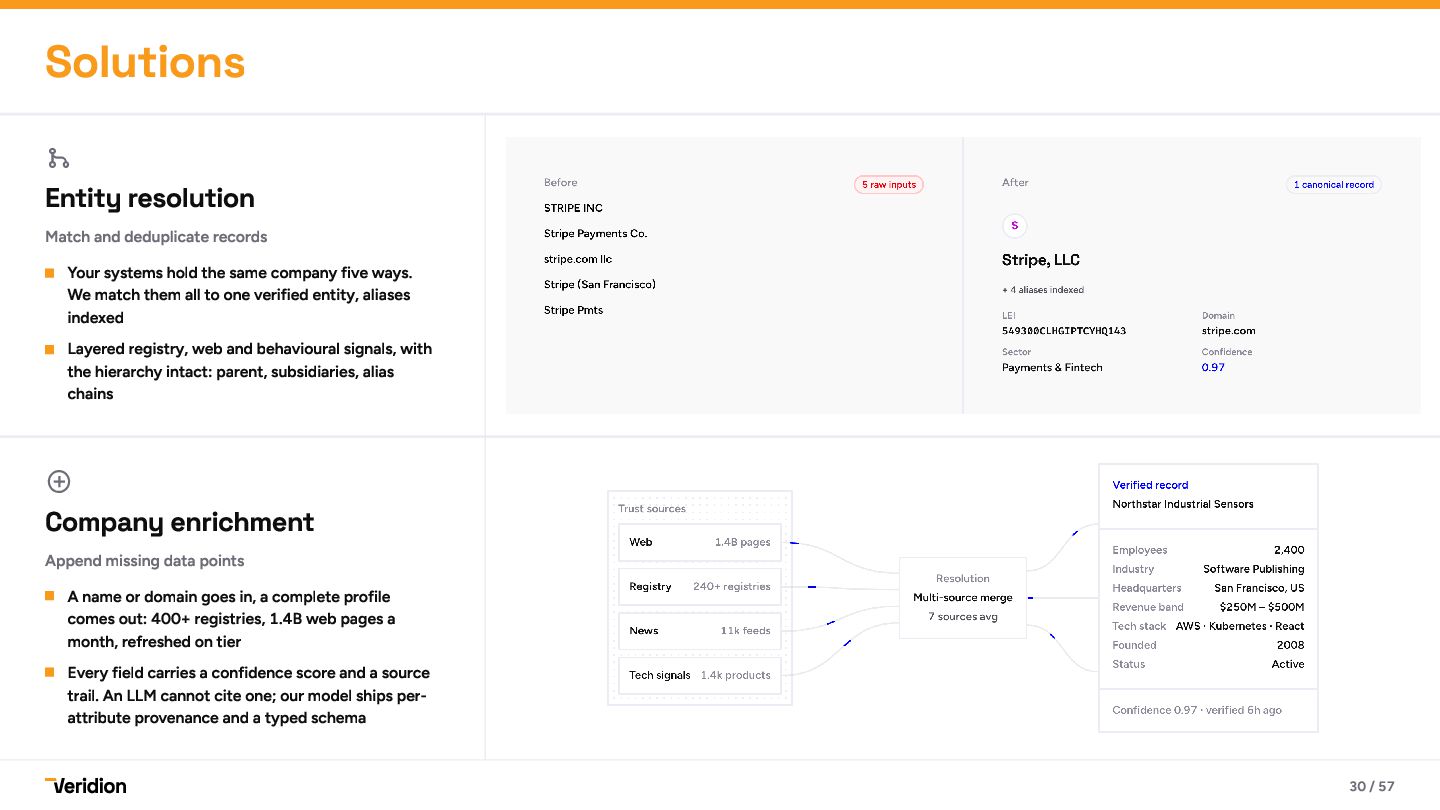
  26. Solutions  Entity resolution Match and deduplicate records Your systems

    hold the same company five ways. We match them all to one verified entity, aliases indexed Layered registry, web and behavioural signals, with the hierarchy intact: parent, subsidiaries, alias chains  Company enrichment Append missing data points A name or domain goes in, a complete profile comes out: 400+ registries, 1.4B web pages a month, refreshed on tier Every field carries a confidence score and a source trail. An LLM cannot cite one; our model ships perattribute provenance and a typed schema 30 / 57
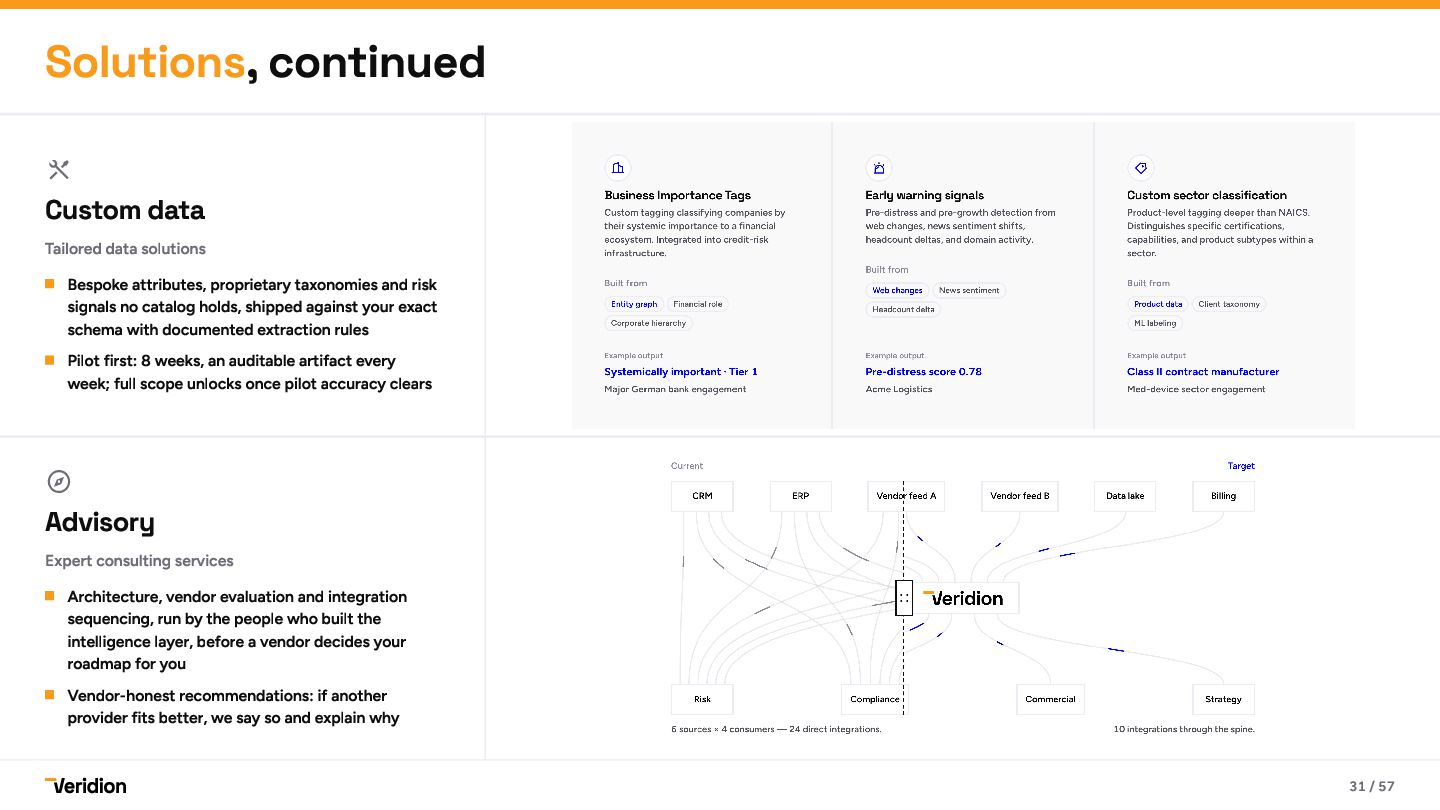
  27. Solutions, continued  Custom data Tailored data solutions Bespoke attributes,

    proprietary taxonomies and risk signals no catalog holds, shipped against your exact schema with documented extraction rules Pilot first: 8 weeks, an auditable artifact every week; full scope unlocks once pilot accuracy clears  Advisory Expert consulting services Architecture, vendor evaluation and integration sequencing, run by the people who built the intelligence layer, before a vendor decides your roadmap for you Vendor-honest recommendations: if another provider fits better, we say so and explain why 31 / 57
  28. So, what are the coolest things you can do with

    our data? Bespoke use-cases 32 / 57
  29. The global datacenter footprint, site by site Hyperscale Colocation Edge

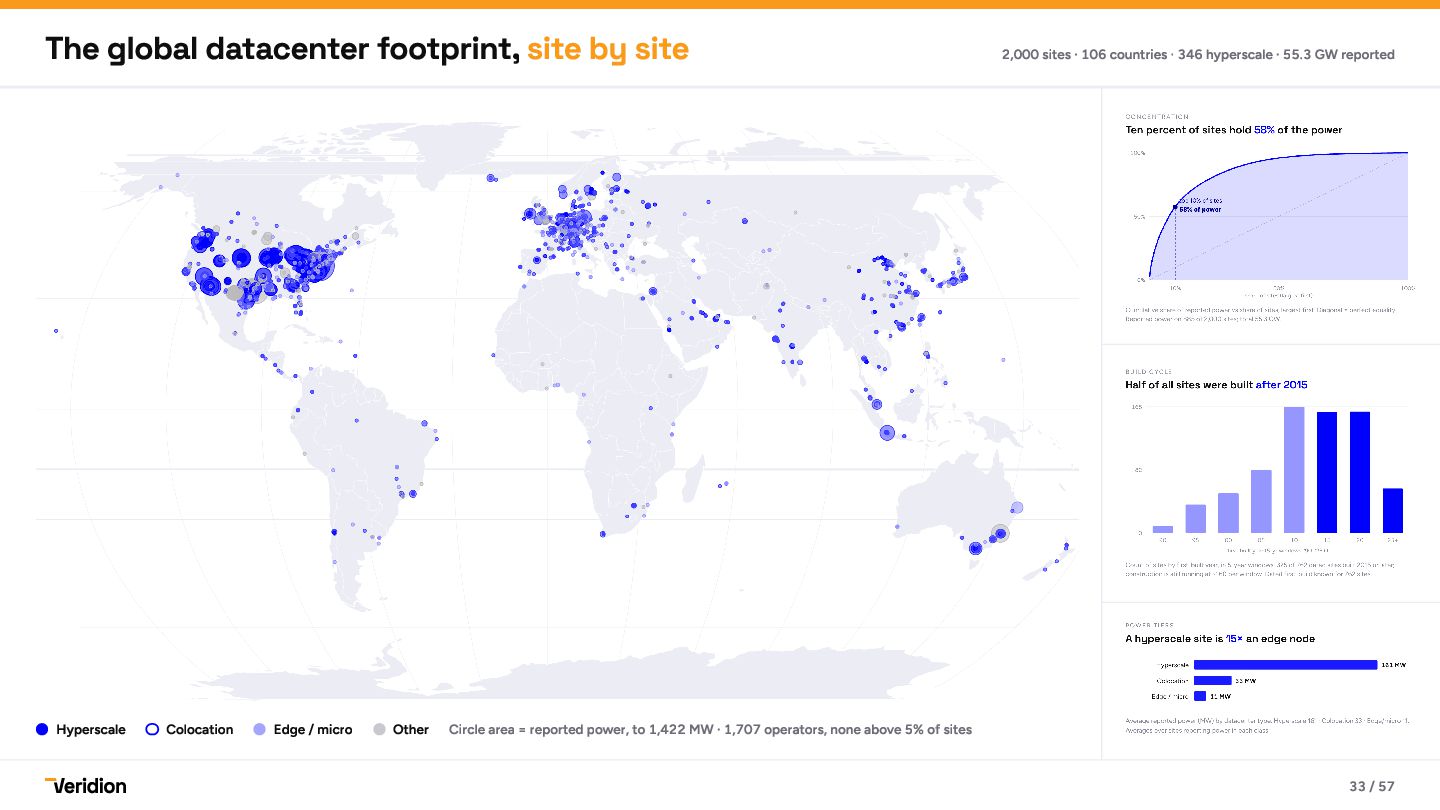
    / micro Other 2,000 sites · 106 countries · 346 hyperscale · 55.3 GW reported Circle area = reported power, to 1,422 MW · 1,707 operators, none above 5% of sites 33 / 57
  30. 119 million websites, each diffed against its own history Companies

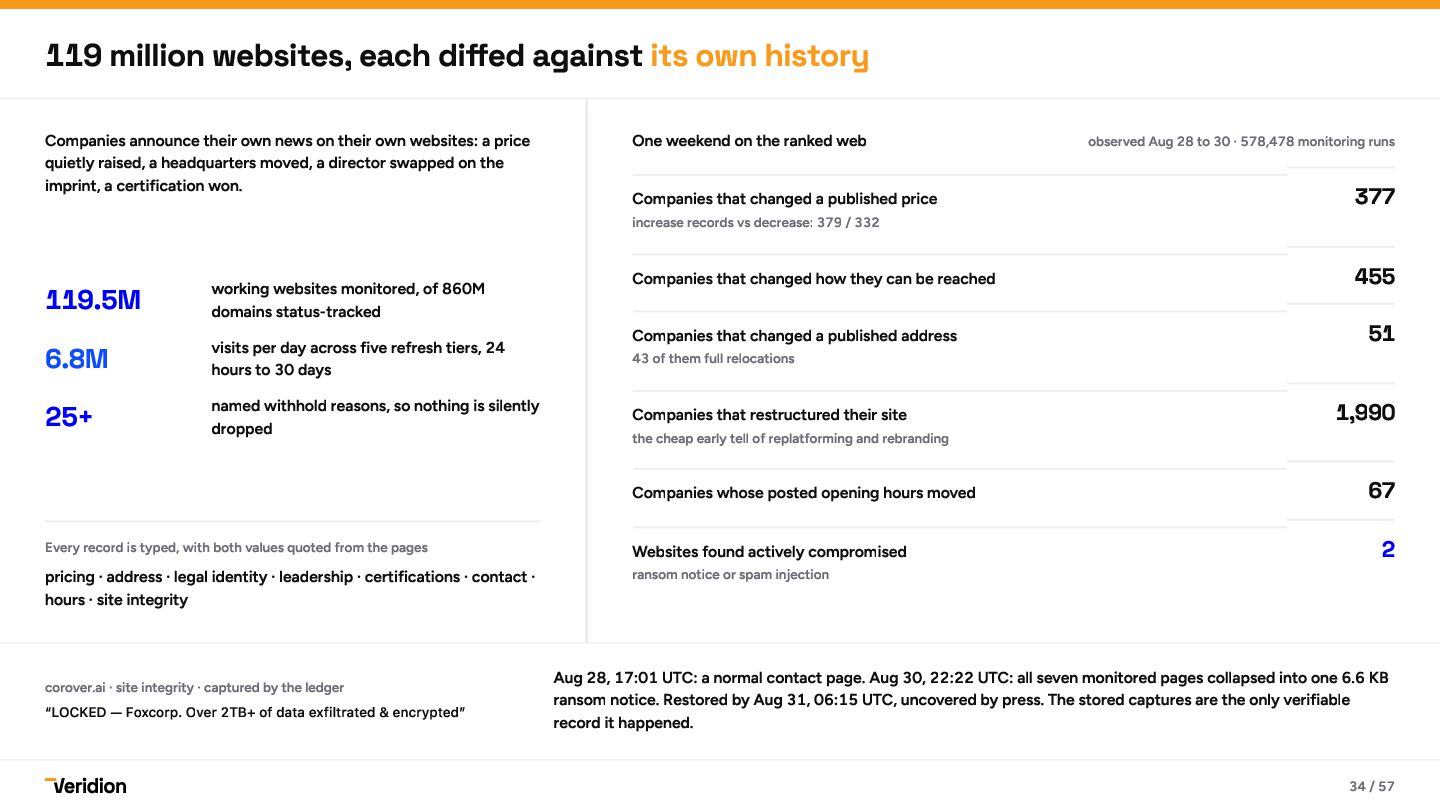
    announce their own news on their own websites: a price quietly raised, a headquarters moved, a director swapped on the imprint, a certification won. One weekend on the ranked web Companies that changed a published price increase records vs decrease: 379 / 332 119.5M 6.8M 25+ working websites monitored, of 860M domains status-tracked visits per day across five refresh tiers, 24 hours to 30 days named withhold reasons, so nothing is silently dropped Companies that changed how they can be reached Companies that changed a published address 43 of them full relocations Companies that restructured their site the cheap early tell of replatforming and rebranding Companies whose posted opening hours moved Every record is typed, with both values quoted from the pages pricing · address · legal identity · leadership · certifications · contact · hours · site integrity corover.ai · site integrity · captured by the ledger “LOCKED — Foxcorp. Over 2TB+ of data exfiltrated & encrypted” Websites found actively compromised ransom notice or spam injection observed Aug 28 to 30 · 578,478 monitoring runs 377 455 51 1,990 67 2 Aug 28, 17:01 UTC: a normal contact page. Aug 30, 22:22 UTC: all seven monitored pages collapsed into one 6.6 KB ransom notice. Restored by Aug 31, 06:15 UTC, uncovered by press. The stored captures are the only verifiable record it happened. 34 / 57
  31. Companies see tier 1. The risk lives below it. 85%

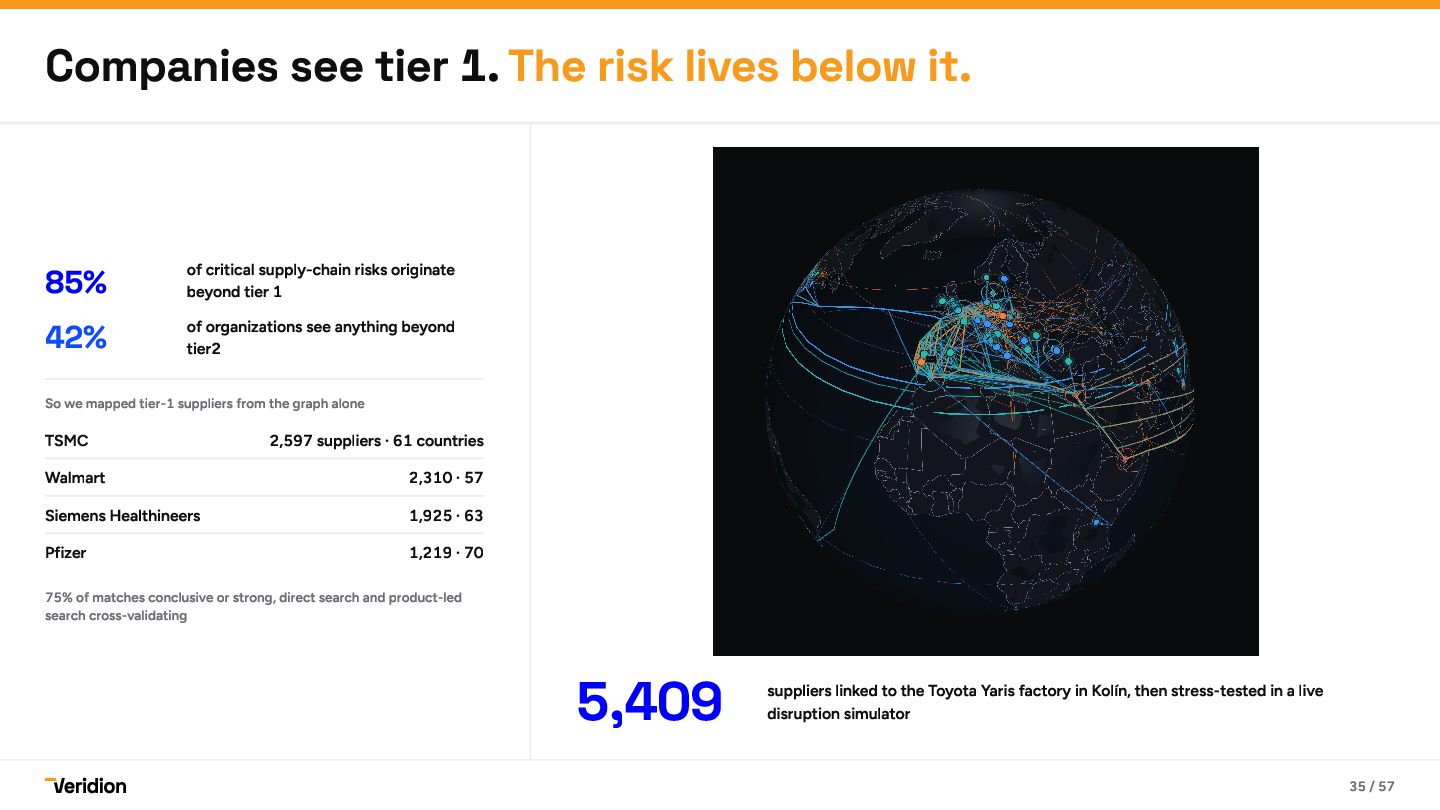
    42% of critical supply-chain risks originate beyond tier 1 of organizations see anything beyond tier2 So we mapped tier-1 suppliers from the graph alone TSMC 2,597 suppliers · 61 countries Walmart 2,310 · 57 Siemens Healthineers 1,925 · 63 Pfizer 1,219 · 70 75% of matches conclusive or strong, direct search and product-led search cross-validating 5,409 suppliers linked to the Toyota Yaris factory in Kolín, then stress-tested in a live disruption simulator 35 / 57
  32. We taught the graph a fraud pattern 2,916 399 UK

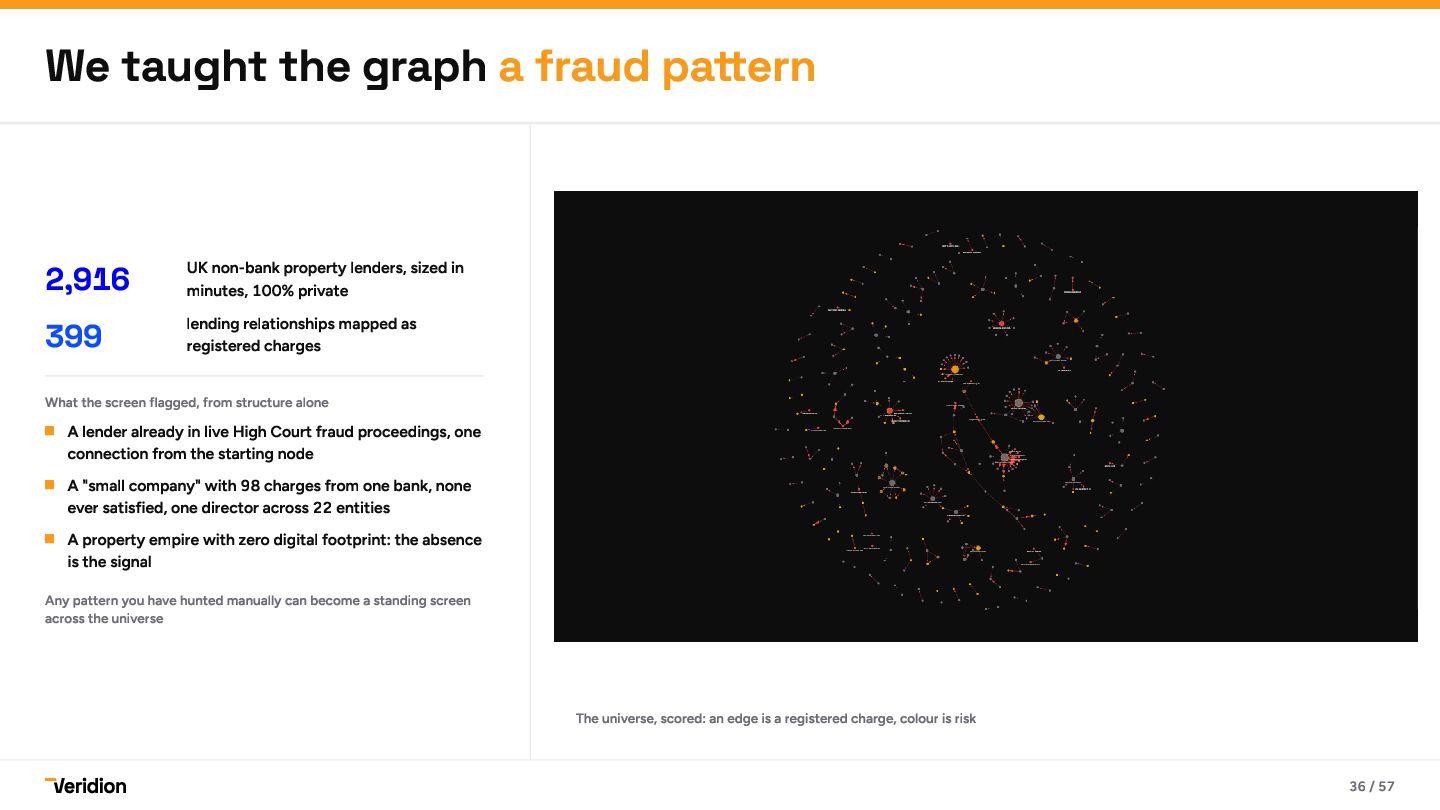
    non-bank property lenders, sized in minutes, 100% private lending relationships mapped as registered charges What the screen flagged, from structure alone A lender already in live High Court fraud proceedings, one connection from the starting node A "small company" with 98 charges from one bank, none ever satisfied, one director across 22 entities A property empire with zero digital footprint: the absence is the signal Any pattern you have hunted manually can become a standing screen across the universe The universe, scored: an edge is a registered charge, colour is risk 36 / 57
  33. Nobody ran out of jet fuel. Price did the damage.

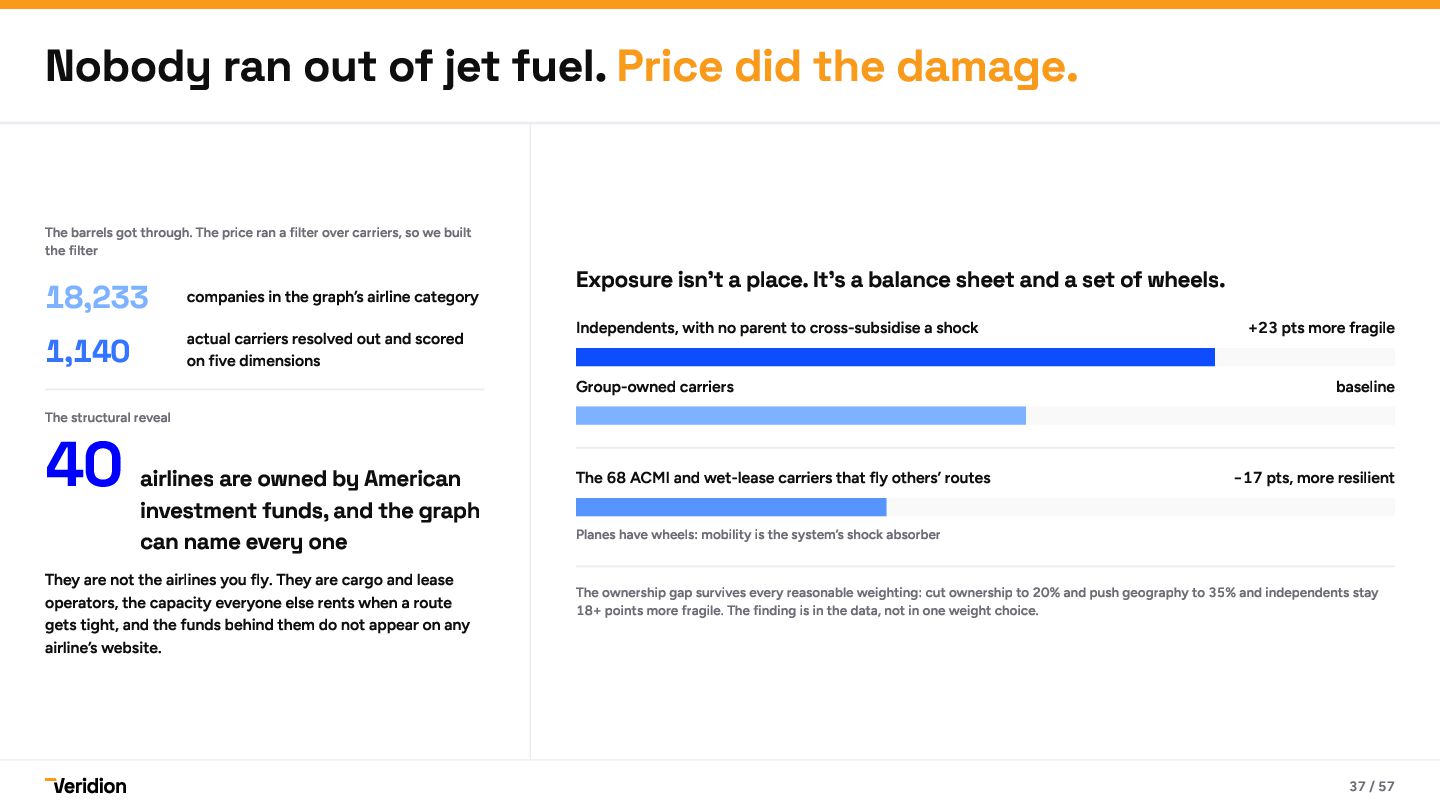
    The barrels got through. The price ran a filter over carriers, so we built the filter 18,233 1,140 40 companies in the graph’s airline category actual carriers resolved out and scored on five dimensions Exposure isn’t a place. It’s a balance sheet and a set of wheels. Independents, with no parent to cross-subsidise a shock Group-owned carriers +23 pts more fragile baseline The structural reveal airlines are owned by American investment funds, and the graph can name every one They are not the airlines you fly. They are cargo and lease operators, the capacity everyone else rents when a route gets tight, and the funds behind them do not appear on any airline’s website. The 68 ACMI and wet-lease carriers that fly others’ routes −17 pts, more resilient Planes have wheels: mobility is the system’s shock absorber The ownership gap survives every reasonable weighting: cut ownership to 20% and push geography to 35% and independents stay 18+ points more fragile. The finding is in the data, not in one weight choice. 37 / 57
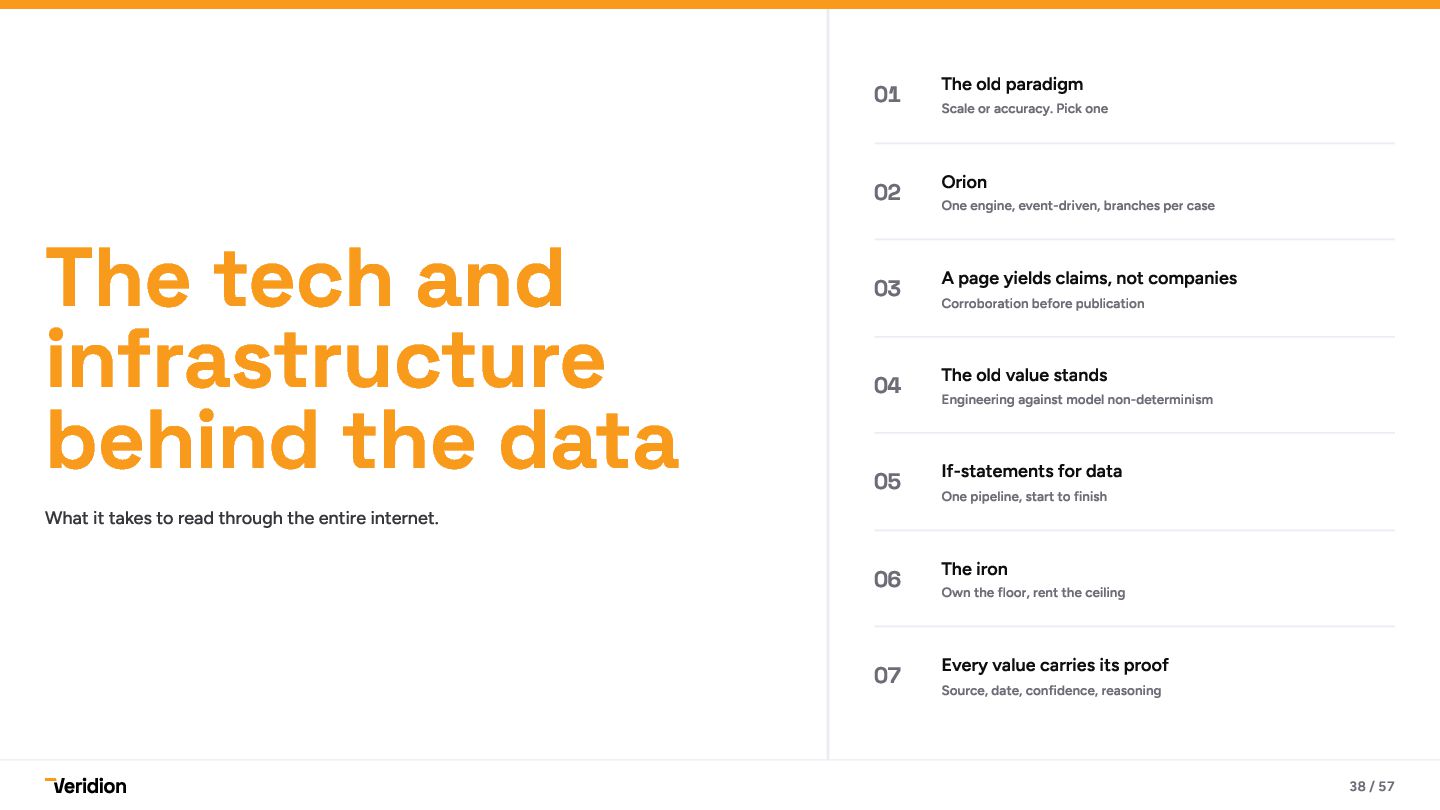
  34. The tech and infrastructure behind the data What it takes

    to read through the entire internet. 01 The old paradigm 02 Orion 03 A page yields claims, not companies 04 The old value stands 05 If-statements for data 06 The iron 07 Every value carries its proof Scale or accuracy. Pick one One engine, event-driven, branches per case Corroboration before publication Engineering against model non-determinism One pipeline, start to finish Own the floor, rent the ceiling Source, date, confidence, reasoning 38 / 57
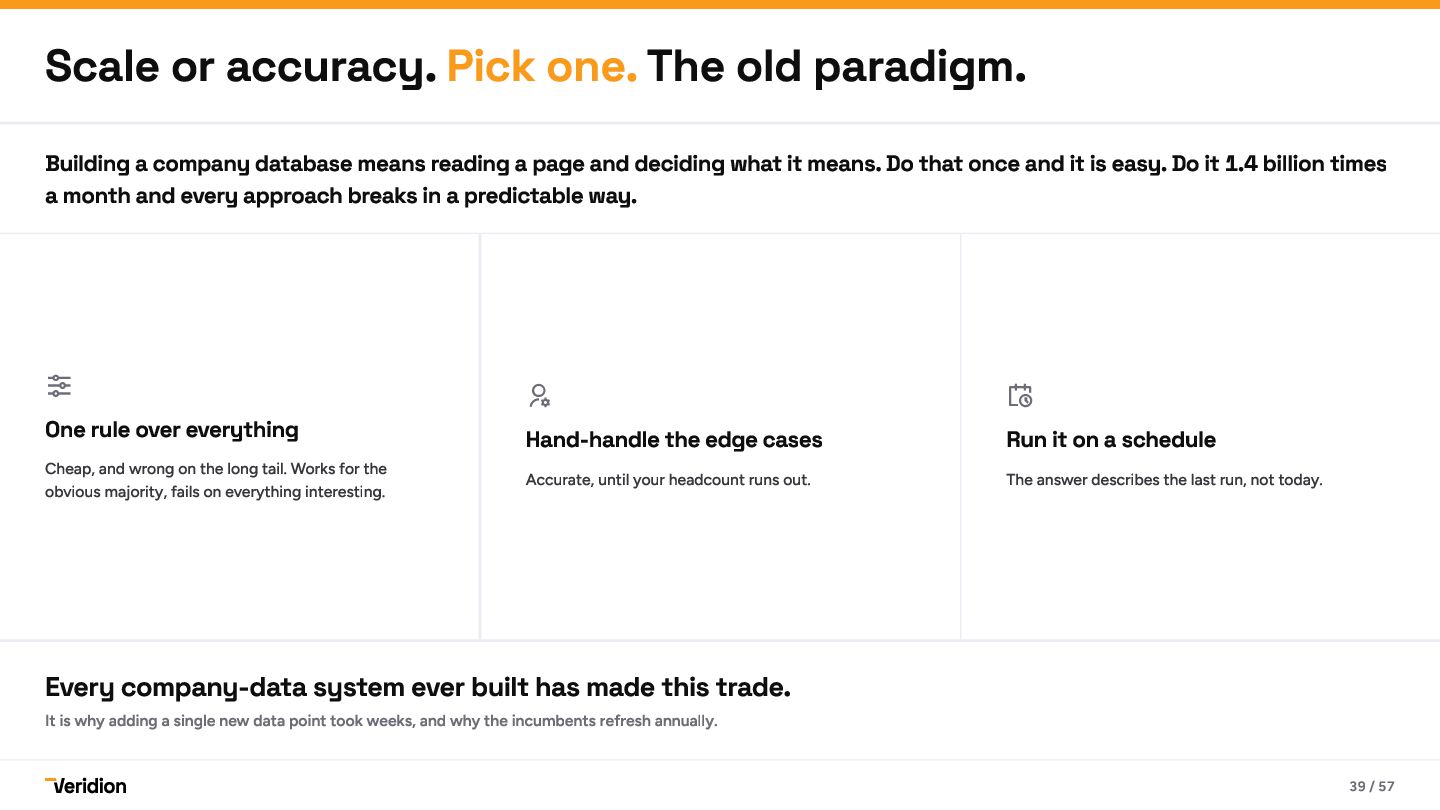
  35. Scale or accuracy. Pick one. The old paradigm. Building a

    company database means reading a page and deciding what it means. Do that once and it is easy. Do it 1.4 billion times a month and every approach breaks in a predictable way.  One rule over everything Cheap, and wrong on the long tail. Works for the obvious majority, fails on everything interesting.   Accurate, until your headcount runs out. The answer describes the last run, not today. Hand-handle the edge cases Run it on a schedule Every company-data system ever built has made this trade. It is why adding a single new data point took weeks, and why the incumbents refresh annually. 39 / 57
  36. One engine. Event-driven. Branches per case. Every product we sell

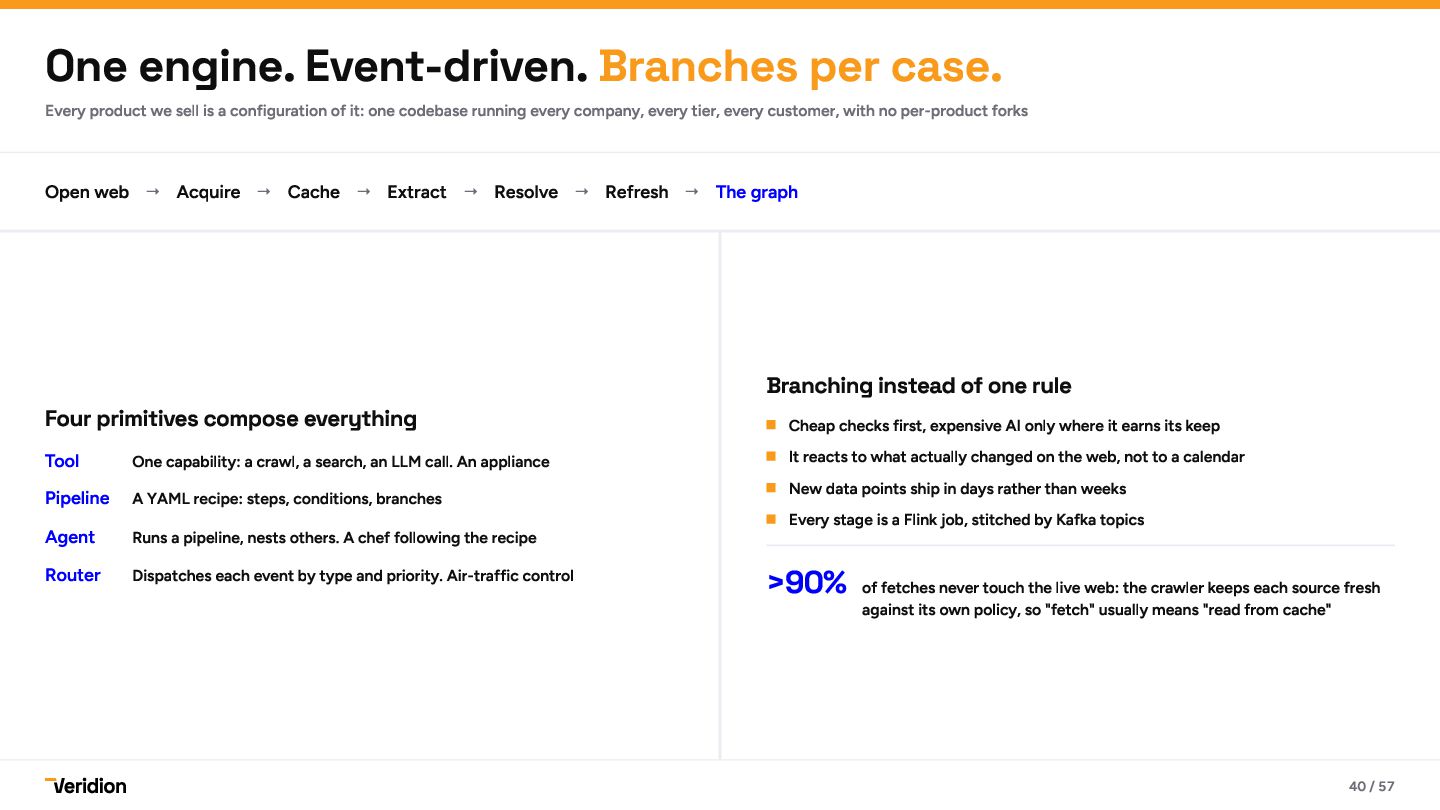
    is a configuration of it: one codebase running every company, every tier, every customer, with no per-product forks Open web → Acquire → Cache → Extract → Resolve → Refresh → The graph Four primitives compose everything Tool One capability: a crawl, a search, an LLM call. An appliance Pipeline A YAML recipe: steps, conditions, branches Agent Router Runs a pipeline, nests others. A chef following the recipe Dispatches each event by type and priority. Air-traffic control Branching instead of one rule Cheap checks first, expensive AI only where it earns its keep It reacts to what actually changed on the web, not to a calendar New data points ship in days rather than weeks Every stage is a Flink job, stitched by Kafka topics >90% of fetches never touch the live web: the crawler keeps each source fresh against its own policy, so "fetch" usually means "read from cache" 40 / 57
  37. A page yields claims, not companies One page is one

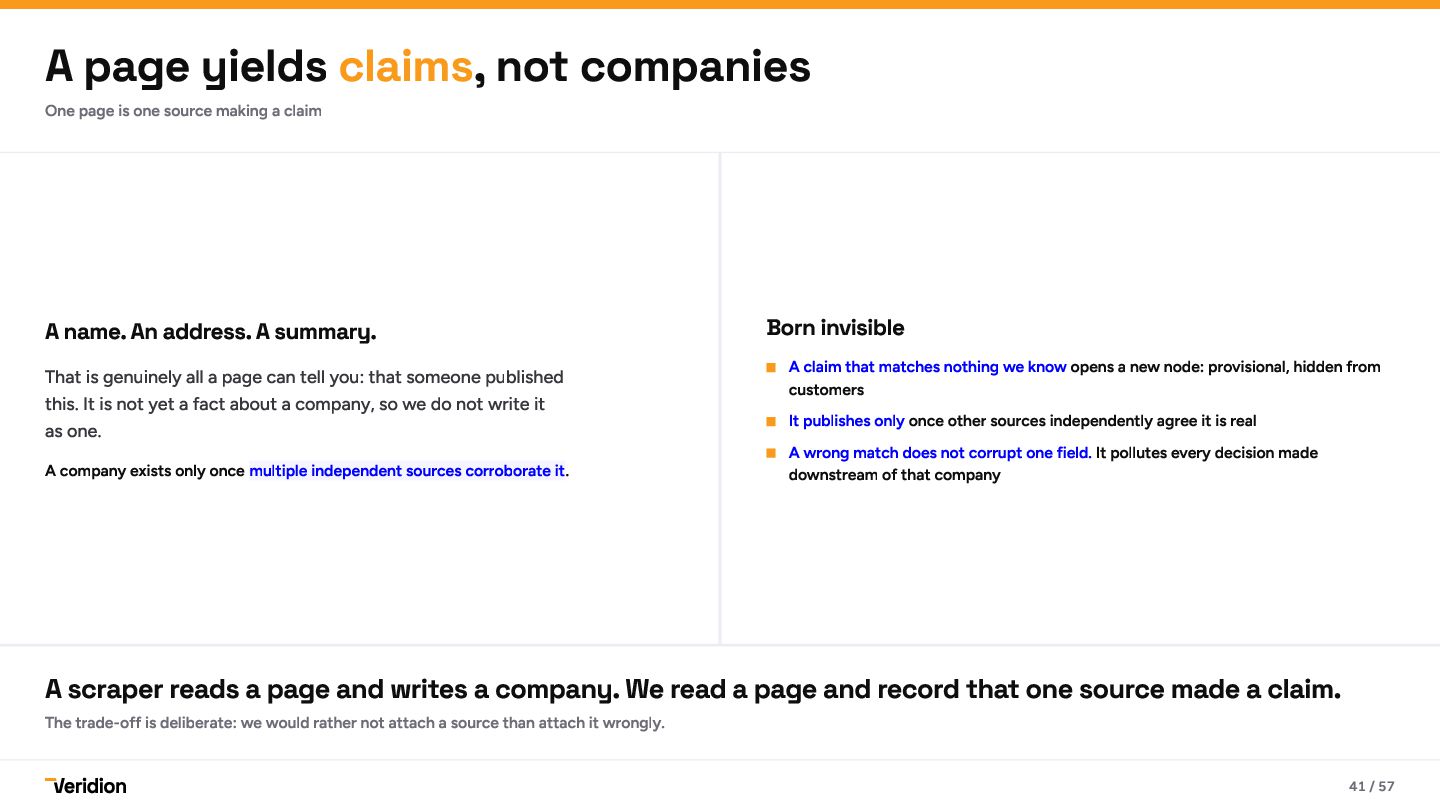
    source making a claim A name. An address. A summary. That is genuinely all a page can tell you: that someone published this. It is not yet a fact about a company, so we do not write it as one. A company exists only once multiple independent sources corroborate it. Born invisible A claim that matches nothing we know opens a new node: provisional, hidden from customers It publishes only once other sources independently agree it is real A wrong match does not corrupt one field. It pollutes every decision made downstream of that company A scraper reads a page and writes a company. We read a page and record that one source made a claim. The trade-off is deliberate: we would rather not attach a source than attach it wrongly. 41 / 57
  38. The old value is correct until proven otherwise Re-run a

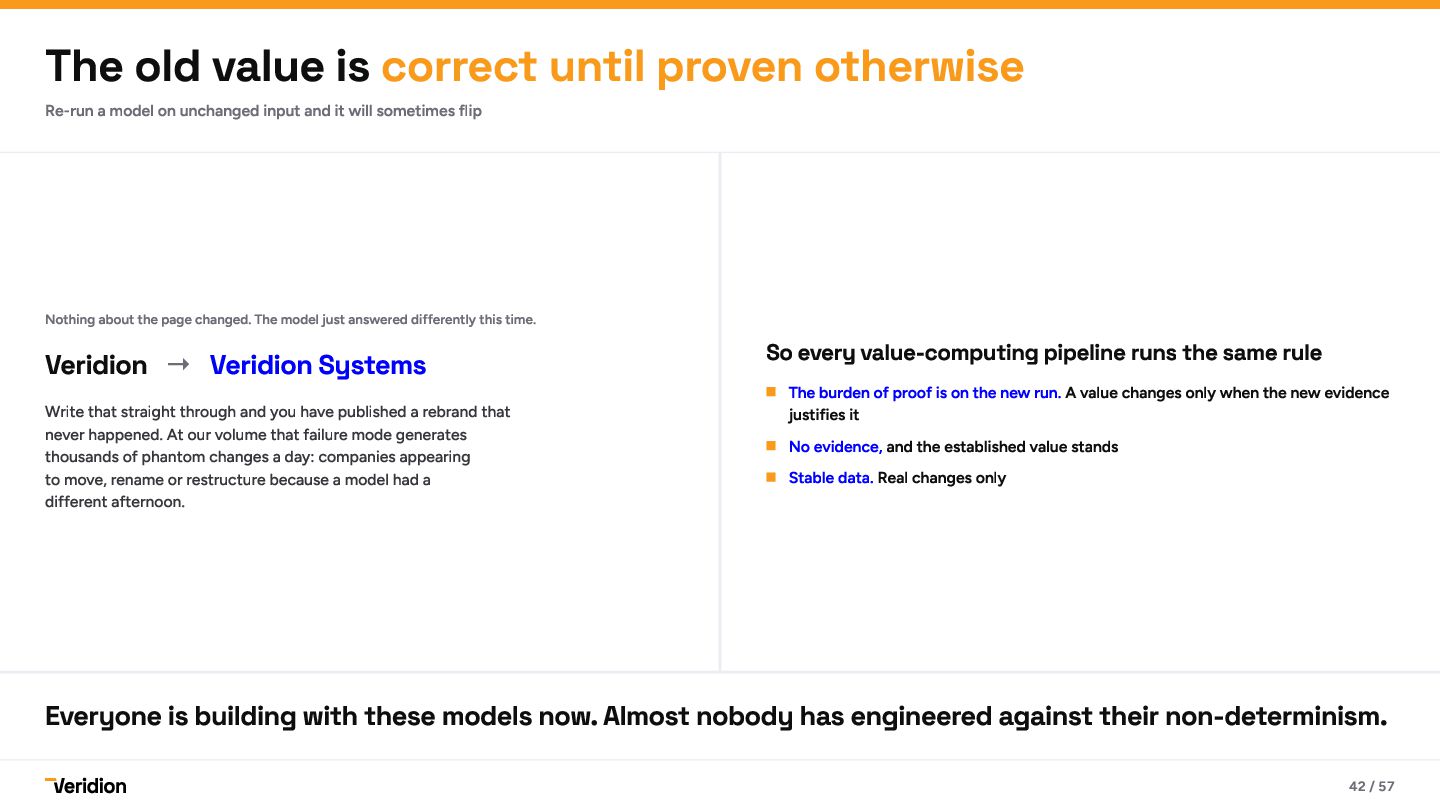
    model on unchanged input and it will sometimes flip Nothing about the page changed. The model just answered differently this time. Veridion → Veridion Systems Write that straight through and you have published a rebrand that never happened. At our volume that failure mode generates thousands of phantom changes a day: companies appearing to move, rename or restructure because a model had a different afternoon. So every value-computing pipeline runs the same rule The burden of proof is on the new run. A value changes only when the new evidence justifies it No evidence, and the established value stands Stable data. Real changes only Everyone is building with these models now. Almost nobody has engineered against their non-determinism. 42 / 57
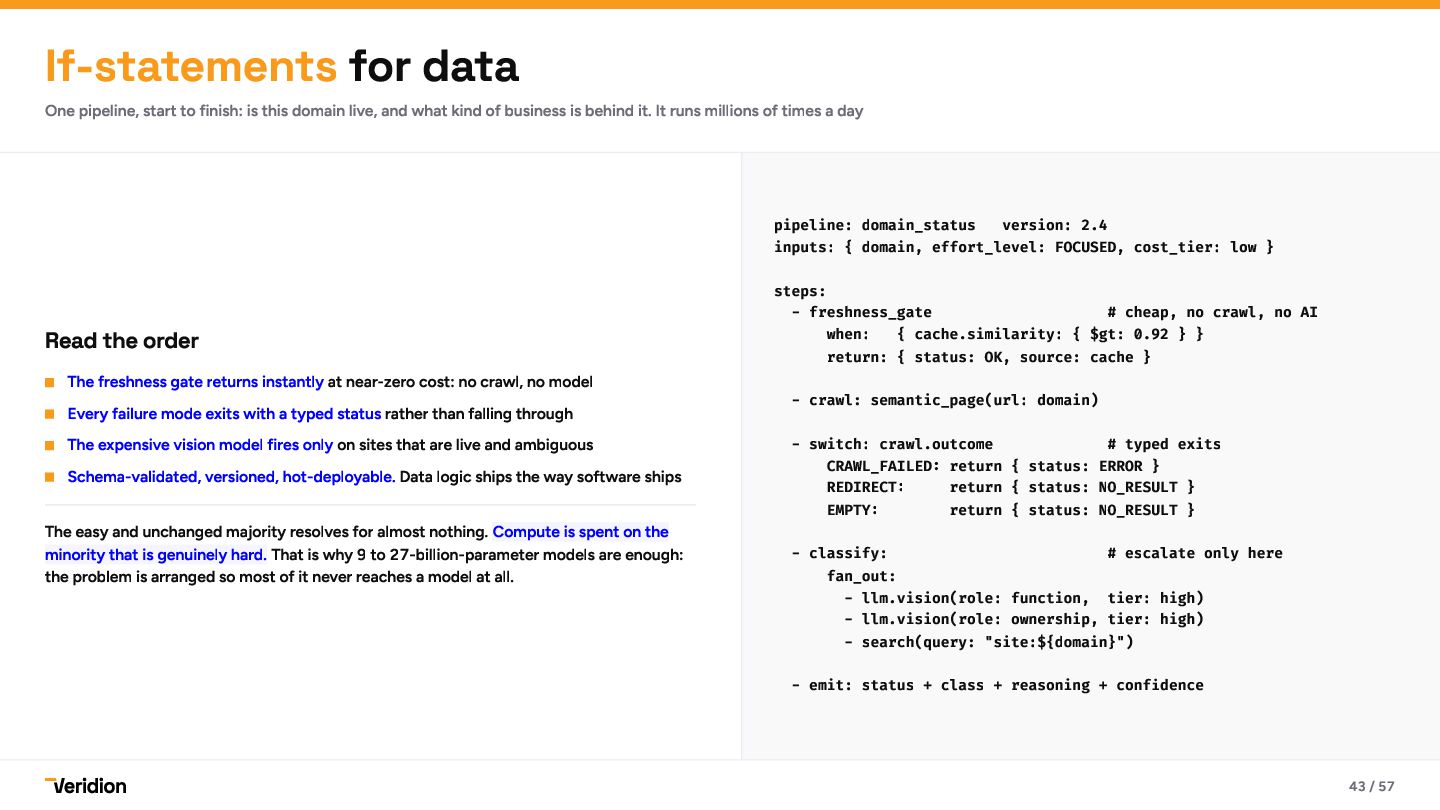
  39. If-statements for data One pipeline, start to finish: is this

    domain live, and what kind of business is behind it. It runs millions of times a day pipeline: domain_status version: 2.4 inputs: { domain, effort_level: FOCUSED, cost_tier: low } Read the order The freshness gate returns instantly at near-zero cost: no crawl, no model Every failure mode exits with a typed status rather than falling through The expensive vision model fires only on sites that are live and ambiguous Schema-validated, versioned, hot-deployable. Data logic ships the way software ships The easy and unchanged majority resolves for almost nothing. Compute is spent on the minority that is genuinely hard. That is why 9 to 27-billion-parameter models are enough: the problem is arranged so most of it never reaches a model at all. steps: - freshness_gate # cheap, no crawl, no AI when: { cache.similarity: { $gt: 0.92 } } return: { status: OK, source: cache } - crawl: semantic_page(url: domain) - switch: crawl.outcome # typed exits CRAWL_FAILED: return { status: ERROR } REDIRECT: return { status: NO_RESULT } EMPTY: return { status: NO_RESULT } - classify: # escalate only here fan_out: - llm.vision(role: function, tier: high) - llm.vision(role: ownership, tier: high) - search(query: "site:${domain}") - emit: status + class + reasoning + confidence 43 / 57
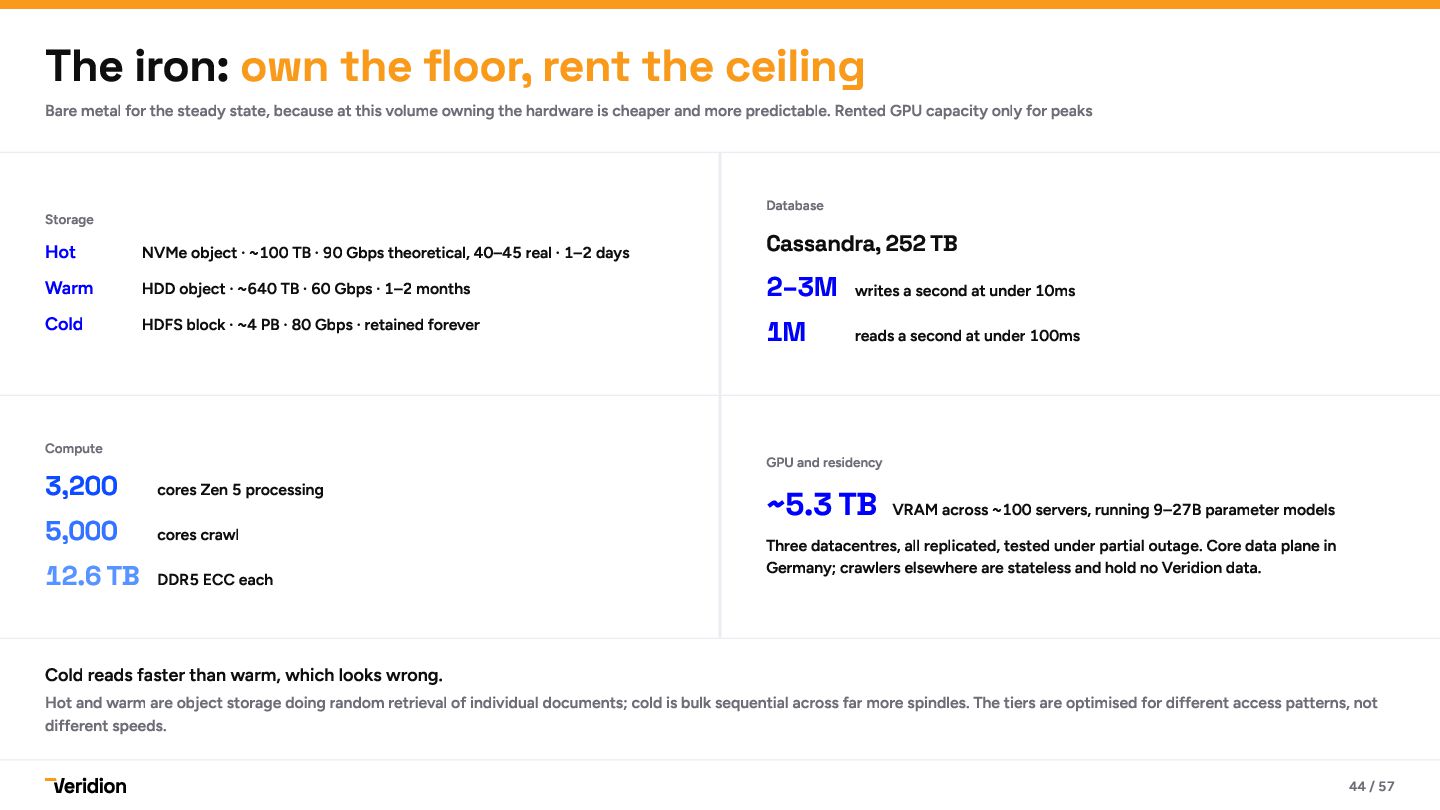
  40. The iron: own the floor, rent the ceiling Bare metal

    for the steady state, because at this volume owning the hardware is cheaper and more predictable. Rented GPU capacity only for peaks Database Storage Hot Warm Cold NVMe object · ~100 TB · 90 Gbps theoretical, 40–45 real · 1–2 days HDD object · ~640 TB · 60 Gbps · 1–2 months HDFS block · ~4 PB · 80 Gbps · retained forever Compute 3,200 cores Zen 5 processing 5,000 cores crawl 12.6 TB DDR5 ECC each Cassandra, 252 TB 2–3M writes a second at under 10ms 1M reads a second at under 100ms GPU and residency ~5.3 TB VRAM across ~100 servers, running 9–27B parameter models Three datacentres, all replicated, tested under partial outage. Core data plane in Germany; crawlers elsewhere are stateless and hold no Veridion data. Cold reads faster than warm, which looks wrong. Hot and warm are object storage doing random retrieval of individual documents; cold is bulk sequential across far more spindles. The tiers are optimised for different access patterns, not different speeds. 44 / 57
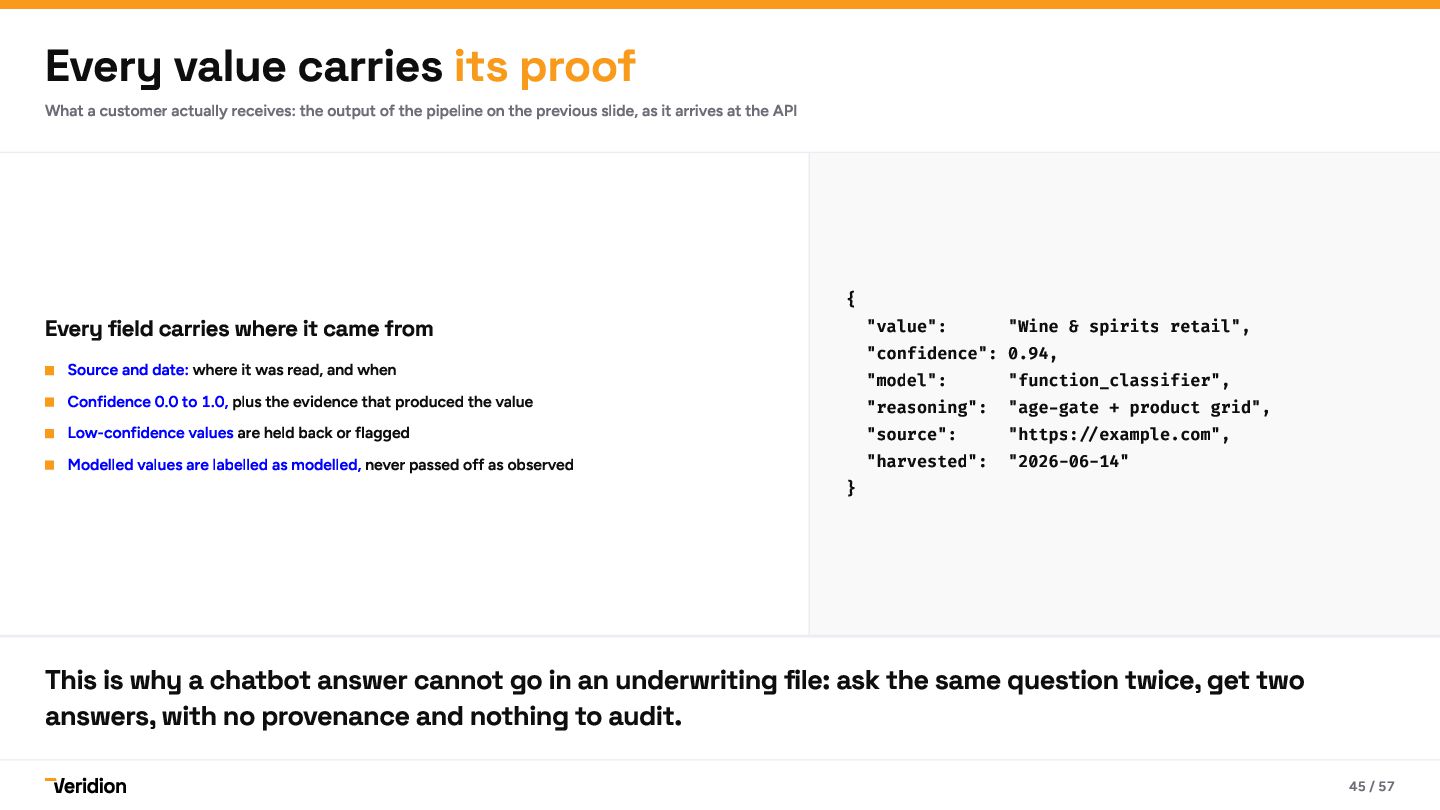
  41. Every value carries its proof What a customer actually receives:

    the output of the pipeline on the previous slide, as it arrives at the API Every field carries where it came from Source and date: where it was read, and when Confidence 0.0 to 1.0, plus the evidence that produced the value Low-confidence values are held back or flagged Modelled values are labelled as modelled, never passed off as observed { "value": "Wine & spirits retail", "confidence": 0.94, "model": "function_classifier", "reasoning": "age-gate + product grid", "source": "https://example.com", "harvested": "2026-06-14" } This is why a chatbot answer cannot go in an underwriting file: ask the same question twice, get two answers, with no provenance and nothing to audit. 45 / 57
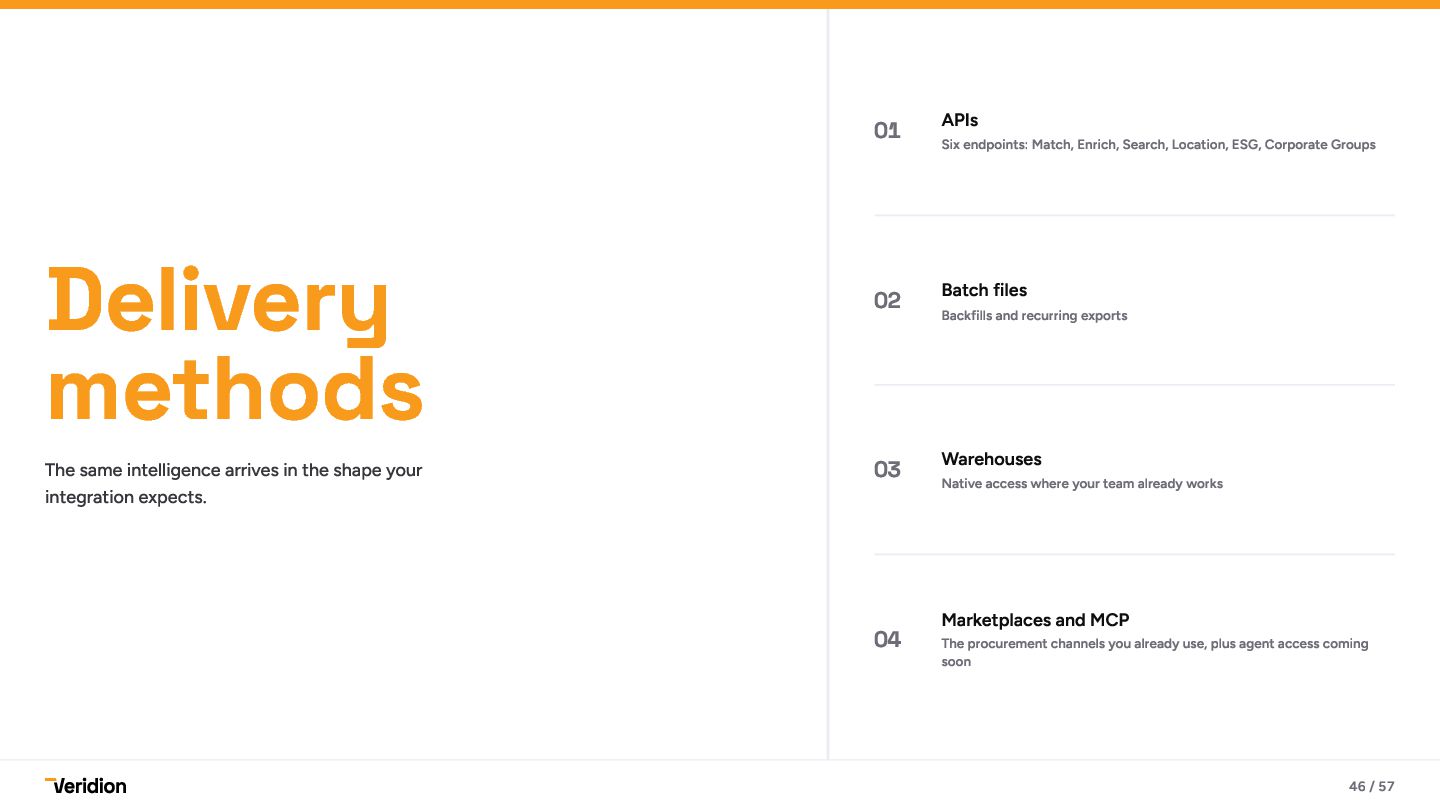
  42. Delivery methods The same intelligence arrives in the shape your

    integration expects. 01 APIs 02 Batch files 03 Warehouses 04 Marketplaces and MCP Six endpoints: Match, Enrich, Search, Location, ESG, Corporate Groups Backfills and recurring exports Native access where your team already works The procurement channels you already use, plus agent access coming soon 46 / 57
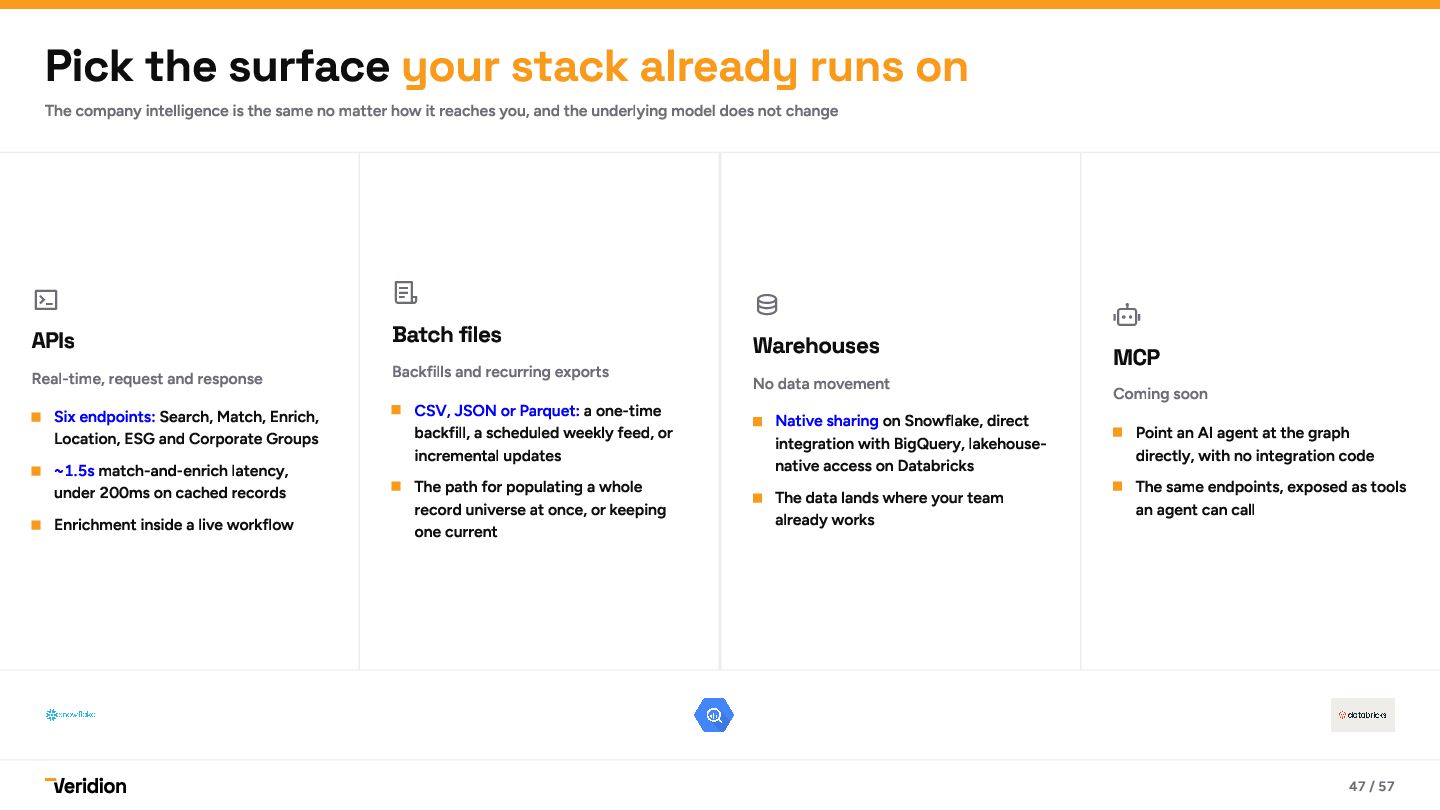
  43. Pick the surface your stack already runs on The company

    intelligence is the same no matter how it reaches you, and the underlying model does not change   Real-time, request and response Backfills and recurring exports APIs Six endpoints: Search, Match, Enrich, Location, ESG and Corporate Groups ~1.5s match-and-enrich latency, under 200ms on cached records Enrichment inside a live workflow Batch files CSV, JSON or Parquet: a one-time backfill, a scheduled weekly feed, or incremental updates The path for populating a whole record universe at once, or keeping one current  Warehouses No data movement Native sharing on Snowflake, direct integration with BigQuery, lakehousenative access on Databricks The data lands where your team already works  MCP Coming soon Point an AI agent at the graph directly, with no integration code The same endpoints, exposed as tools an agent can call 47 / 57
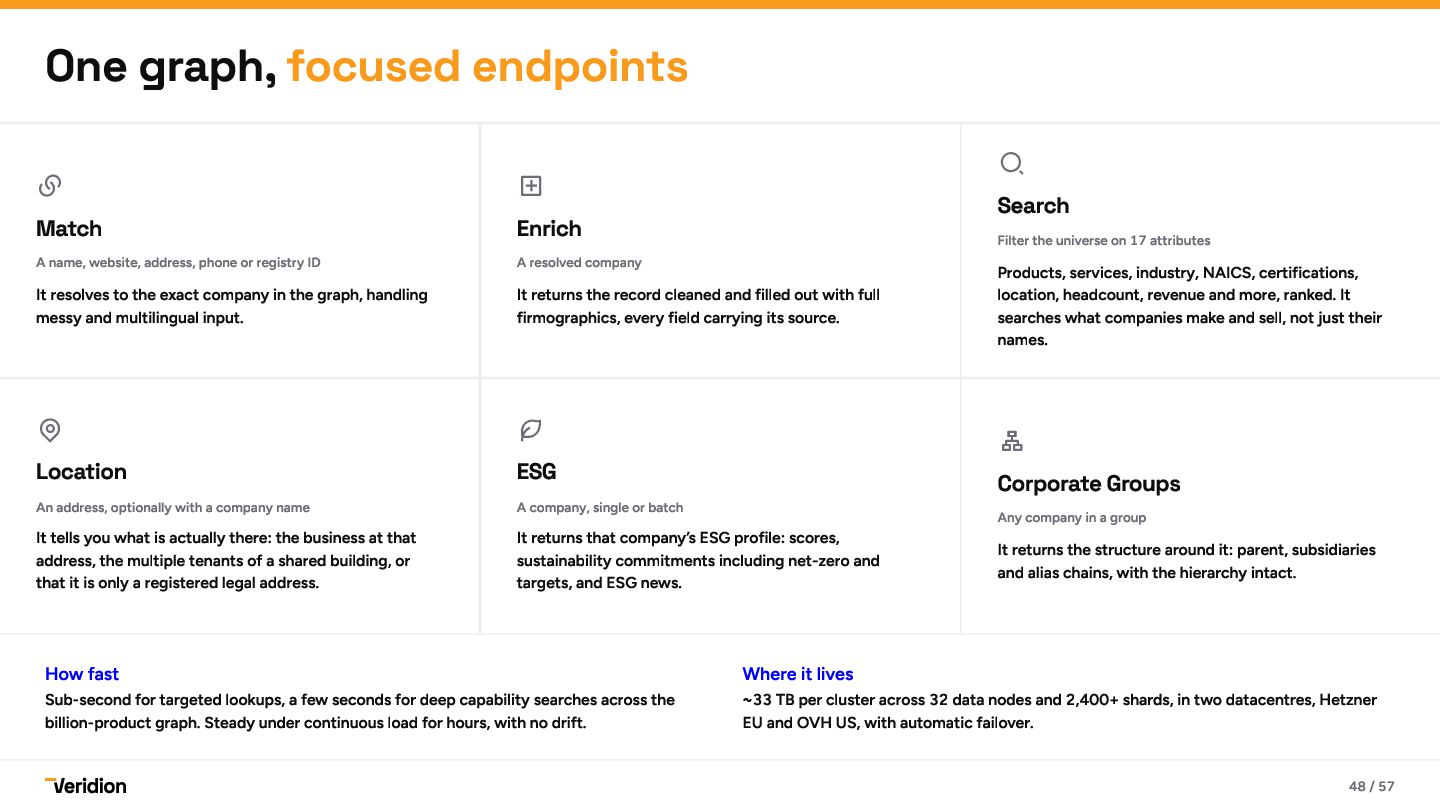
  44. One graph, focused endpoints   A name, website, address,

    phone or registry ID A resolved company Match  Search Enrich Filter the universe on 17 attributes It resolves to the exact company in the graph, handling messy and multilingual input. It returns the record cleaned and filled out with full firmographics, every field carrying its source. Products, services, industry, NAICS, certifications, location, headcount, revenue and more, ranked. It searches what companies make and sell, not just their names.    An address, optionally with a company name A company, single or batch It tells you what is actually there: the business at that address, the multiple tenants of a shared building, or that it is only a registered legal address. It returns that company’s ESG profile: scores, sustainability commitments including net-zero and targets, and ESG news. Location How fast ESG Sub-second for targeted lookups, a few seconds for deep capability searches across the billion-product graph. Steady under continuous load for hours, with no drift. Corporate Groups Any company in a group It returns the structure around it: parent, subsidiaries and alias chains, with the hierarchy intact. Where it lives ~33 TB per cluster across 32 data nodes and 2,400+ shards, in two datacentres, Hetzner EU and OVH US, with automatic failover. 48 / 57
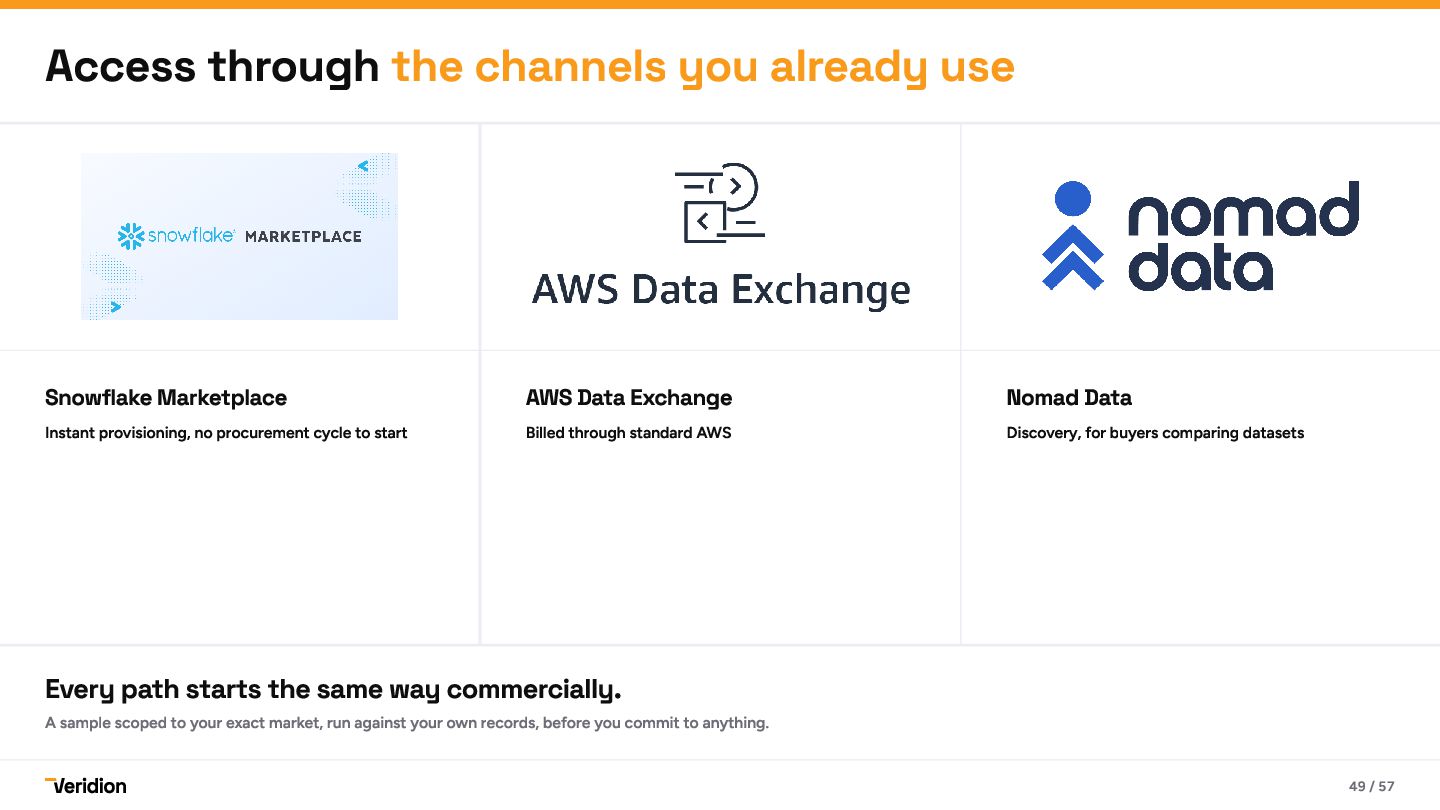
  45. Access through the channels you already use Snowflake Marketplace Instant

    provisioning, no procurement cycle to start AWS Data Exchange Billed through standard AWS Nomad Data Discovery, for buyers comparing datasets Every path starts the same way commercially. A sample scoped to your exact market, run against your own records, before you commit to anything. 49 / 57
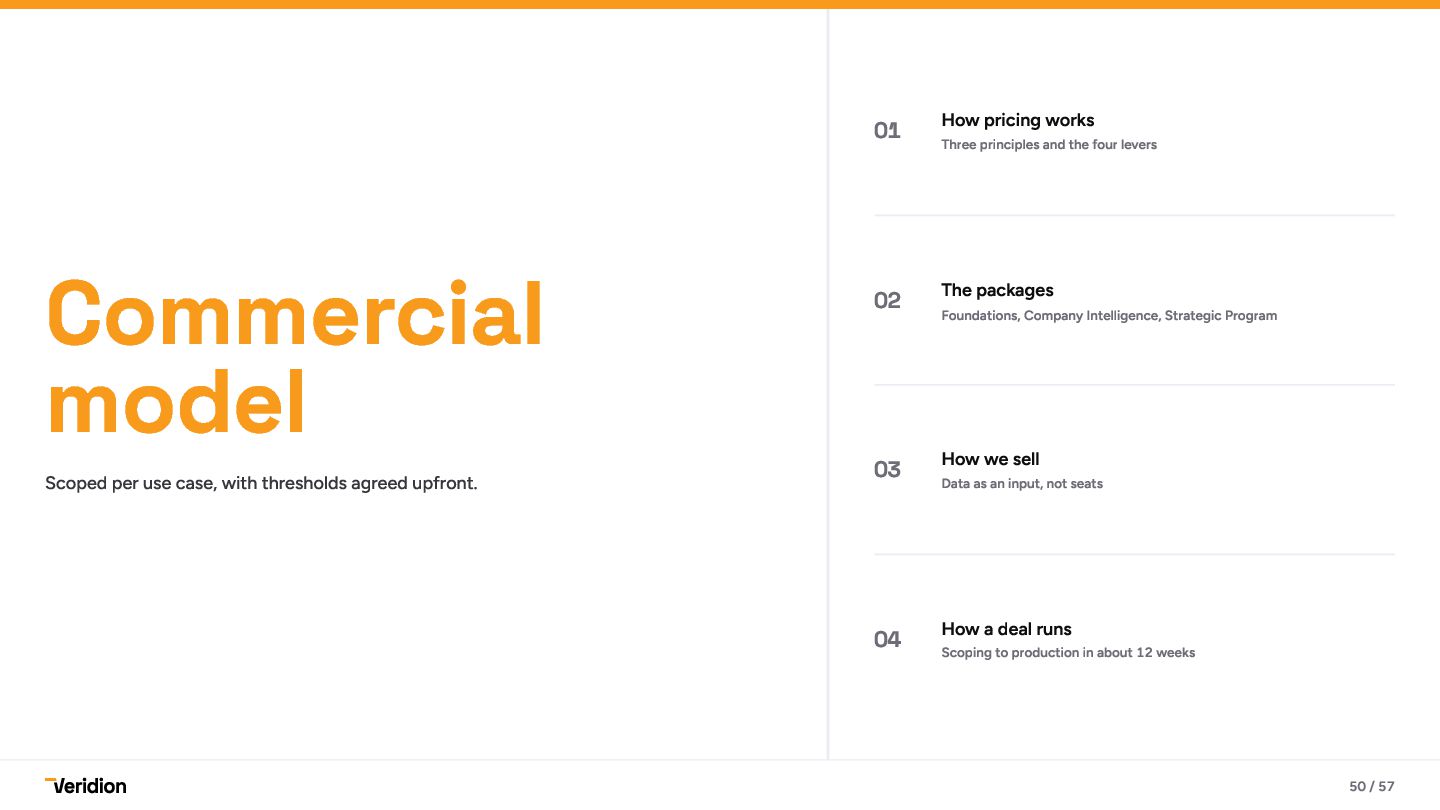
  46. Commercial model Scoped per use case, with thresholds agreed upfront.
    01 How pricing works 02 The packages 03 How we sell 04 How a deal runs Three principles and the four levers Foundations, Company Intelligence, Strategic Program Data as an input, not seats Scoping to production in about 12 weeks 50 / 57
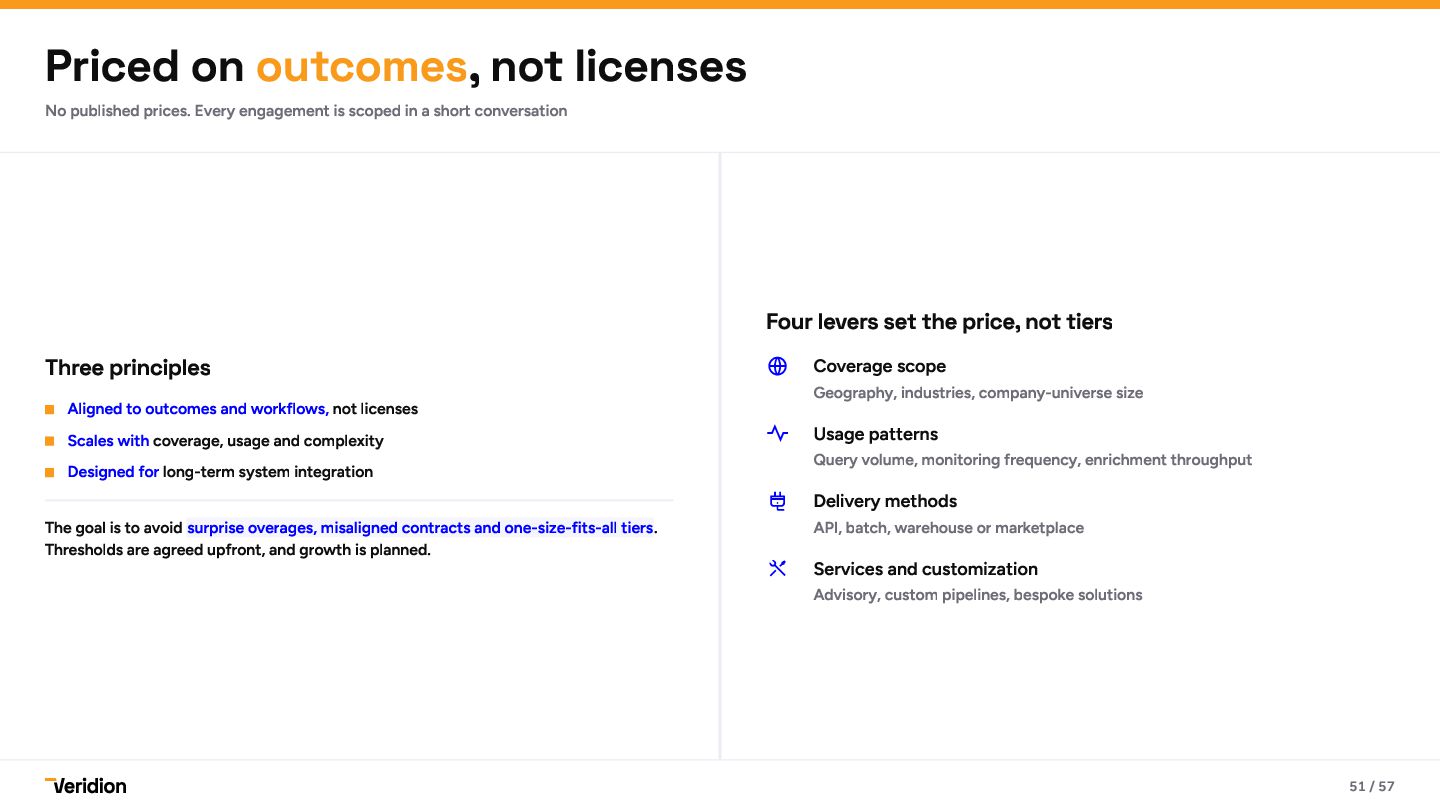
  47. Priced on outcomes, not licenses No published prices. Every engagement

    is scoped in a short conversation Three principles Aligned to outcomes and workflows, not licenses Scales with coverage, usage and complexity Designed for long-term system integration The goal is to avoid surprise overages, misaligned contracts and one-size-fits-all tiers. Thresholds are agreed upfront, and growth is planned. Four levers set the price, not tiers  Coverage scope  Usage patterns  Delivery methods  Services and customization Geography, industries, company-universe size Query volume, monitoring frequency, enrichment throughput API, batch, warehouse or marketplace Advisory, custom pipelines, bespoke solutions 51 / 57
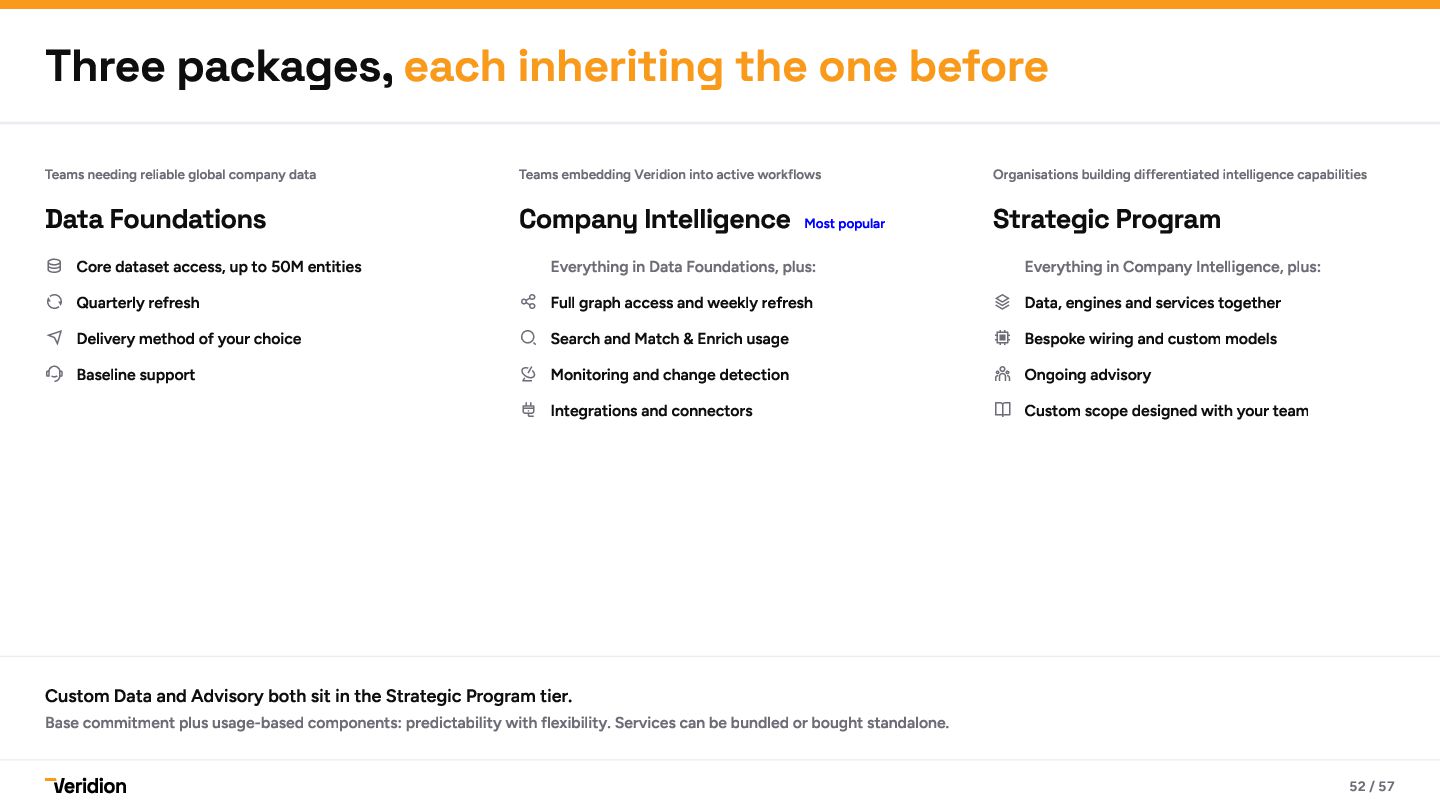
  48. Three packages, each inheriting the one before Teams needing reliable

    global company data Data Foundations Teams embedding Veridion into active workflows Company Intelligence Most popular Organisations building differentiated intelligence capabilities Strategic Program  Core dataset access, up to 50M entities Everything in Data Foundations, plus: Everything in Company Intelligence, plus:  Quarterly refresh  Full graph access and weekly refresh  Data, engines and services together  Delivery method of your choice  Search and Match & Enrich usage  Bespoke wiring and custom models  Baseline support  Monitoring and change detection  Ongoing advisory  Integrations and connectors  Custom scope designed with your team Custom Data and Advisory both sit in the Strategic Program tier. Base commitment plus usage-based components: predictability with flexibility. Services can be bundled or bought standalone. 52 / 57
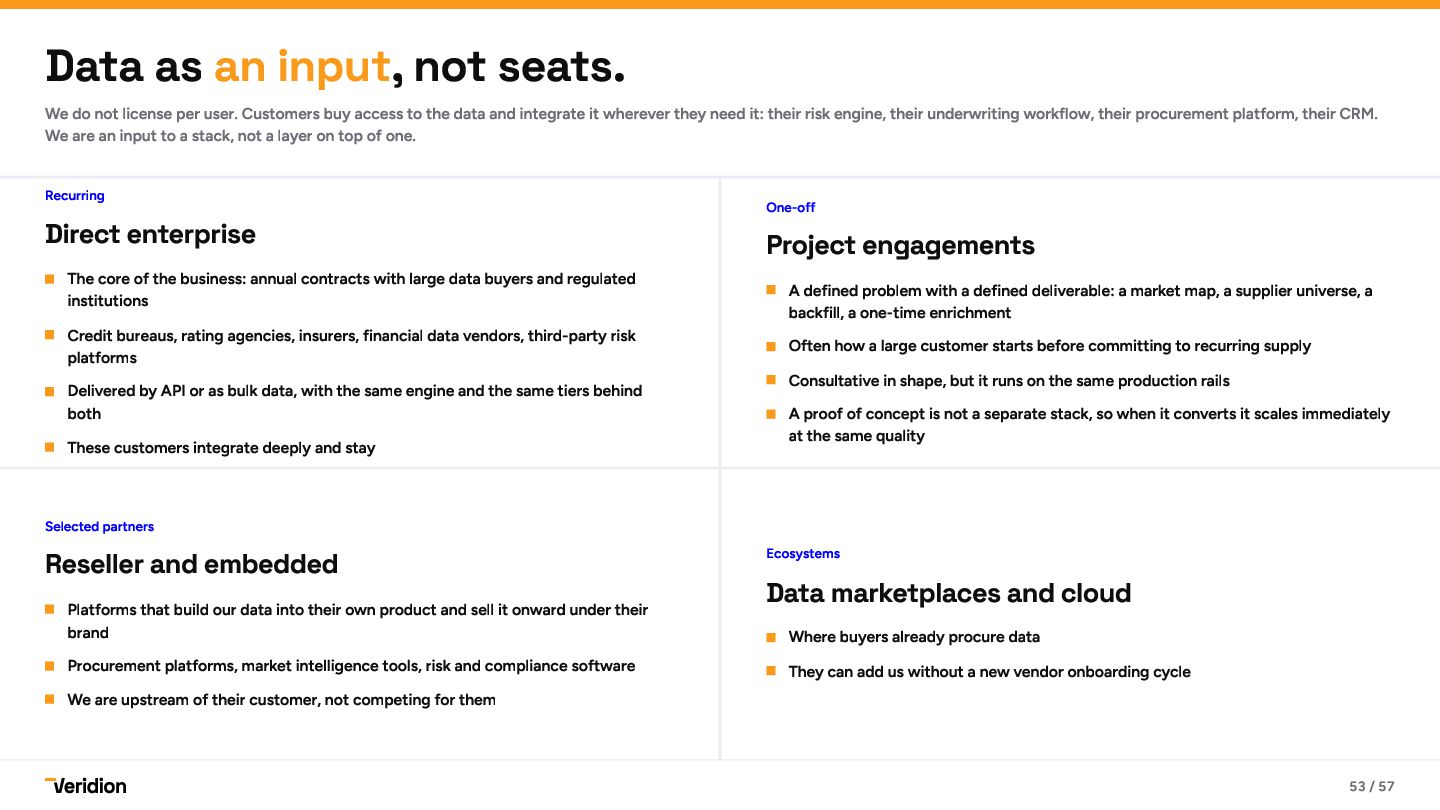
  49. Data as an input, not seats. We do not license

    per user. Customers buy access to the data and integrate it wherever they need it: their risk engine, their underwriting workflow, their procurement platform, their CRM. We are an input to a stack, not a layer on top of one. Recurring Direct enterprise The core of the business: annual contracts with large data buyers and regulated institutions Credit bureaus, rating agencies, insurers, financial data vendors, third-party risk platforms Delivered by API or as bulk data, with the same engine and the same tiers behind both These customers integrate deeply and stay One-off Project engagements A defined problem with a defined deliverable: a market map, a supplier universe, a backfill, a one-time enrichment Often how a large customer starts before committing to recurring supply Consultative in shape, but it runs on the same production rails A proof of concept is not a separate stack, so when it converts it scales immediately at the same quality Selected partners Reseller and embedded Platforms that build our data into their own product and sell it onward under their brand Procurement platforms, market intelligence tools, risk and compliance software We are upstream of their customer, not competing for them Ecosystems Data marketplaces and cloud Where buyers already procure data They can add us without a new vendor onboarding cycle 53 / 57
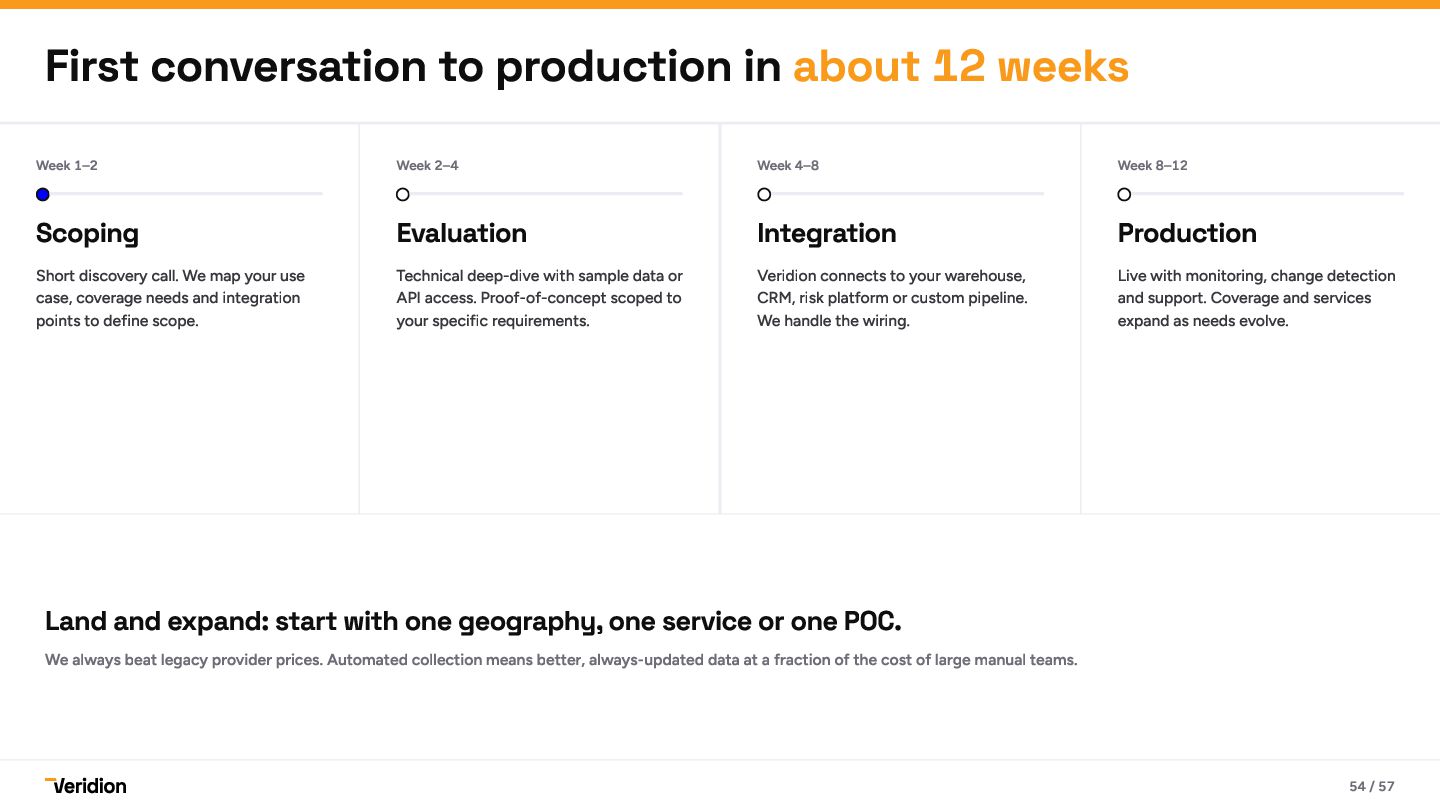
  50. First conversation to production in about 12 weeks Week 1–2

    Week 2–4 Week 4–8 Week 8–12 Scoping Evaluation Integration Production Short discovery call. We map your use case, coverage needs and integration points to define scope. Technical deep-dive with sample data or API access. Proof-of-concept scoped to your specific requirements. Veridion connects to your warehouse, CRM, risk platform or custom pipeline. We handle the wiring. Live with monitoring, change detection and support. Coverage and services expand as needs evolve. Land and expand: start with one geography, one service or one POC. We always beat legacy provider prices. Automated collection means better, always-updated data at a fraction of the cost of large manual teams. 54 / 57
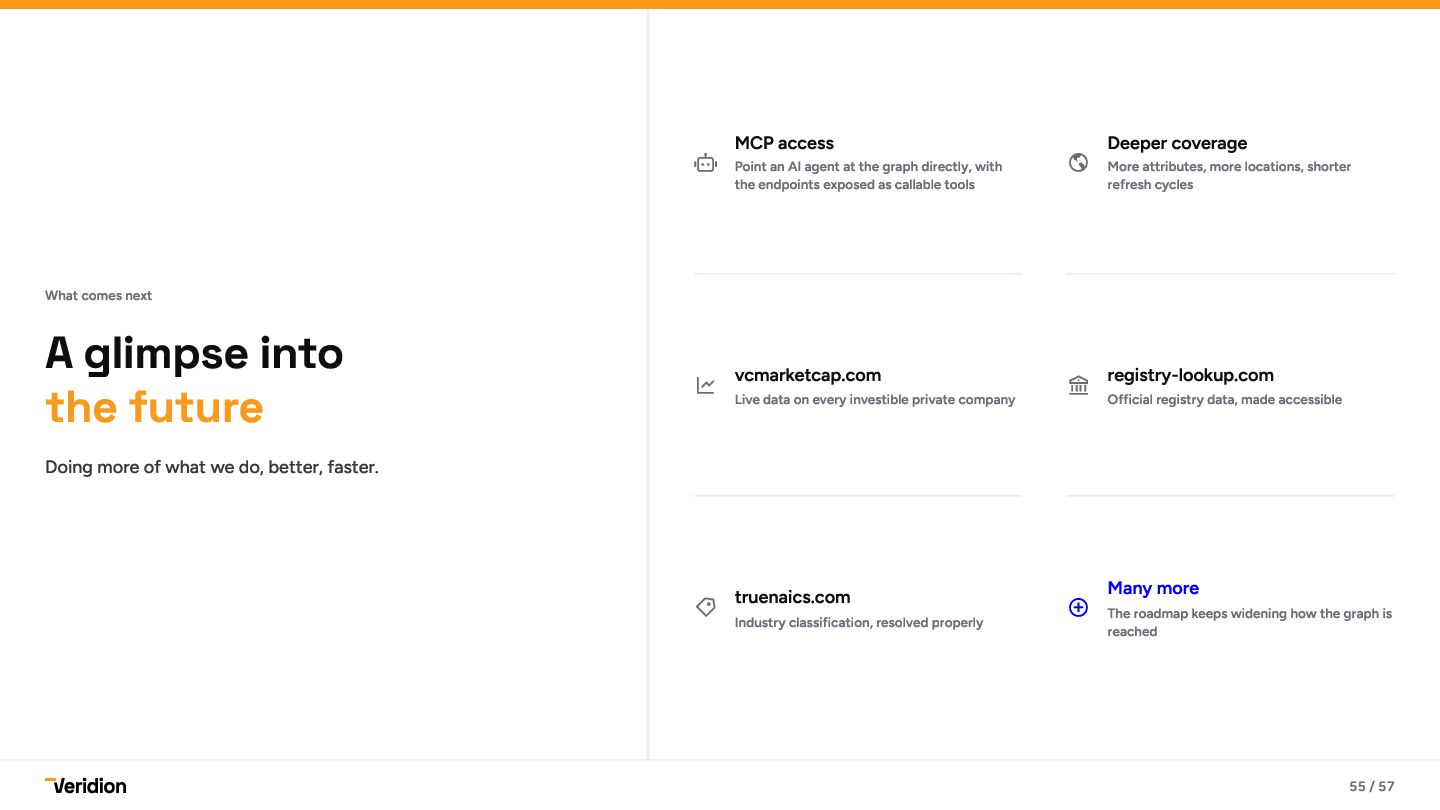
  51. MCP access  Point an AI agent at the graph

    directly, with the endpoints exposed as callable tools Deeper coverage  More attributes, more locations, shorter refresh cycles What comes next A glimpse into the future vcmarketcap.com  Live data on every investible private company registry-lookup.com  Official registry data, made accessible Doing more of what we do, better, faster.  truenaics.com Industry classification, resolved properly Many more  The roadmap keeps widening how the graph is reached 55 / 57