Upgrade to Pro — share decks privately, control downloads, hide ads and more …

Analyzing Software Ecosystems with SECONDA

Analyzing Software Ecosystems with SECONDA

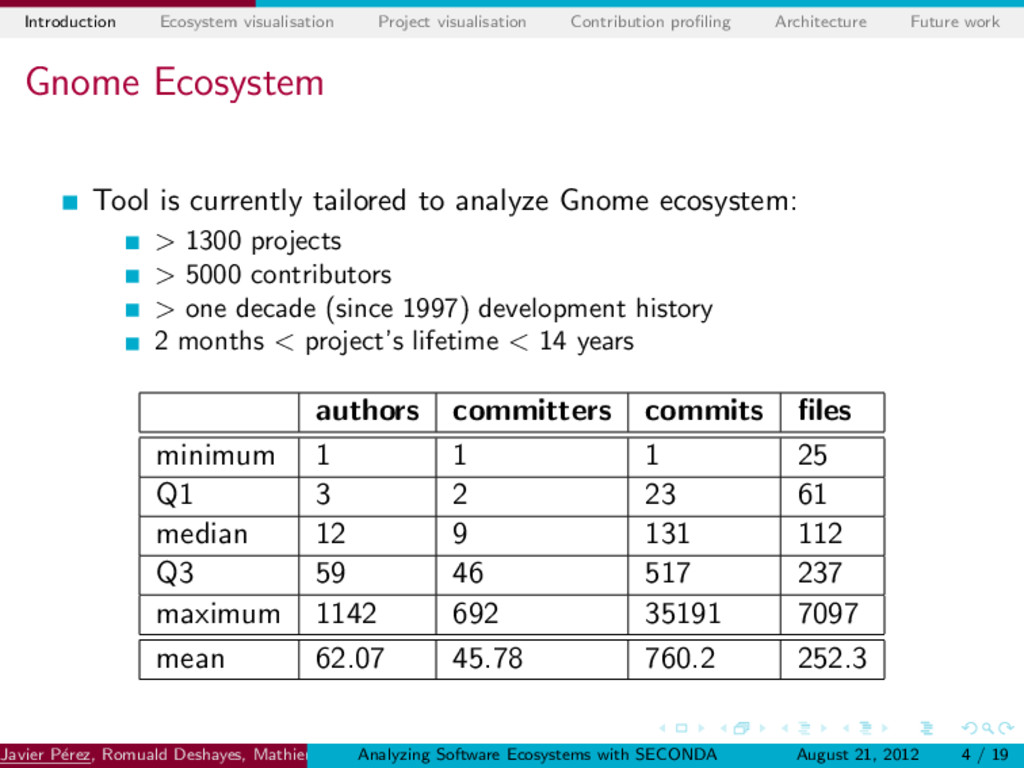
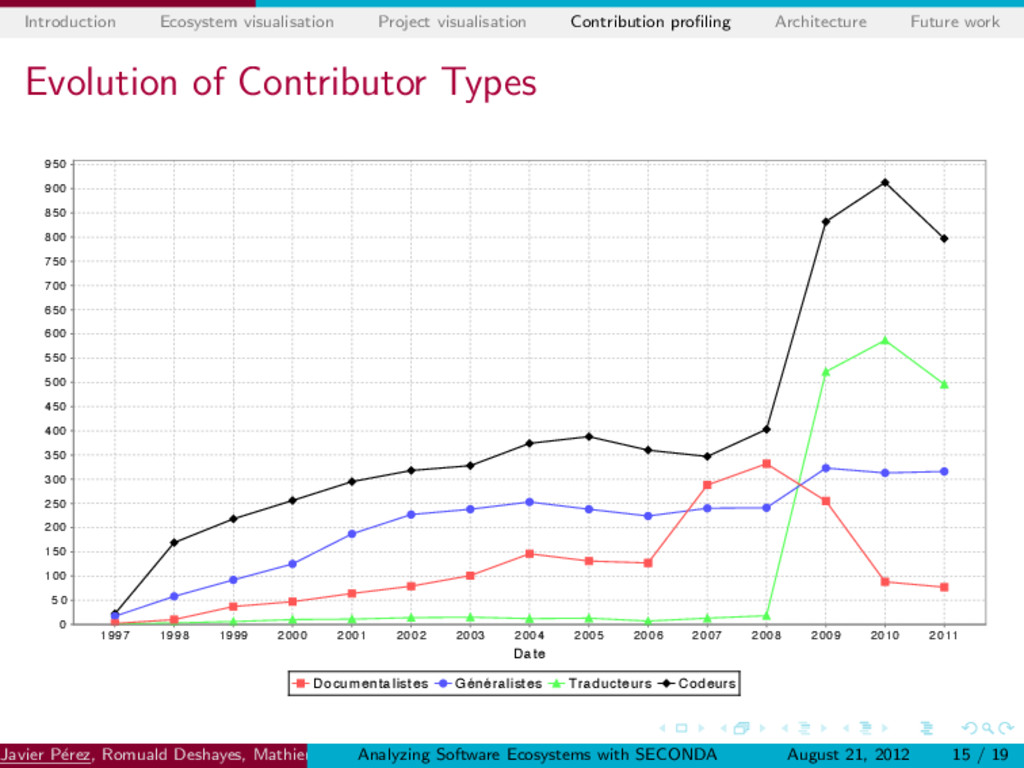
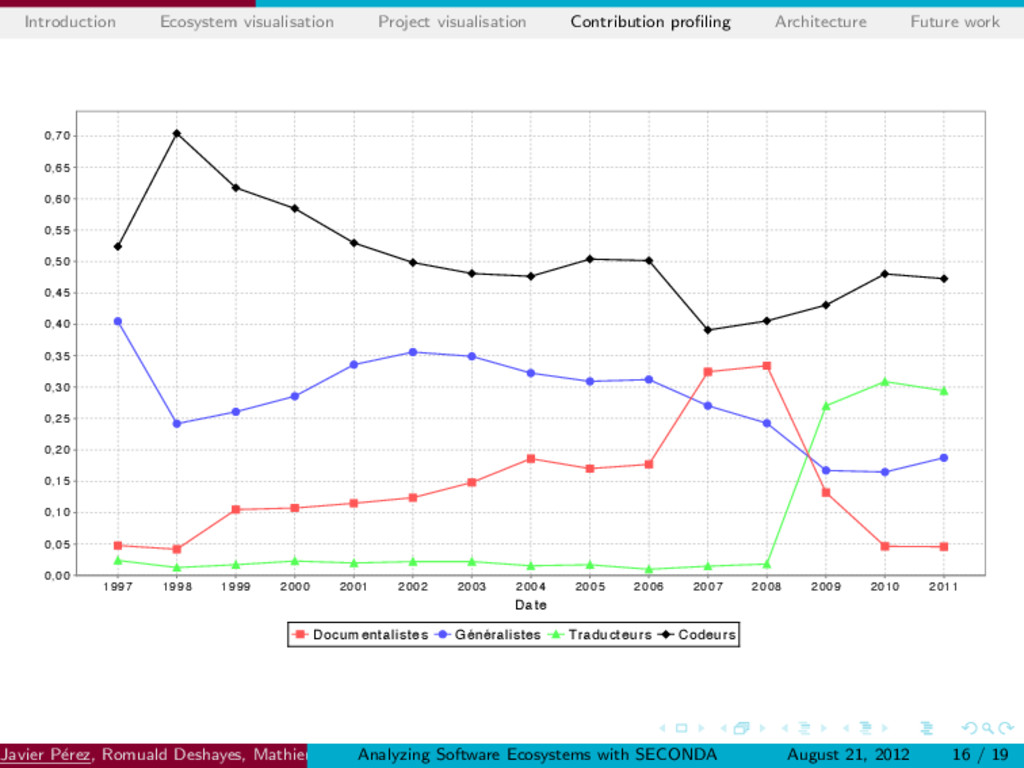
In this presentation we show different findings resulted from analysing the Gnome software ecosystem with SECONDA, a software ecosystem metrics visualisation tool. Presented at SoTeSoLa-SATToSE 2012 (https://github.com/SATToSE/SoTeSoLa2012/wiki/SATToSE-2012).

Javier Pérez

August 20, 2012
Tweet

More Decks by Javier Pérez

Other Decks in Research

Transcript

  1. Analyzing Software Ecosystems with SECONDA Javier P´ erez, Romuald Deshayes,

    Mathieu Goeminne, Dimitri Durieux, Tom Mens Software Engineering Lab. Service de G´ enie Logiciel, Institut d’Informatique Universit´ e de Mons August 21, 2012
  2. Introduction Ecosystem visualisation Project visualisation Contribution profiling Architecture Future work

    Purpose SECONDA integrates a collection of tools aimed at studying software quality by analysing software ecosystems can be used for educational purposes and for experiments Javier P´ erez, Romuald Deshayes, Mathieu Goeminne, Dimitri Durieux, Tom MensSoftware Engineering Lab. (UMONS) Analyzing Software Ecosystems with SECONDA August 21, 2012 2 / 19
  3. Introduction Ecosystem visualisation Project visualisation Contribution profiling Architecture Future work

    Software Ecosystems Javier P´ erez, Romuald Deshayes, Mathieu Goeminne, Dimitri Durieux, Tom MensSoftware Engineering Lab. (UMONS) Analyzing Software Ecosystems with SECONDA August 21, 2012 3 / 19
  4. Introduction Ecosystem visualisation Project visualisation Contribution profiling Architecture Future work

    Gnome Ecosystem Tool is currently tailored to analyze Gnome ecosystem: > 1300 projects > 5000 contributors > one decade (since 1997) development history 2 months < project’s lifetime < 14 years authors committers commits files minimum 1 1 1 25 Q1 3 2 23 61 median 12 9 131 112 Q3 59 46 517 237 maximum 1142 692 35191 7097 mean 62.07 45.78 760.2 252.3 Javier P´ erez, Romuald Deshayes, Mathieu Goeminne, Dimitri Durieux, Tom MensSoftware Engineering Lab. (UMONS) Analyzing Software Ecosystems with SECONDA August 21, 2012 4 / 19
  5. Introduction Ecosystem visualisation Project visualisation Contribution profiling Architecture Future work

    SECONDA Extract Measure Visualise Analyse Projects Environment Developers Community Tools: Data extraction from ecosystem repositories Preprocessing - Identity matching Community member profiling (under integration) Metrics Visualisation Statistics (planned) Reporting (planned) Javier P´ erez, Romuald Deshayes, Mathieu Goeminne, Dimitri Durieux, Tom MensSoftware Engineering Lab. (UMONS) Analyzing Software Ecosystems with SECONDA August 21, 2012 5 / 19
  6. Introduction Ecosystem visualisation Project visualisation Contribution profiling Architecture Future work

    Ecosystem Visualisation General metrics (number of authors, committers, commits, number of files, LOC, ...) Project’s metrics correlation (scatterplots) Programming languages usage distribution (boxplots) Ecosystem metrics distribution (boxplots) Projects’s metrics comparison (spider web charts) Javier P´ erez, Romuald Deshayes, Mathieu Goeminne, Dimitri Durieux, Tom MensSoftware Engineering Lab. (UMONS) Analyzing Software Ecosystems with SECONDA August 21, 2012 6 / 19
  7. Introduction Ecosystem visualisation Project visualisation Contribution profiling Architecture Future work

    Javier P´ erez, Romuald Deshayes, Mathieu Goeminne, Dimitri Durieux, Tom MensSoftware Engineering Lab. (UMONS) Analyzing Software Ecosystems with SECONDA August 21, 2012 7 / 19
  8. Introduction Ecosystem visualisation Project visualisation Contribution profiling Architecture Future work

    Javier P´ erez, Romuald Deshayes, Mathieu Goeminne, Dimitri Durieux, Tom MensSoftware Engineering Lab. (UMONS) Analyzing Software Ecosystems with SECONDA August 21, 2012 8 / 19
  9. Introduction Ecosystem visualisation Project visualisation Contribution profiling Architecture Future work

    Project Visualisation General metrics + complexity metrics for each project revision Visualisation of a project’s file size evolution (histogram + rev. selection) Visualisation of a project’s metrics evolution (boxplot + rev. selection) Javier P´ erez, Romuald Deshayes, Mathieu Goeminne, Dimitri Durieux, Tom MensSoftware Engineering Lab. (UMONS) Analyzing Software Ecosystems with SECONDA August 21, 2012 9 / 19
  10. Introduction Ecosystem visualisation Project visualisation Contribution profiling Architecture Future work

    Javier P´ erez, Romuald Deshayes, Mathieu Goeminne, Dimitri Durieux, Tom MensSoftware Engineering Lab. (UMONS) Analyzing Software Ecosystems with SECONDA August 21, 2012 10 / 19
  11. Introduction Ecosystem visualisation Project visualisation Contribution profiling Architecture Future work

    Total Workload by Type charge de travail est distribuée équitablement ou non pour chaque profil. La métrique proposée pour répondre à cette question est CW, qui présente la charge de travail par profil. Le coefficient Gini, calculé sur ces valeurs, permet de déduire si la dis- tribution de l’effort est équitable ou non en fonction du profil. Codeurs Généralistes Documentalistes Traducteurs Profils 0 200 000 400 000 600 000 800 000 1 000 000 1 200 000 1 400 000 1 600 000 1 800 000 2 000 000 2 200 000 2 400 000 2 600 000 Charge de travail FIGURE 5.1 – La charge de travail par profil pour Gnome Javier P´ erez, Romuald Deshayes, Mathieu Goeminne, Dimitri Durieux, Tom MensSoftware Engineering Lab. (UMONS) Analyzing Software Ecosystems with SECONDA August 21, 2012 11 / 19
  12. Introduction Ecosystem visualisation Project visualisation Contribution profiling Architecture Future work

    Total Contributors by Type leur répartition. La métrique utilisée pour répondre à cette question est NAC, présentant le nombre d’auteurs par profil. Pour calculer le degré d’inégalité, le coefficient de Gini est calculé sur les mesures de NAC. Codeurs Généralistes Traducteurs Documentalistes Profils 0 200 400 600 800 1000 1200 1400 1600 1800 2000 2200 2400 2600 2800 Nombre d'auteurs FIGURE 5.3 – Nombre d’auteurs par profils pour Gnome Javier P´ erez, Romuald Deshayes, Mathieu Goeminne, Dimitri Durieux, Tom MensSoftware Engineering Lab. (UMONS) Analyzing Software Ecosystems with SECONDA August 21, 2012 12 / 19
  13. Introduction Ecosystem visualisation Project visualisation Contribution profiling Architecture Future work

    Distribution of Contributor Types per project Il est possible de comprendre la variation de la distribution des contributeurs en fonction des profils et des projets par l’analyse de la répartition des personnes d’un même projet au sein d’un profil. C odeurs G énéralistes D ocum entalistes Traducteurs 0,00 0,10 0,20 0,30 0,40 0,50 0,60 0,70 0,80 0,90 1,00 Javier P´ erez, Romuald Deshayes, Mathieu Goeminne, Dimitri Durieux, Tom MensSoftware Engineering Lab. (UMONS) Analyzing Software Ecosystems with SECONDA August 21, 2012 13 / 19
  14. Introduction Ecosystem visualisation Project visualisation Contribution profiling Architecture Future work

    Evolution of Workload Types CHAPITRE 5. Étude des profils des contributeurs de Gnome 94 Documentalistes Généralistes Traducteurs Codeurs 1997 1998 1999 2000 2001 2002 2003 2004 2005 2006 2007 2008 2009 2010 2011 Date 0 25 000 50 000 75 000 100 000 125 000 150 000 175 000 200 000 225 000 250 000 Javier P´ erez, Romuald Deshayes, Mathieu Goeminne, Dimitri Durieux, Tom MensSoftware Engineering Lab. (UMONS) Analyzing Software Ecosystems with SECONDA August 21, 2012 14 / 19
  15. Introduction Ecosystem visualisation Project visualisation Contribution profiling Architecture Future work

    Evolution of Contributor Types Pour répondre à cette question, nous proposons d’étudier le nombre de con- tributeurs par profil d’année en année. Pour ce faire, les mesures de la métrique NACY sont calculées et comparées à l’aide du coefficient de corrélation r voire, si nécessaire, le coefficient de corrélation ⇢. Documentalistes Généralistes Traducteurs Codeurs 1997 1998 1999 2000 2001 2002 2003 2004 2005 2006 2007 2008 2009 2010 2011 Date 0 5 0 100 150 200 250 300 350 400 450 500 550 600 650 700 750 800 850 900 950 FIGURE 5.9 – Evolution du nombre d’auteurs par profil et par an pour Gnome Javier P´ erez, Romuald Deshayes, Mathieu Goeminne, Dimitri Durieux, Tom MensSoftware Engineering Lab. (UMONS) Analyzing Software Ecosystems with SECONDA August 21, 2012 15 / 19
  16. Introduction Ecosystem visualisation Project visualisation Contribution profiling Architecture Future work

    mesures de la métrique RNCY sont calculées et comparées à l’aide du coefficient de corrélation r voire, si nécessaire, le coefficient de corrélation ⇢. Documentalistes Généralistes Traducteurs Codeurs 1997 1998 1999 2000 2001 2002 2003 2004 2005 2006 2007 2008 2009 2010 2011 Date 0,00 0,05 0,10 0,15 0,20 0,25 0,30 0,35 0,40 0,45 0,50 0,55 0,60 0,65 0,70 FIGURE 5.11 – Variation de la répartition des auteurs dans les profils par année Javier P´ erez, Romuald Deshayes, Mathieu Goeminne, Dimitri Durieux, Tom MensSoftware Engineering Lab. (UMONS) Analyzing Software Ecosystems with SECONDA August 21, 2012 16 / 19
  17. Introduction Ecosystem visualisation Project visualisation Contribution profiling Architecture Future work

    SECONDA architecture overview Javier P´ erez, Romuald Deshayes, Mathieu Goeminne, Dimitri Durieux, Tom MensSoftware Engineering Lab. (UMONS) Analyzing Software Ecosystems with SECONDA August 21, 2012 17 / 19
  18. Introduction Ecosystem visualisation Project visualisation Contribution profiling Architecture Future work

    Future Work Contributor profiling module (integrate it into the main tool) Statistics module Reporting module More individual developer metrics Other ecosystems (KDE, Eclipse, . . . ) Incremental and automatic data extraction and analysis Support for other data sources (repositories, bug trackers, mailing lists, dev. fora) . . . Suggestions? Javier P´ erez, Romuald Deshayes, Mathieu Goeminne, Dimitri Durieux, Tom MensSoftware Engineering Lab. (UMONS) Analyzing Software Ecosystems with SECONDA August 21, 2012 18 / 19
  19. Analyzing Software Ecosystems with SECONDA Javier P´ erez, Romuald Deshayes,

    Mathieu Goeminne, Dimitri Durieux, Tom Mens Software Engineering Lab. Service de G´ enie Logiciel, Institut d’Informatique Universit´ e de Mons August 21, 2012