Upgrade to Pro — share decks privately, control downloads, hide ads and more …

A survey on software quality practice - Pilot study in the Walloon region

A survey on software quality practice - Pilot study in the Walloon region

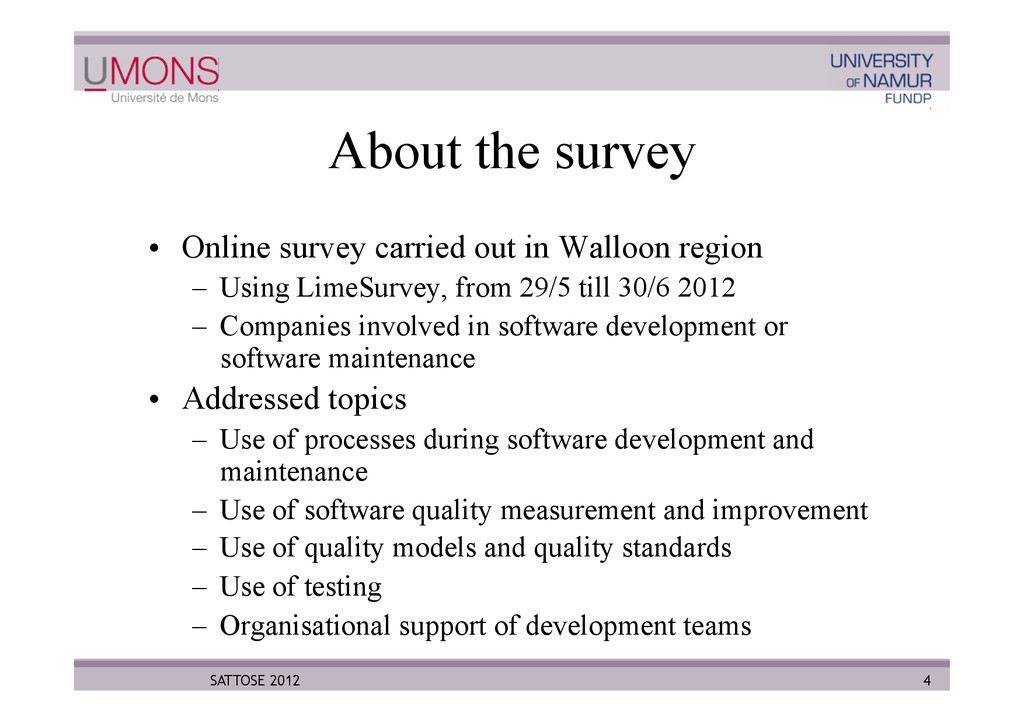
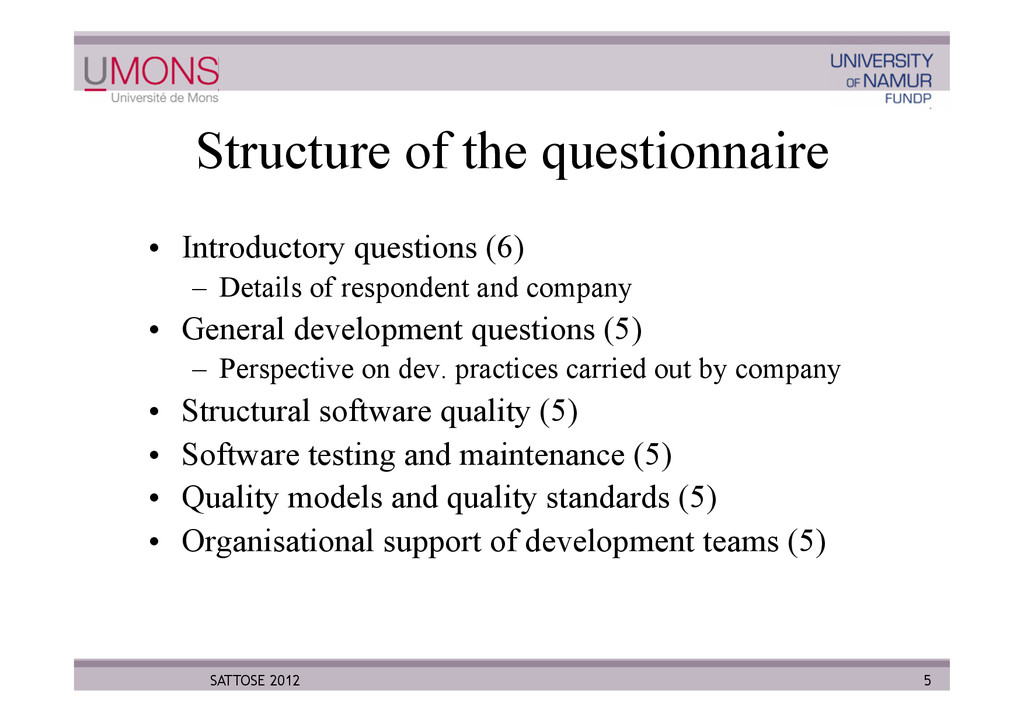
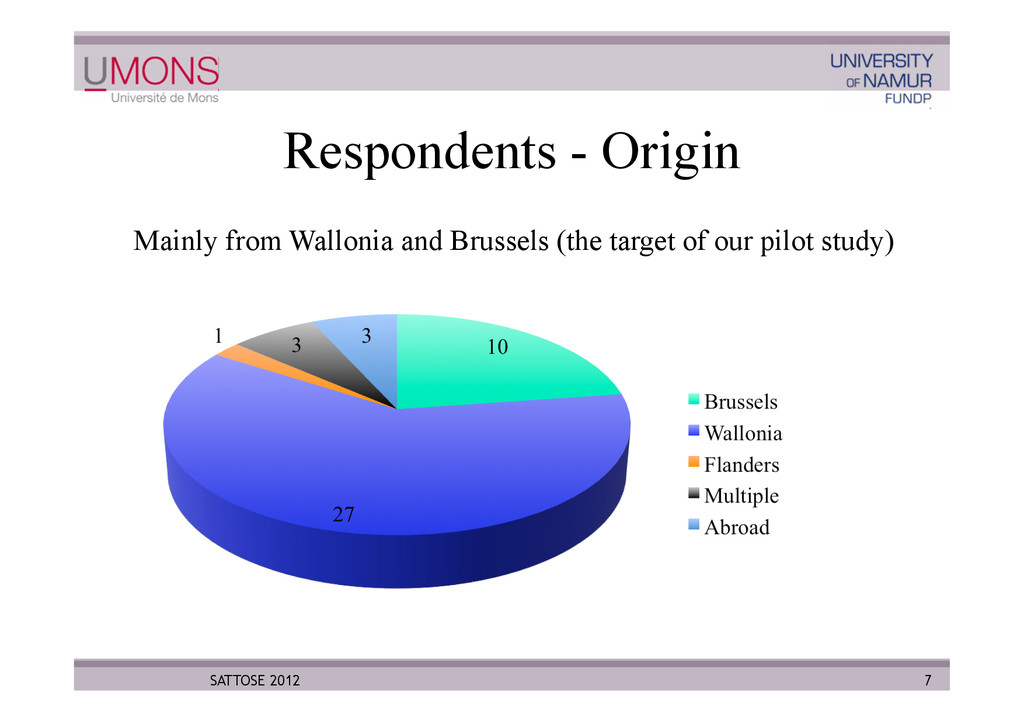
As part of a European ERDF project, we carried out a survey at Walloon software-producing companies to explore to which extent they use software development practices related to software quality. The survey is developed in a way that is easy to replicate, so that it can be repeated and extended with results from companies in other regions and countries. In this presentation, we report on the results of the survey, with respondents from about 60 companies in the Walloon region of Belgium. The survey targets the following high-level questions (subdivided in numerous subquestions):

What are the quality-related techniques most widely in the software development industry?

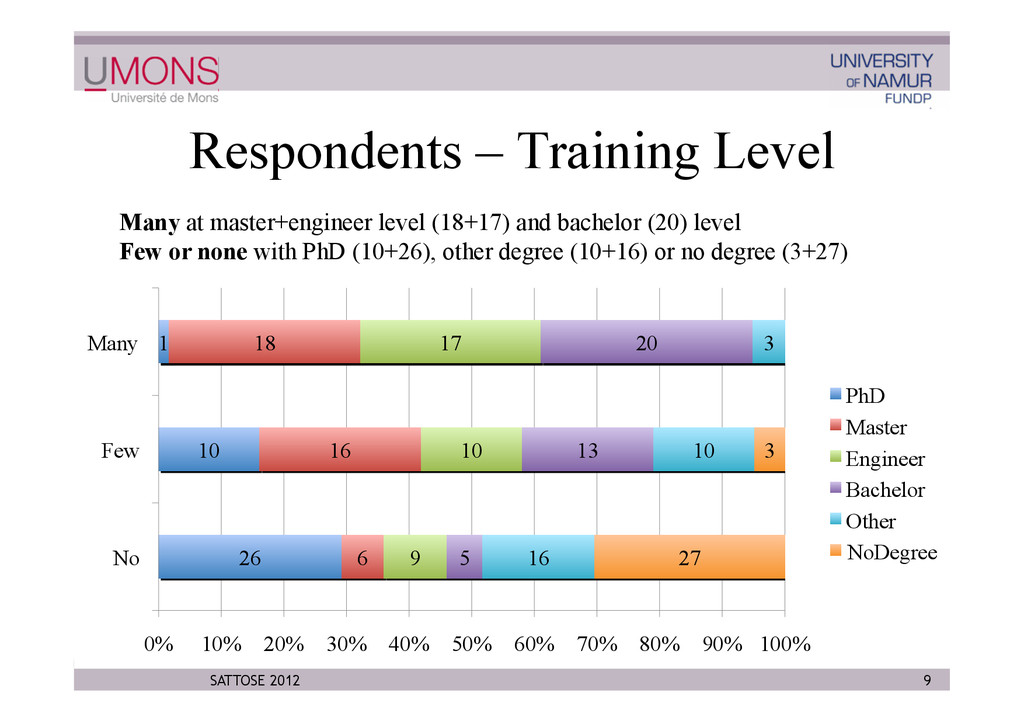
What are the main factors (usage of tools, standards, ...) determining the quality of the software product and software process? By analyzing the answers to these questions, we aim to get a better understanding in the level of training of software engineers working in industry, and we wish to get feedback on whether academic software engineering courses need to be adapted to better fit the actual industry needs. Presented at SoTeSoLa-SATToSE 2012 (https://github.com/SATToSE/SoTeSoLa2012/wiki/SATToSE-2012)

Javier Pérez

August 21, 2012
Tweet

More Decks by Javier Pérez

Other Decks in Research

Transcript

  1. A survey on software quality practice - Pilot study in

    the Walloon region Javier Perez, Tom Mens, Service de Génie Logiciel, Université de Mons Flora Kamseu, Naji Habra, PRECISE lab, FUNDP Presented at SATToSE seminar University of Koblenz, August 2012 SATTOSE 2012
  2. Context •  Portefeuille TIC –  ERDF project lead by CETIC

    (2007-2013) •  CEIQS: Center of expertise in engineering and quality of systems –  aimed at developing a portfolio of innovative techniques allowing local companies to master the diversity, complexity, quality and rapid evolution of information systems •  workpackage QUALGEN –  collaboration between FUNDP and UMONS since 2010 –  Supported by Wallonia 2 SATTOSE 2012
  3. 3 SATTOSE 2012 Objectives •  Explore how quality-related software development

    practice is being performed in industry •  Compare this across different regions and countries •  Relates this to what is being taught in academia –  Is there a gap between teaching and industry needs? –  What good methodologies, practices, tools are not being used and why?
  4. About the survey •  Online survey carried out in Walloon

    region –  Using LimeSurvey, from 29/5 till 30/6 2012 –  Companies involved in software development or software maintenance •  Addressed topics –  Use of processes during software development and maintenance –  Use of software quality measurement and improvement –  Use of quality models and quality standards –  Use of testing –  Organisational support of development teams 4 SATTOSE 2012
  5. Structure of the questionnaire •  Introductory questions (6) –  Details

    of respondent and company •  General development questions (5) –  Perspective on dev. practices carried out by company •  Structural software quality (5) •  Software testing and maintenance (5) •  Quality models and quality standards (5) •  Organisational support of development teams (5) 5 SATTOSE 2012
  6. Respondents – Number –  Initial mailing sent out to 145

    companies –  71 responses out of 188 contacted respondents •  Response rate 37,8% –  Responses from 47 different companies •  Multiple responses from same companies were aggregated into a single one –  Incomplete responses were ignored –  44 fully completed questionnaires kept for analysis •  Corresponds to 62% of received responses 6 SATTOSE 2012
  7. Respondents - Origin 7 SATTOSE 2012 Mainly from Wallonia and

    Brussels (the target of our pilot study)
  8. Respondents – Company size 8 SATTOSE 2012 Good balance between

    company size (number of employees) of respondents
  9. Respondents – Training Level 9 SATTOSE 2012 Many at master+engineer

    level (18+17) and bachelor (20) level Few or none with PhD (10+26), other degree (10+16) or no degree (3+27) 26 10 1 6 16 18 9 10 17 5 13 20 16 10 3 27 3 0% 10% 20% 30% 40% 50% 60% 70% 80% 90% 100% No Few Many PhD Master Engineer Bachelor Other NoDegree
  10. Process – Dev. process support •  Use of a well-defined

    and well-documented development process? 45,5% –  No: 19 –  Yes: 20 (agile or scrum, Prince 2, RUP, ISO certification, proprietary) –  Don’t know: 5 •  Use of agile practices or methods? 63,6% –  No: 12 –  Yes: 28 (17 mention SCRUM, 2 mention Prince2) –  Don’t know: 4 10 SATTOSE 2012
  11. Process - change or configuration management process 11 SATTOSE 2012

    Use of change or configuration management process is highly popular 73,8% (31/42)
  12. Process - perceived importance factors for software project success 12

    SATTOSE 2012 •  Rated from (1) not important to (5) essential 1 2 3 4 5 Quality assurance Testing Average : 4 4,2
  13. Process - Creation and modification of software artefacts 14 SATTOSE

    2012 Are arch. descr. (36,4%) and design models (39,5%) being evolved?
  14. Tools - Use of integrated platform for 15 SATTOSE 2012

    Version control (97,6%) and bug tracking (92,7%) well established Platforms for continuous integration (57,1%), configuration (55,6%) and testing (60,5%) a bit less
  15. Tools - Programming languages used 16 SATTOSE 2012 OO languages

    most popular (Java, C#, C++), followed by scripting languages. SQL and Cobol legacy also remains important.
  16. Tools - Development environments used 17 SATTOSE 2012 Dichotomy between

    Java and .Net visible at IDE level. Many others but much less frequently used.
  17. Tools - support for design models, documentation and code synchro

    •  Very basic –  Visio (10), Word (8), Sparx Enterprise Architect (5), Doxygen (3), StarUML (2), Confluence (2) and many others –  Little use of UML modeling tools •  Little or no support for model-code synchronisation 18 SATTOSE 2012
  18. Quality - Use of design patterns 19 SATTOSE 2012 Use

    of design patterns is highly popular 72,7% (32/44)
  19. Quality - Use of quality improvement techniques 20 SATTOSE 2012

    Often or continuously 36,6% (15/41) 42,9% (18/42) 35,7% (15/42) 58,5% (24/41) Only moderately popular (35,7%<x<43%) except for refactoring (58,5%)
  20. Use of quality support continued 21 SATTOSE 2012 Poor support

    for quality (no quality tools, processes or models) 36,8% (14/38) 32,4% (12/37) 19,4% (7/36)
  21. Popularity of quality improvement techniques •  Most popular   Version

    control 97,6% and bug tracking 92,7% platforms   Change and configuration management: 73,8%  Design patterns: 72,7%   Refactoring: 58,5% •  Less popular  Design improvement (e.g. code smell reduction): 42,9%  Bad quality detection tools: 36,8%  Metrics and visualisation tools: 35,7%   Dynamic analysis tools (profiling etc.): 36,6%   Quality support or improvement process: 32,4% •  Unpopular  Use of a quality model: 19,4% 22 SATTOSE 2012
  22. Reuse of libraries, components and platforms 23 SATTOSE 2012 Reuse

    is highly successful 86% from own company 75% from open source 60% from other companies (excluding “don’t know” results)
  23. Testing - Use of test process 24 SATTOSE 2012 Testing

    is done by nearly all respondents (97,7%), but test process used by only 46,5% of the respondents
  24. Testing – development time spent 3 12 16 9 3

    0 2 4 6 8 10 12 14 16 18 t<5% 5%<t<15% 15%<t<25% 25%<t unknown 25 SATTOSE 2012
  25. Testing - tool support •  Very varied –  Mostly unit

    testing frameworks (8) –  Others: Mantis (4), HP Quality Center (4), Selenium (3), Hudson (2), Jenkins (2), Quick Test Pro (2), and many more 26 SATTOSE 2012
  26. Preliminary conclusions •  Wide range of respondents, from very small

    to big companies, using many different programming languages and development environments •  Strong points –  All respondents believe that quality assurance and testing are very important for project success –  Wide use of testing (97,7%), agile practices (63,6%), design patterns (72,9%) and refactoring (56,5%) –  High level of reuse of components/libraries/platforms (60% to 86% depending on source of reuse) 27 SATTOSE 2012
  27. Preliminary conclusions •  Weak points –  Mitigated success of processes

    •  development processes (45,5%), test processes (46,5%), quality support/improvement process (32,4%), quality models (19,4%) •  Exception: change management process (73,8%) 28 SATTOSE 2012
  28. Preliminary conclusions •  Weak points –  Mitigated success of static

    and dynamic code analysis tools for detecting quality issues, visualisation, computing metrics, profiling, etc… (popularity between 35% and 43%) –  Does not reflect the high perceived importance of quality assurance for software project success 29 SATTOSE 2012
  29. What’s next? •  Analyse results in more detail –  Correlate

    results to company size and training level •  Are bigger companies more process-driven and smaller ones more agile? Does training level play a role? •  Report on the results •  Repeat the study in other countries –  Identify regional or national trends –  Compare differences and commonalities –  We need your help here! 30 SATTOSE 2012 studies
  30. Collaborative study •  Research 2.0 –  Carry out follow-up /

    more narrow studies –  Carry out this study as a collaborative community effort? •  Store / share / reuse our data with others –  Which format/platform/… to use? •  Have a working session on this topic during SATTOSE/SOTESOLA? 31 SATTOSE 2012