Learning Genome Structrues From De Novo Assembly and Long-read Mapping
Presented in GRC workshop before Genome Informatics Meeting 2014. Some examples about analyzing assembly graph to find unusual spots in a genome and centromere repeat characterization with long reads
of California, Inc. All rights reserved. For Research Use Only. Not for use in diagnostic procedures. Jason Chin (@infoecho) / Sept. 20 2014, GRC Workshop, Cambridge, UK Learning Genomic Structures From De Novo Assembly and Long-read Mapping de novol
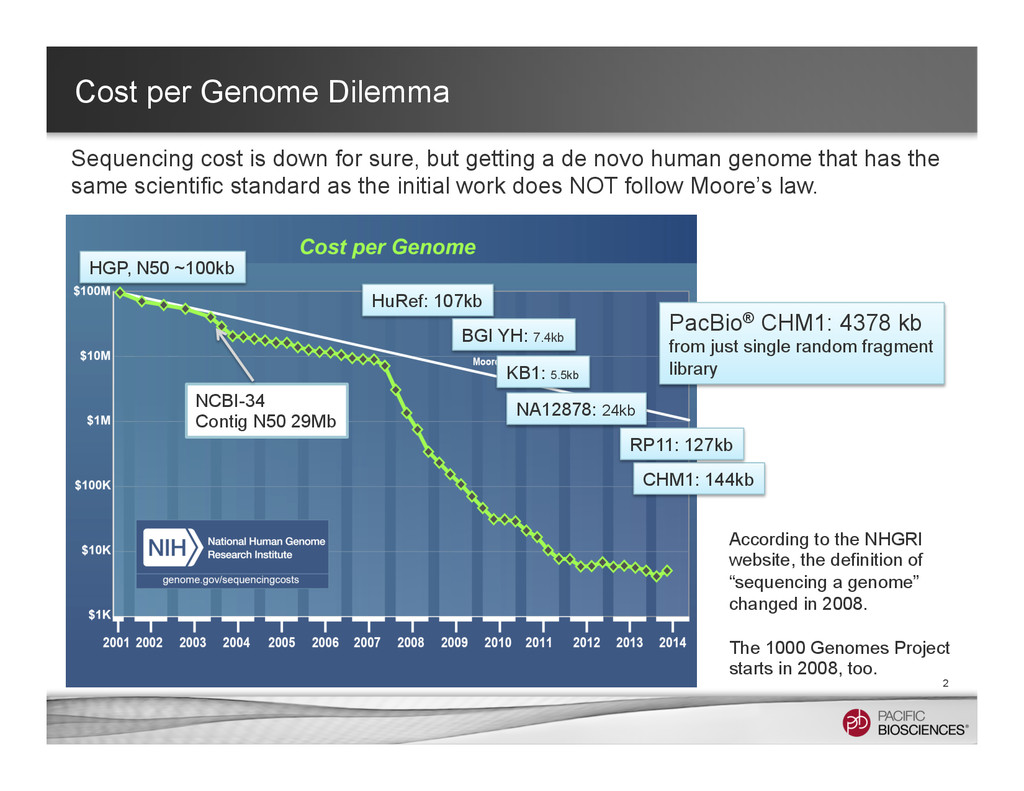
sure, but getting a de novo human genome that has the same scientific standard as the initial work does NOT follow Moore’s law. PacBio® CHM1: 4378 kb from just single random fragment library HGP, N50 ~100kb NCBI-34 Contig N50 29Mb HuRef: 107kb BGI YH: 7.4kb KB1: 5.5kb NA12878: 24kb CHM1: 144kb RP11: 127kb According to the NHGRI website, the definition of “sequencing a genome” changed in 2008. The 1000 Genomes Project starts in 2008, too.
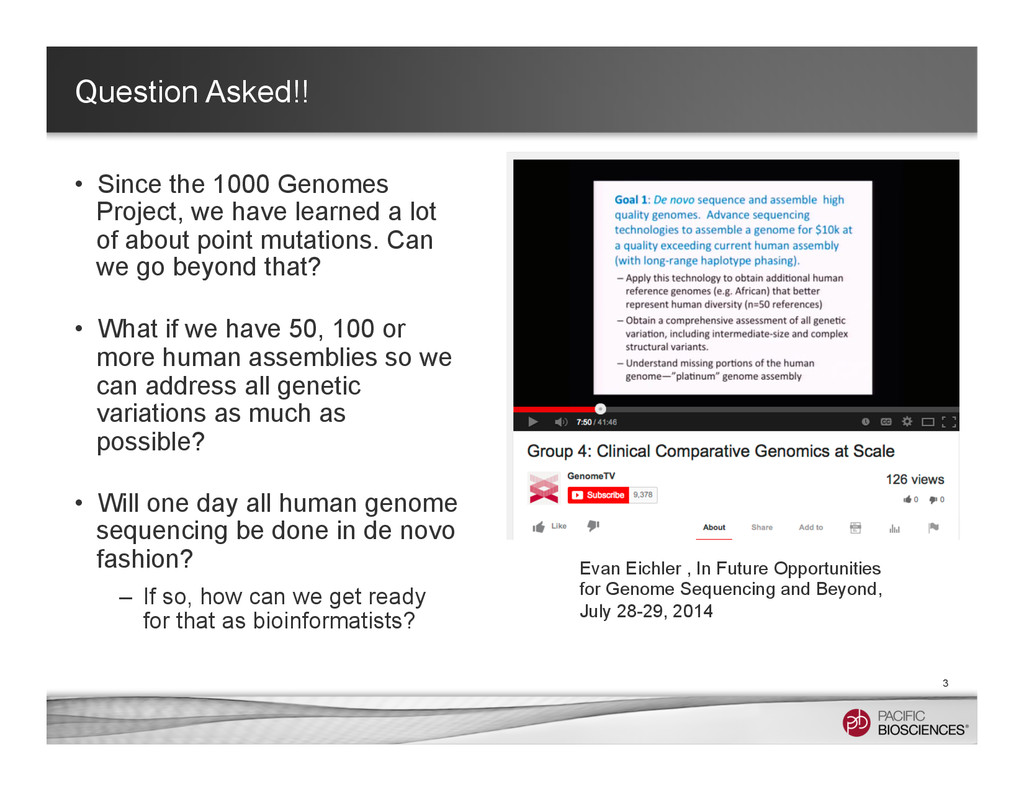
learned a lot of about point mutations. Can we go beyond that? • What if we have 50, 100 or more human assemblies so we can address all genetic variations as much as possible? • Will one day all human genome sequencing be done in de novo fashion? – If so, how can we get ready for that as bioinformatists? 3 Evan Eichler , In Future Opportunities for Genome Sequencing and Beyond, July 28-29, 2014
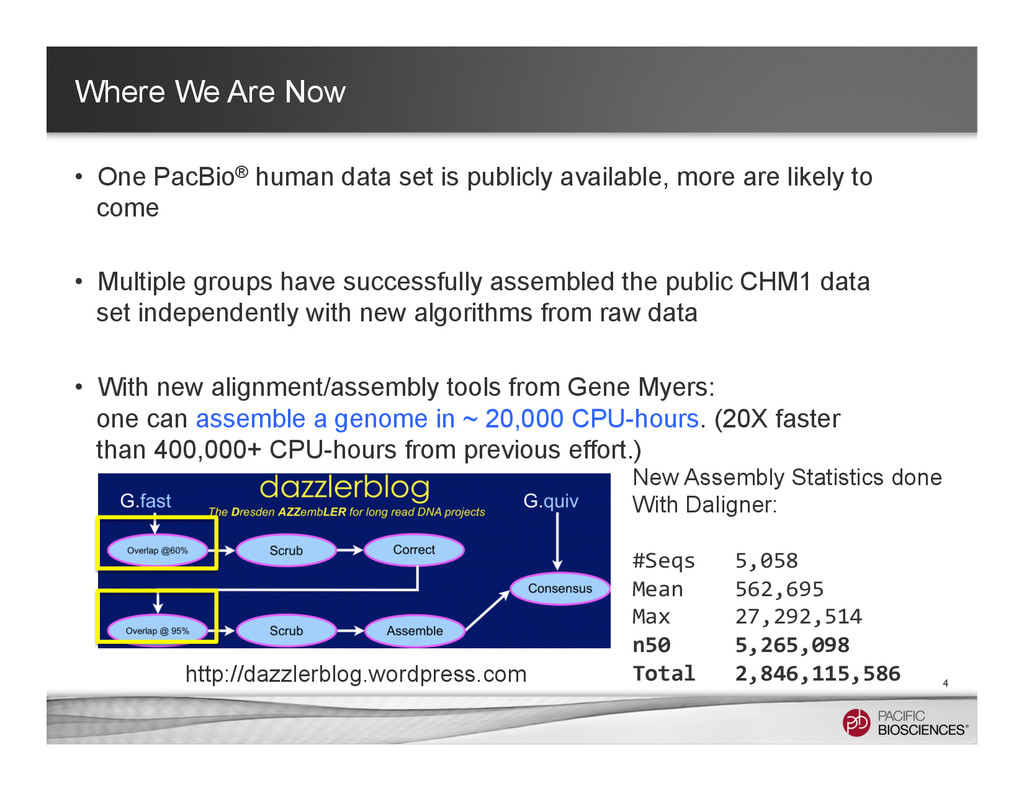
is publicly available, more are likely to come • Multiple groups have successfully assembled the public CHM1 data set independently with new algorithms from raw data • With new alignment/assembly tools from Gene Myers: one can assemble a genome in ~ 20,000 CPU-hours. (20X faster than 400,000+ CPU-hours from previous effort.) 4 New Assembly Statistics done With Daligner: #Seqs 5,058 Mean 562,695 Max 27,292,514 n50 5,265,098 Total 2,846,115,586 http://dazzlerblog.wordpress.com
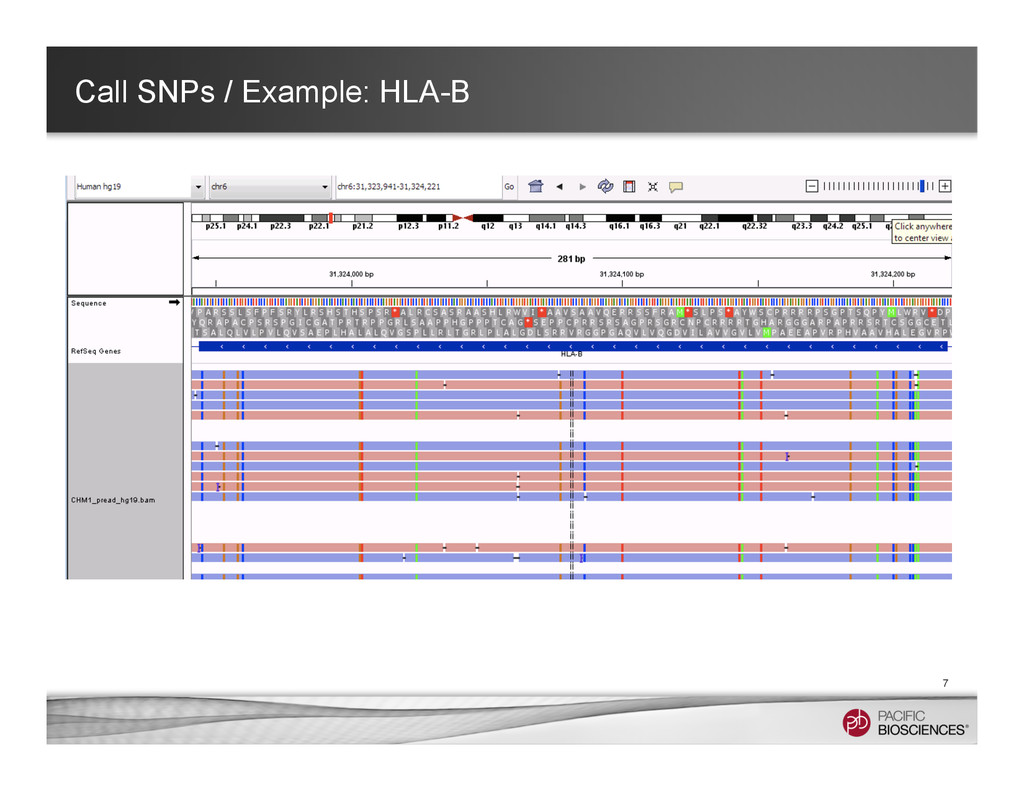
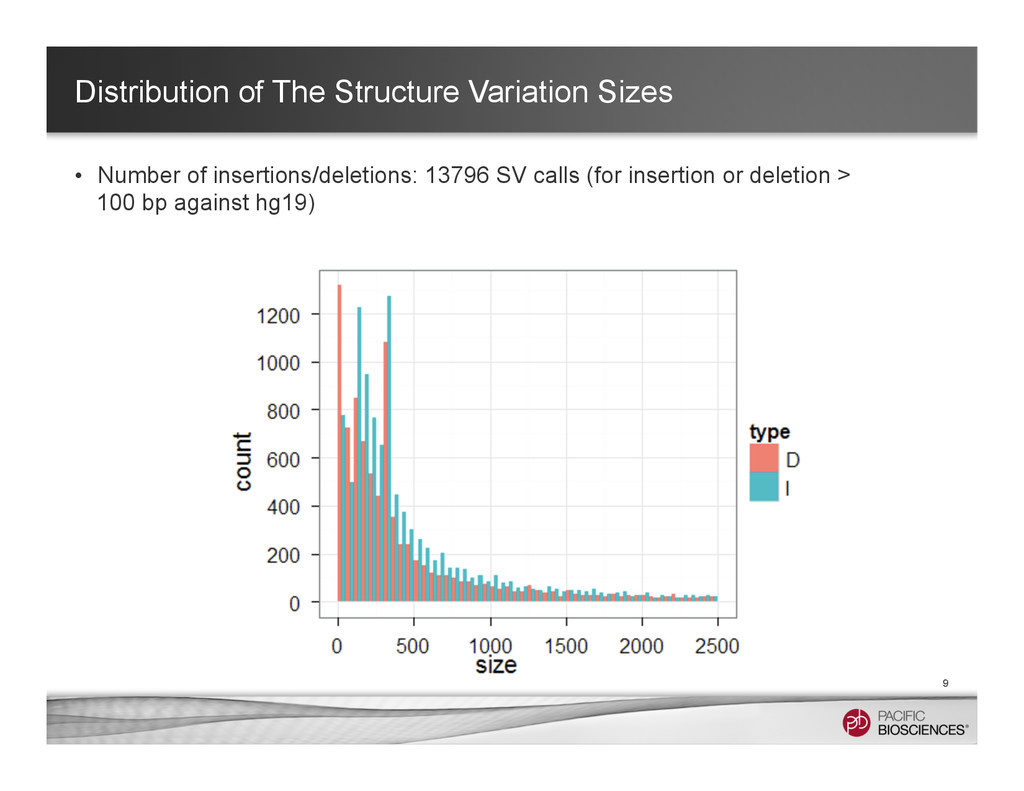
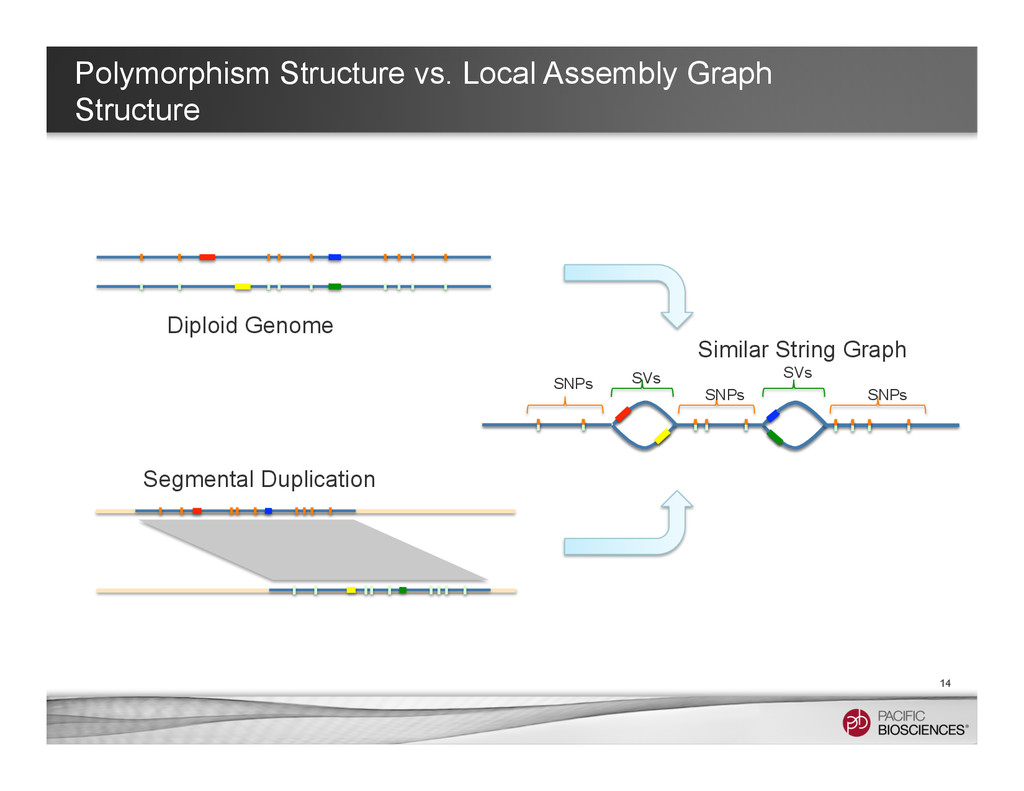
Fruits – Calling SNPs (assembly not needed, but it helps) – Calling structure variants with whole-genome alignment approaches – Inferring repeats by coverage analysis • Assembly graph can provide information for understanding more complicated polymorphisms 6
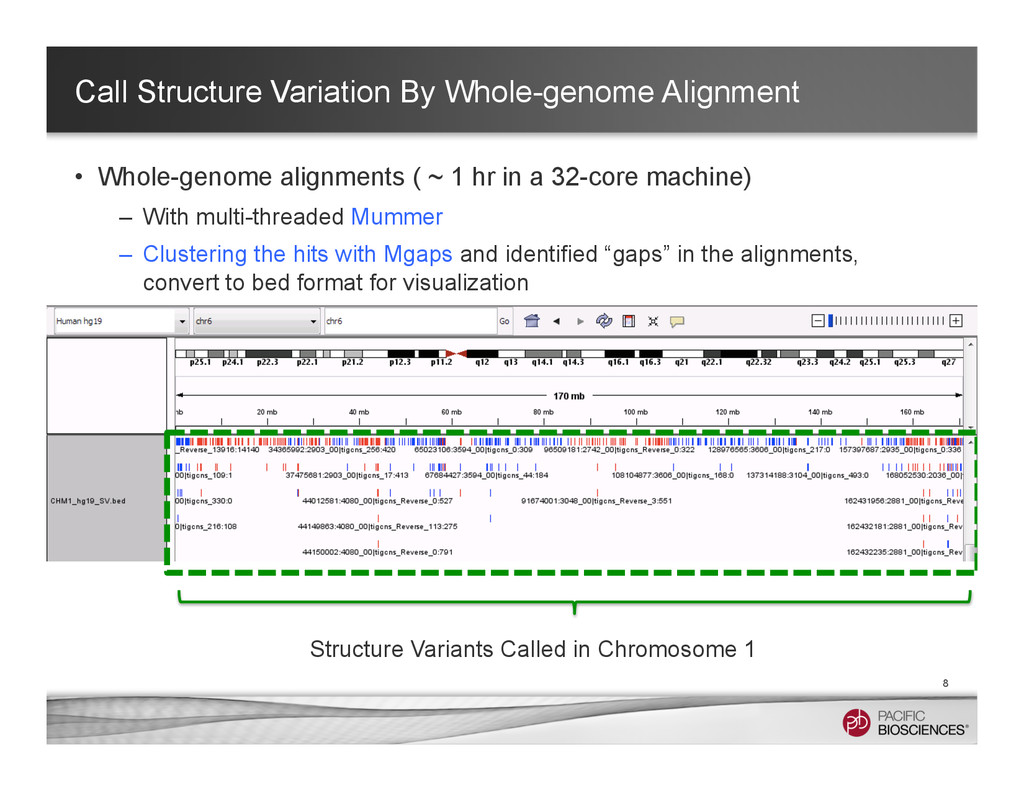
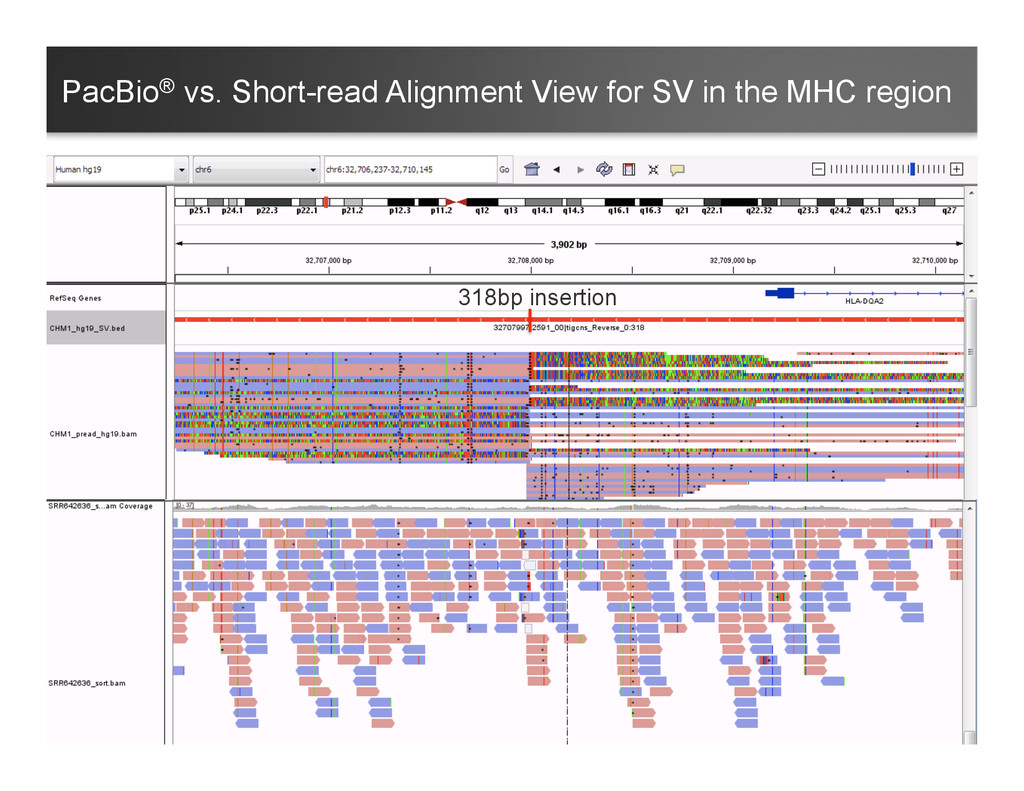
~ 1 hr in a 32-core machine) – With multi-threaded Mummer – Clustering the hits with Mgaps and identified “gaps” in the alignments, convert to bed format for visualization 8 Structure Variants Called in Chromosome 1
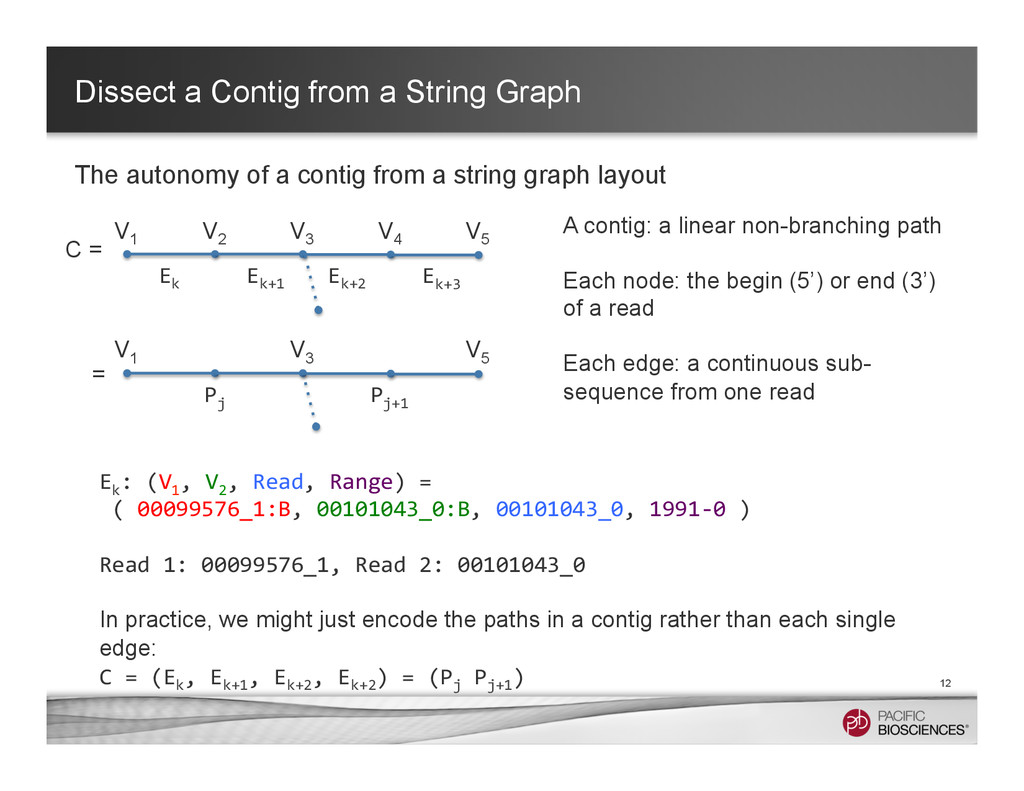
a contig from a string graph layout 12 A contig: a linear non-branching path Each node: the begin (5’) or end (3’) of a read Each edge: a continuous sub- sequence from one read Ek : (V1 , V2 , Read, Range) = ( 00099576_1:B, 00101043_0:B, 00101043_0, 1991-‐0 ) Read 1: 00099576_1, Read 2: 00101043_0 In practice, we might just encode the paths in a contig rather than each single edge: C = (Ek , Ek+1 , Ek+2 , Ek+2 ) = (Pj Pj+1 ) V1 V2 V3 V4 V5 Ek Ek+1 Ek+2 Ek+3 V1 V3 V5 Pj Pj+1 C = =
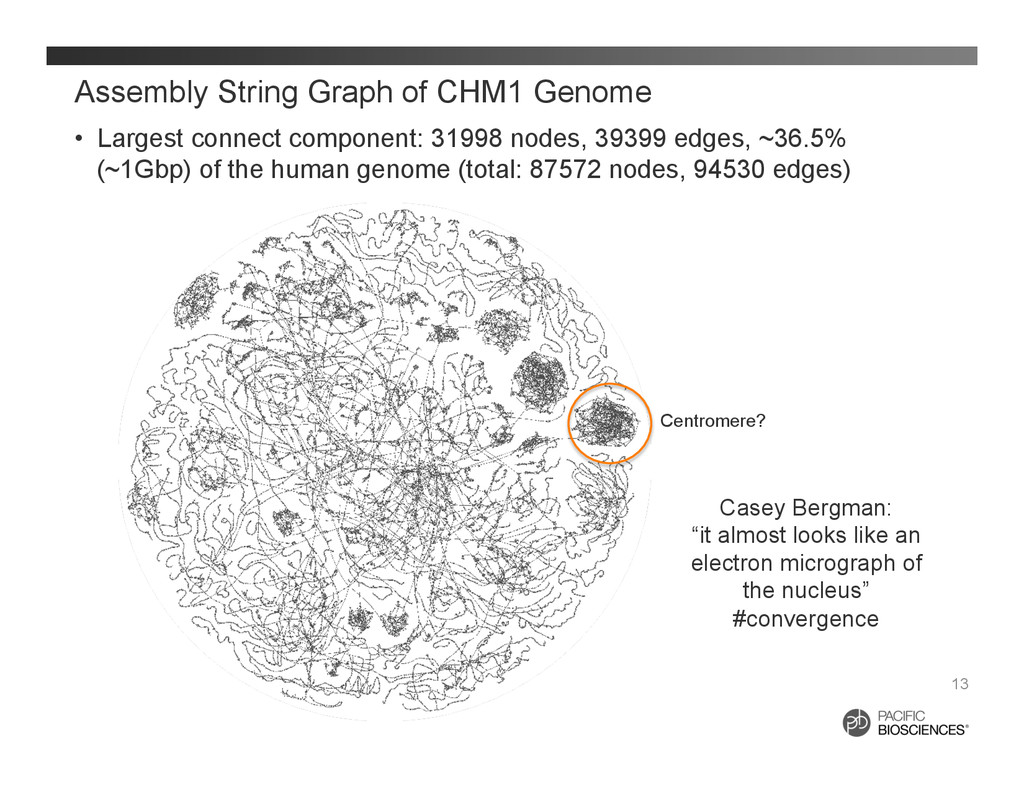
31998 nodes, 39399 edges, ~36.5% (~1Gbp) of the human genome (total: 87572 nodes, 94530 edges) 13 Centromere? Casey Bergman: “it almost looks like an electron micrograph of the nucleus” #convergence
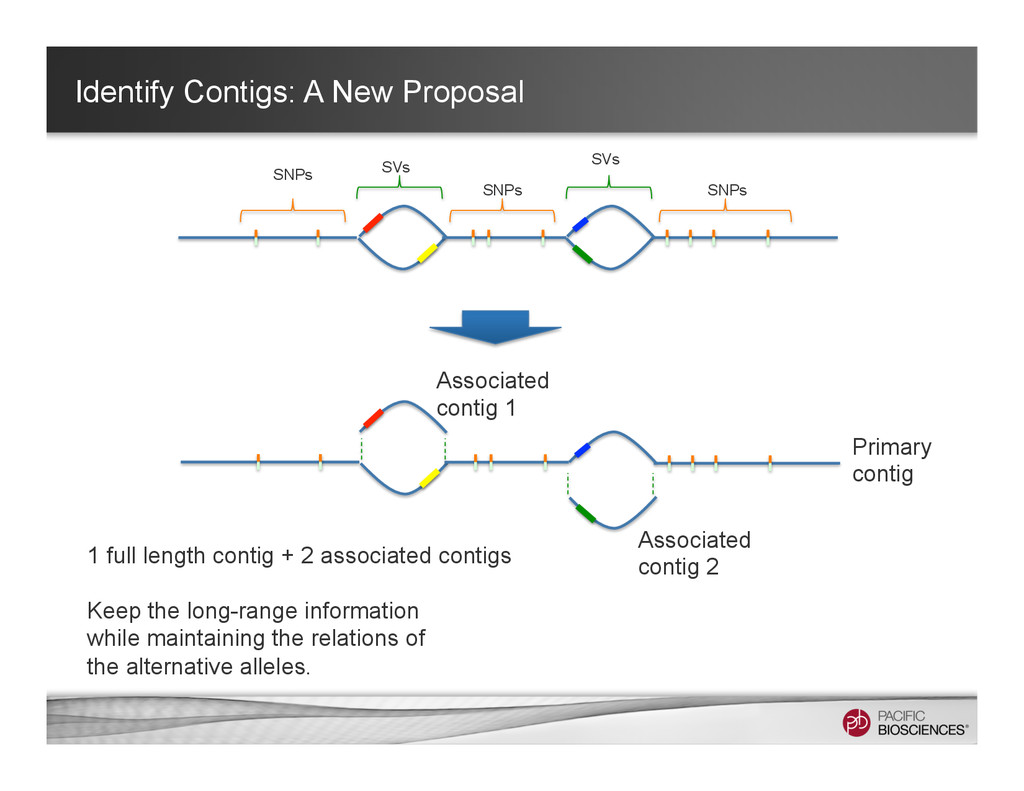
Associated contig 1 Associated contig 2 Primary contig 1 full length contig + 2 associated contigs Keep the long-range information while maintaining the relations of the alternative alleles.
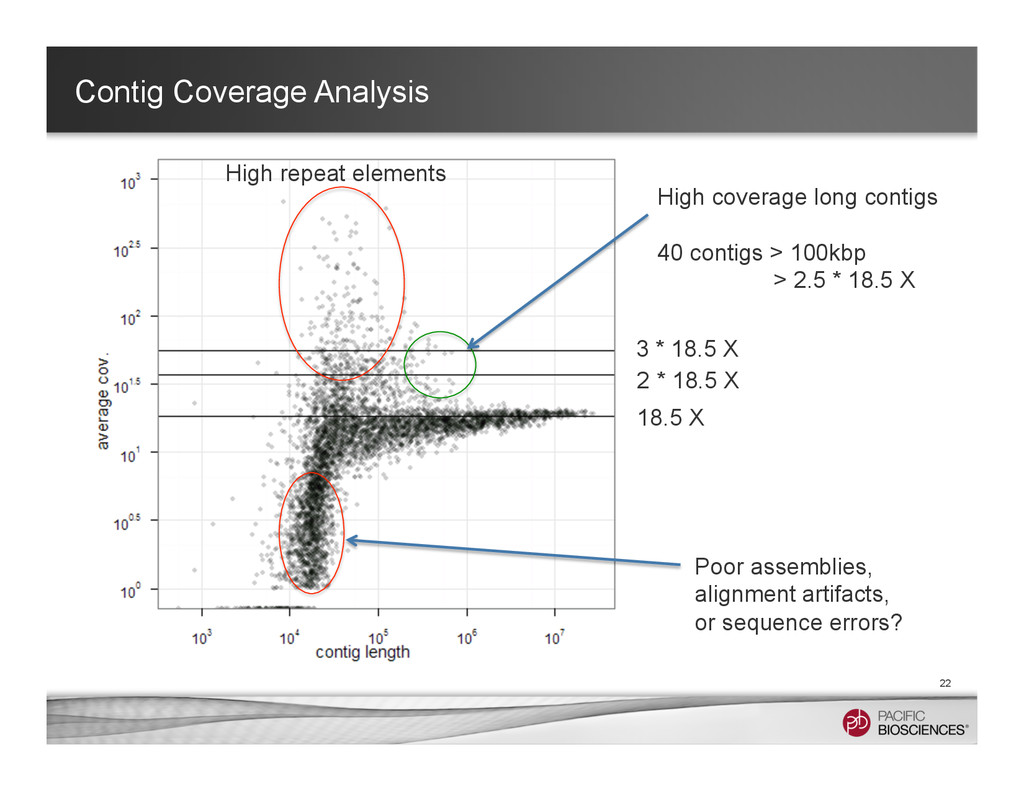
3 * 18.5 X High coverage long contigs 40 contigs > 100kbp > 2.5 * 18.5 X Poor assemblies, alignment artifacts, or sequence errors? High repeat elements
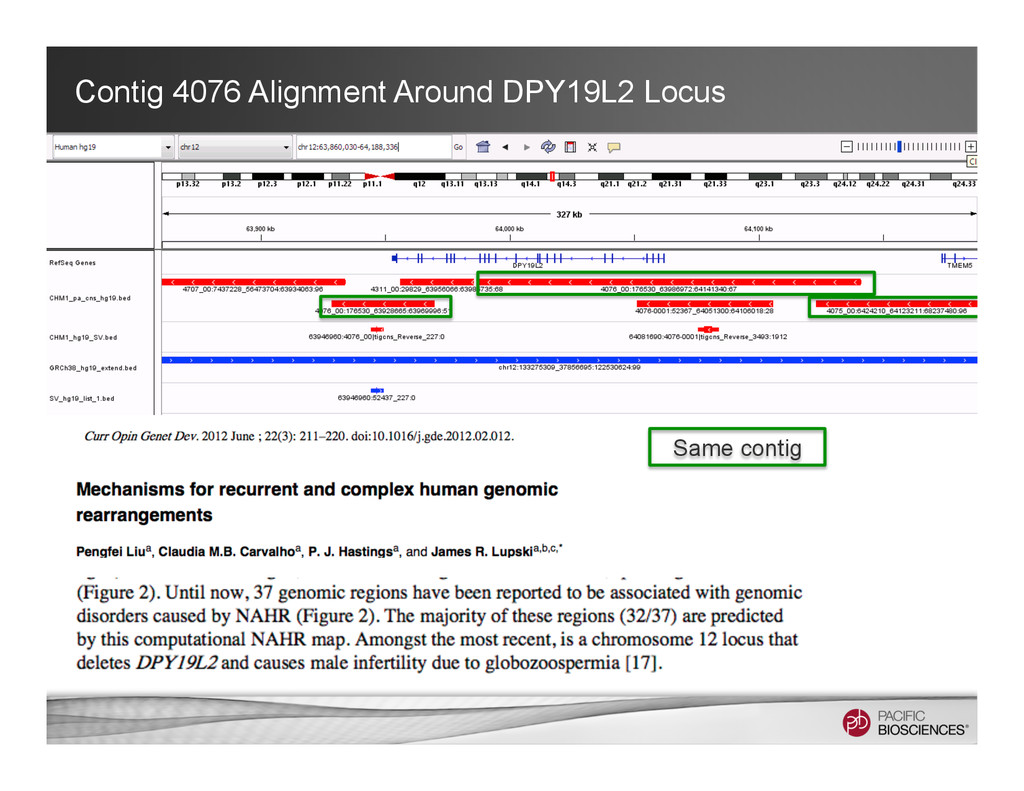
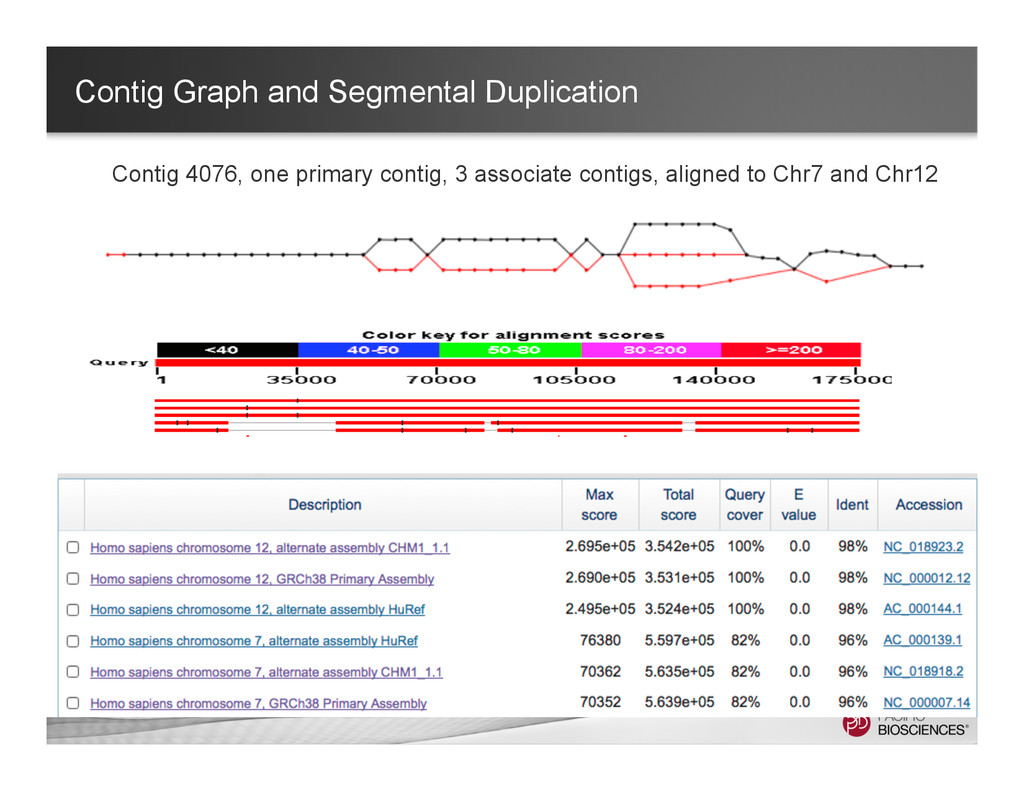
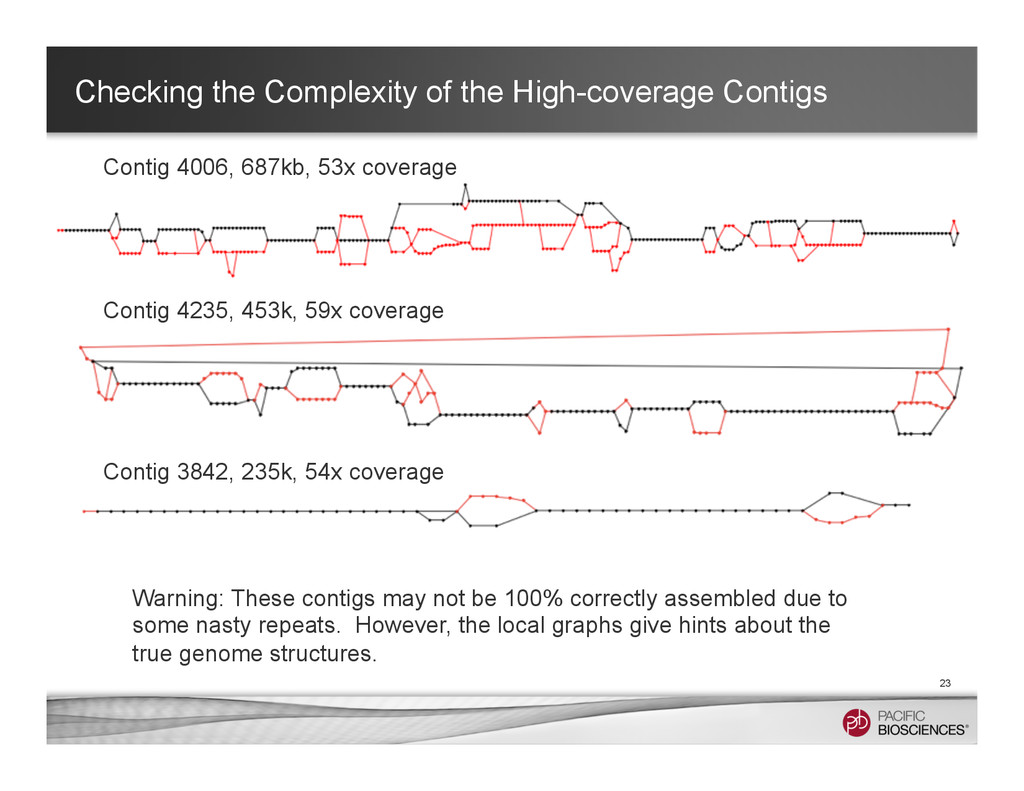
687kb, 53x coverage Contig 4235, 453k, 59x coverage Contig 3842, 235k, 54x coverage Warning: These contigs may not be 100% correctly assembled due to some nasty repeats. However, the local graphs give hints about the true genome structures.
graphs are around the centromere. Currently, it remains hard to get long contigs around those very long tandem repeats. • However, we can still learn many useful things from long-read data • Tool In Development: α-Centauri for identifying different high-order repeat structures (https://github.com/volkansevim/alpha-CENTAURI, Volkan Sevim, Ali Bashir & Karen Miga ) 27
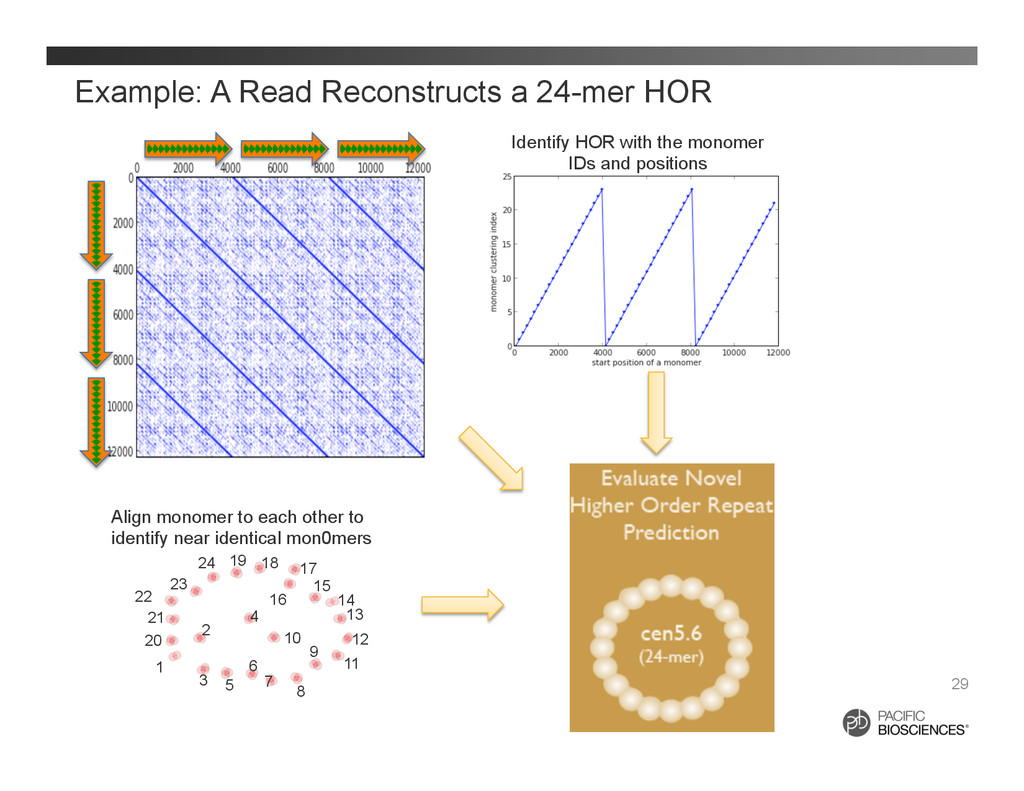
to each other to identify near identical mon0mers Identify HOR with the monomer IDs and positions 1 2 3 4 5 6 7 8 9 10 11 12 13 14 15 16 17 18 19 20 21 22 23 24
analysis • Phasing for haplotypes • Crowd-sourcing infrastructure for examining / annotating / correcting genome assemblies • Evaluation about SNPs calling with short reads on better assembly • Large-scale comparative genomes with de novo assemblies • Assembly-graph data format • Visualization Techniques • Combining other data types, e.g. optical mapping 30 It is a very exciting time. We still need more tools to harvest information to generate new knowledge.
Pacific Biosciences, the Pacific Biosciences logo, PacBio, SMRT, SMRTbell and Iso-Seq are trademarks of Pacific Biosciences in the United States and/or other countries. All other trademarks are the sole property of their respective owners. 31