Upgrade to Pro — share decks privately, control downloads, hide ads and more …

Finding a Needle in a Call Stack - Intro to Distributed Tracing

Finding a Needle in a Call Stack - Intro to Distributed Tracing

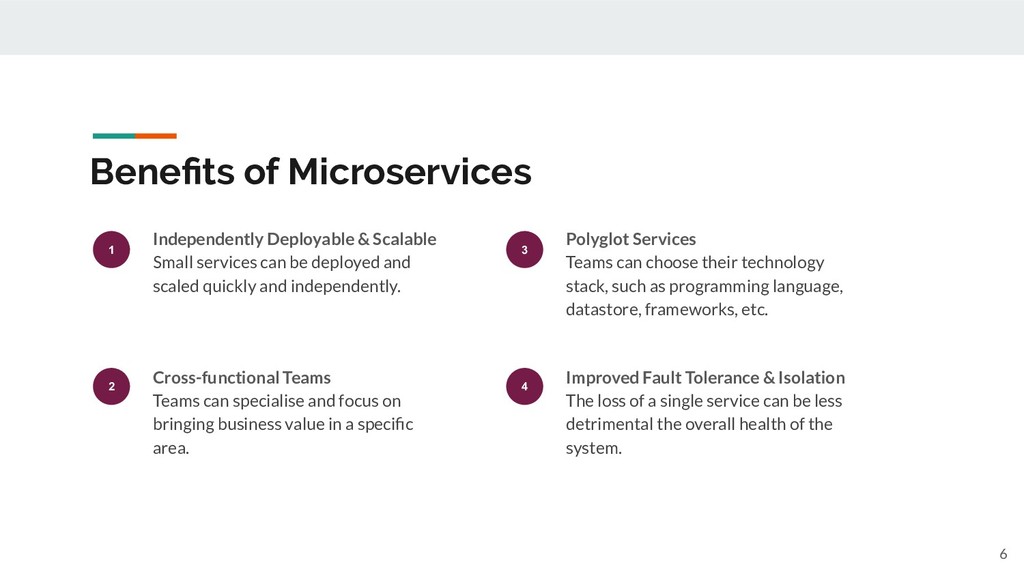
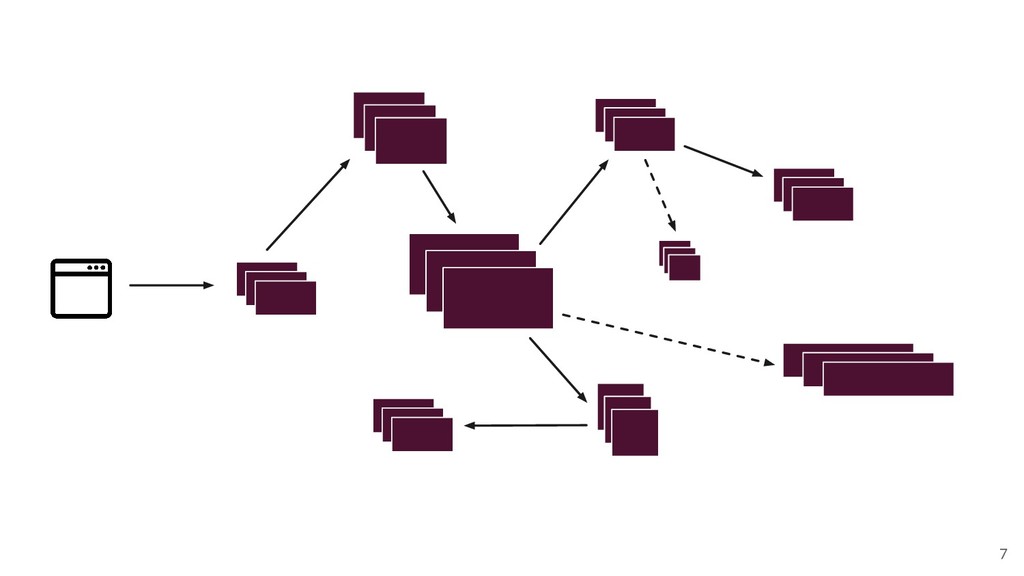
Microservices have transformed the way we think about software architecture and design. They enable developers to rapidly extend application functionality in the form of additional services, each of which can be scaled and deployed independently. Many highly successful software companies such as Netflix, Amazon, and Airbnb, have thousands of interconnected services which form the foundation of their products. These services often communicate over HTTP - passing messages between each other, synchronously and asynchronously, sometimes via message queues or brokers.

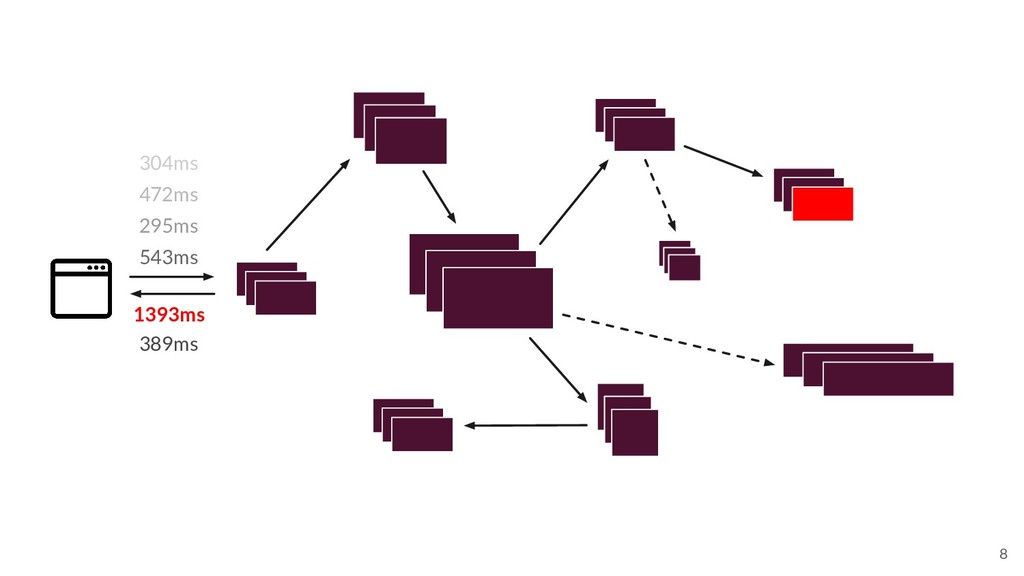
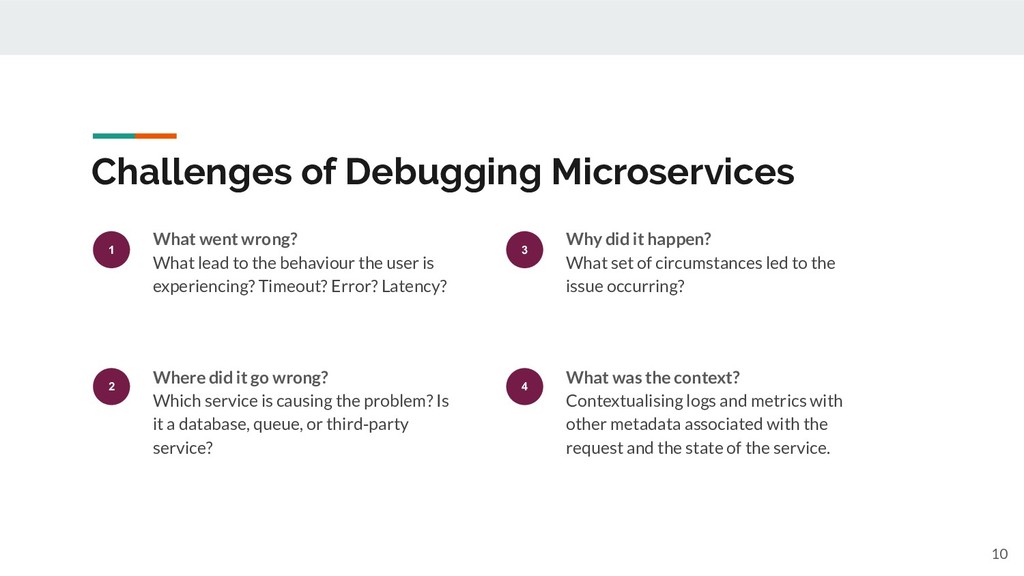
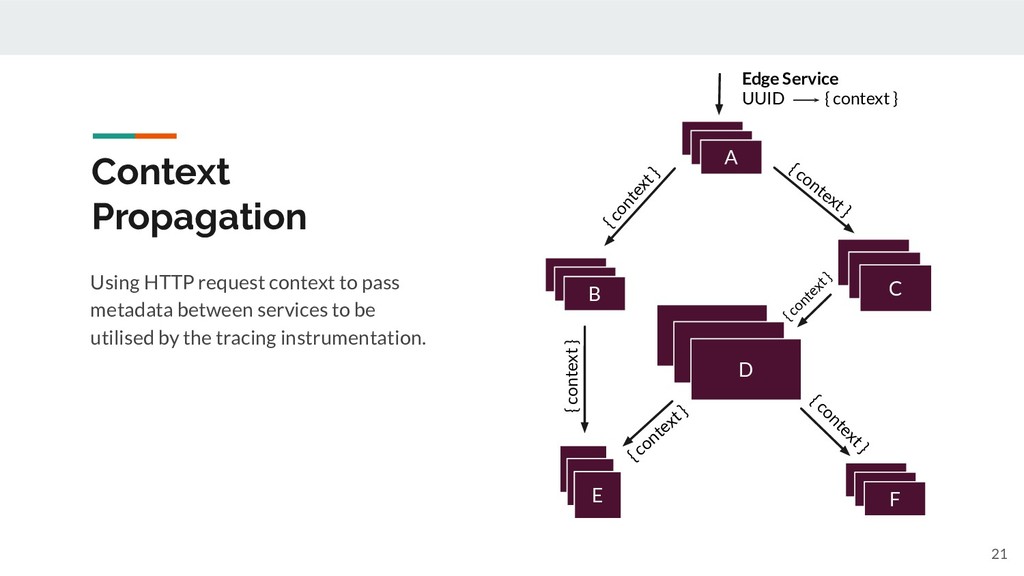
Of course, none of the benefits of microservices come without a cost. Networks are unreliable, and correlating thousands or millions of log entries between services can quickly become unmanageable. Therefore, understanding the source of an issue can be like finding a needle in a haystack. This is where distributed tracing comes in! Distributed tracing is the process of tracking requests through their lifetime within a complex distributed system, and has become a critical tool for debugging and understanding microservices.

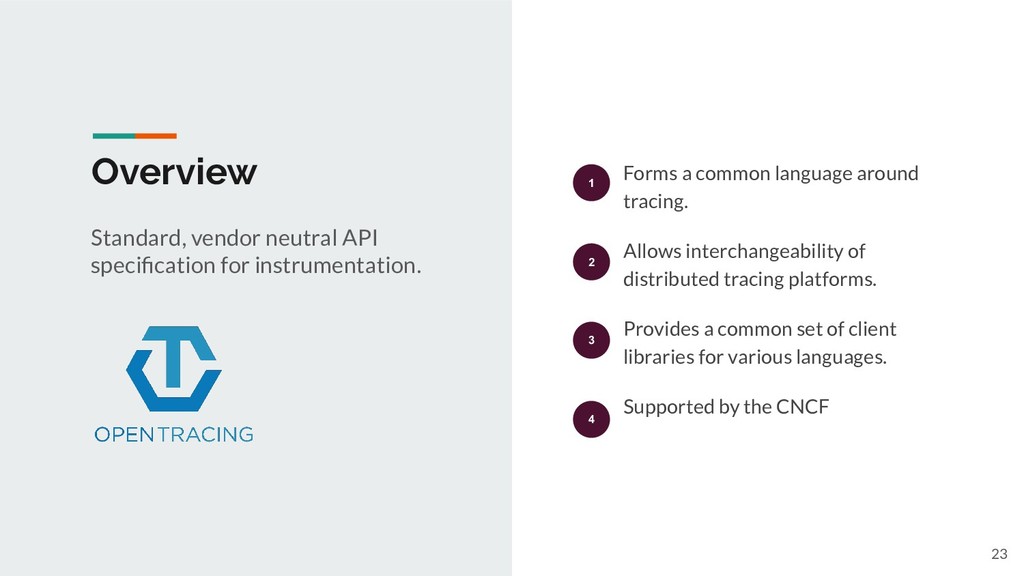
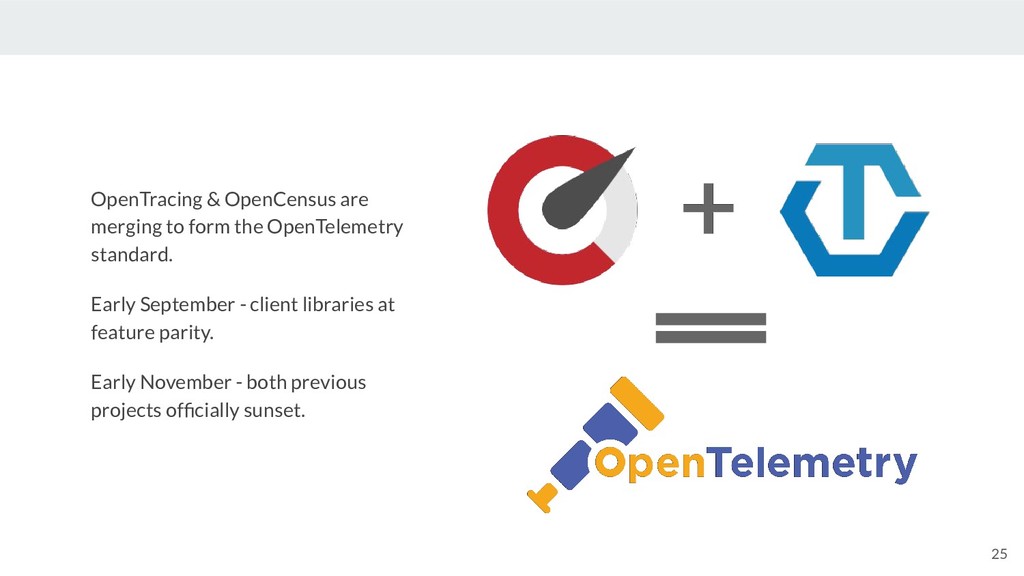
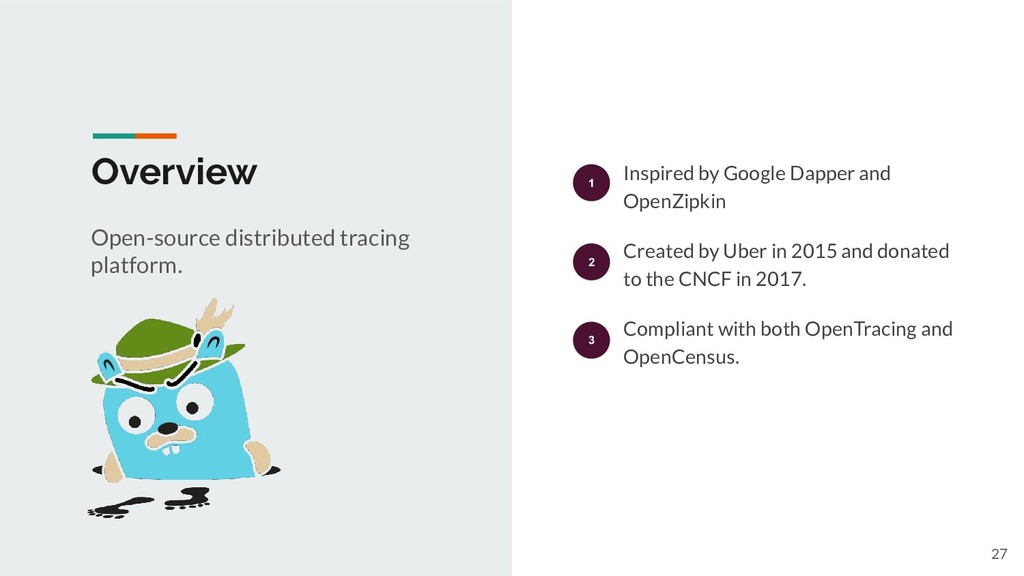
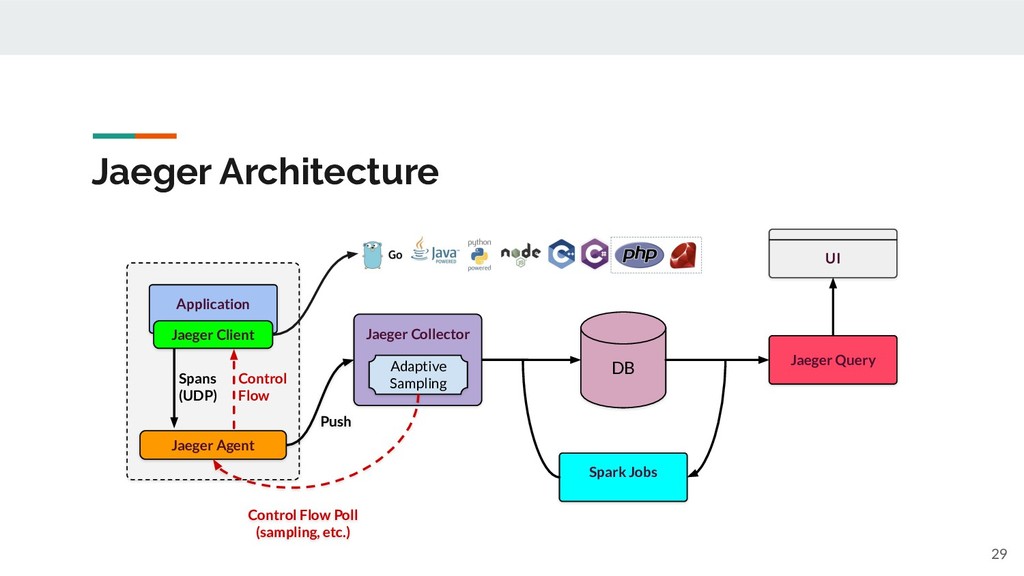
In this session we will explore the basics of distributed tracing. We'll then take a look at the OpenTelemetry (formally OpenTracing) standard - a vendor neutral framework for distributed tracing instrumentation. Finally, we'll take a hands-on look at distributed tracing in action using Jaeger, a popular open source distributed tracing tool which is part of the Cloud Native Computing Foundation. By the end of this session I hope you will not only have a good understanding of distributed tracing, but will be equipped with the knowledge and inspiration to introduce it within your own applications.

Josh Michielsen

August 03, 2019
Tweet

More Decks by Josh Michielsen

Other Decks in Programming

Transcript

  1. Finding a Needle in a Call Stack
    Introduction to Distributed Tracing
    By Josh Michielsen
    Senior Software Engineer, Platform Engineering
    Condé Nast International (@condenasteng)

    View Slide

  2. About Me
    Snr Software Engineer, Platform
    Engineering @ Condé Nast Intl.
    Live in Cambridge, UK
    Cyclist
    Photographer
    Dog Lover
    @jmickey_
    jmichielsen
    jmickey
    mickey.dev
    [email protected]
    2

    View Slide

  3. 3

    View Slide

  4. Global Cloud Platform
    Clusters in 4 Regions
    11 Markets
    120+ Million Monthly Pageviews
    14/34 Publications Migrated
    4

    View Slide

  5. Microservices
    5

    View Slide

  6. Benefits of Microservices
    6
    1
    Independently Deployable & Scalable
    Small services can be deployed and
    scaled quickly and independently.
    2
    Cross-functional Teams
    Teams can specialise and focus on
    bringing business value in a specific
    area.
    3
    Polyglot Services
    Teams can choose their technology
    stack, such as programming language,
    datastore, frameworks, etc.
    4
    Improved Fault Tolerance & Isolation
    The loss of a single service can be less
    detrimental the overall health of the
    system.

    View Slide

  7. 7

    View Slide

  8. 304ms
    472ms
    295ms
    543ms
    1393ms
    8
    389ms

    View Slide

  9. 304ms
    472ms
    295ms
    543ms
    1840ms
    9

    View Slide

  10. Challenges of Debugging Microservices
    10
    1
    What went wrong?
    What lead to the behaviour the user is
    experiencing? Timeout? Error? Latency?
    2
    Where did it go wrong?
    Which service is causing the problem? Is
    it a database, queue, or third-party
    service?
    3
    Why did it happen?
    What set of circumstances led to the
    issue occurring?
    4
    What was the context?
    Contextualising logs and metrics with
    other metadata associated with the
    request and the state of the service.

    View Slide

  11. Existing Methods
    11
    Metrics
    ● Error rates, latency, throughput, CPU,
    RAM, etc.
    ● Identify anomalies/irregularities.
    Logging
    ● Record error messages and stack traces.
    ● Track unexpected code paths.
    ● Find the “why” of the issue.
    Used together to debug issues. Metrics help
    you identify that an issue exists, and logging
    helps you understand what the issue is.
    Problem: These tools only tell the story from
    the perspective of a single application.

    View Slide

  12. Distributed
    Tracing
    12

    View Slide


  13. Definition
    Distributed tracing, also called distributed request tracing, is
    a method used to profile and monitor applications, especially
    those built using a microservices architecture. Distributed
    tracing helps pinpoint where failures occur and what causes
    poor performance.
    13
    https:/
    /opentracing.io/docs/overview/what-is-tracing

    View Slide

  14. Anatomy of a Trace
    14
    Terminology:
    ● Trace
    ● Span
    ● Tags
    ● Logs
    ● SpanContext
    ● Baggage
    A
    B
    C
    D
    E
    F
    Time
    Trace
    Spans

    View Slide

  15. 15
    A
    B
    C
    D
    E
    F
    Time
    Trace
    Trace
    Representation of a request as it traverses a
    distributed system. Directed Acyclic Graph,
    with Spans (Nodes) and the edges between
    them as References.
    Spans

    View Slide

  16. 16
    A
    B
    C
    D
    E
    F
    Time
    Trace
    Spans
    Span
    Individual unit of work done within a
    distributed system. Spans generally have a
    name, and a start and end timestamp.
    Trace
    Representation of a request as it traverses a
    distributed system. Directed Acyclic Graph,
    with Spans (Nodes) and the edges between
    them as References.

    View Slide

  17. 17
    A
    B
    C
    D
    E
    F
    Time
    Trace
    Spans
    A trace is a collection of one or
    more spans.
    Span
    Individual unit of work done within a
    distributed system. Spans generally have a
    name, and a start and end timestamp.
    Trace
    Representation of a request as it traverses a
    distributed system. Directed Acyclic Graph,
    with Spans (Nodes) and the edges between
    them as References.

    View Slide

  18. 18
    A
    B
    Time
    Tags
    Span specific, user-defined key:value
    annotations. Can be used to query and filter.
    Tags
    http.method: “GET”, http.status:
    200, app: “my-service”

    View Slide

  19. 19
    A
    B
    Time
    Tags
    http.method: “GET”, http.status:
    200, app: “my-service”
    Tags
    Span specific, user-defined key:value
    annotations. Can be used to query and filter.
    Logs
    “level”: “info”, “method”: “GET”,
    “message”: “animals are better
    than humans”
    Logs
    Contextualised logging messages. Used to
    capture debugging information and events
    that occurred within the span.

    View Slide

  20. 20
    A
    B
    Time
    Tags
    http.method: “GET”, http.status:
    200, app: “my-service”
    Tags
    Span specific, user-defined key:value
    annotations. Can be used to query and filter.
    Logs
    “level”: “info”, “method”: “GET”,
    “message”: “animals are better
    than humans”
    Logs
    Contextualised logging messages. Used to
    capture debugging information and events
    that occurred within the span.
    SpanContext
    trace_id: “20092013”, span_id:
    “01071992”
    Baggage: user_id: “03092019”
    SpanContext
    Transporting data across the network
    boundary, both in the immediate context
    (e.g. parent span_id), and baggage - which is
    carried throughout the entire trace.

    View Slide

  21. 21
    Using HTTP request context to pass
    metadata between services to be
    utilised by the tracing instrumentation.
    Context
    Propagation
    A
    C
    F
    D
    E
    B
    Edge Service
    UUID { context }
    { context }
    { context }
    { context }
    { context }
    { context }
    { context }

    View Slide

  22. OpenTracing
    API
    22

    View Slide

  23. Overview Forms a common language around
    tracing.
    Allows interchangeability of
    distributed tracing platforms.
    Provides a common set of client
    libraries for various languages.
    Supported by the CNCF
    23
    Standard, vendor neutral API
    specification for instrumentation.
    1
    2
    3
    4

    View Slide

  24. 24

    View Slide

  25. 25
    OpenTracing & OpenCensus are
    merging to form the OpenTelemetry
    standard.
    Early September - client libraries at
    feature parity.
    Early November - both previous
    projects officially sunset.

    View Slide

  26. Jaeger
    Tracing
    26

    View Slide

  27. Overview Inspired by Google Dapper and
    OpenZipkin
    Created by Uber in 2015 and donated
    to the CNCF in 2017.
    Compliant with both OpenTracing and
    OpenCensus.
    27
    Open-source distributed tracing
    platform.
    1
    2
    3

    View Slide

  28. ● Go backend
    ● React frontend
    ● Multiple storage options:
    ● Cassandra
    ● ElasticSearch
    ● In-Memory
    ● Compatible with Apache Kafka for
    backpressure management.
    28
    Overview (cont.)

    View Slide

  29. 29
    Application
    Jaeger Client
    Jaeger Agent
    Spans
    (UDP)
    Control
    Flow
    Jaeger Collector
    Push
    Adaptive
    Sampling
    Control Flow Poll
    (sampling, etc.)
    DB
    Spark Jobs
    Jaeger Query
    UI
    Jaeger Architecture

    View Slide

  30. A Note on Sampling
    30
    In statistics, quality assurance, and survey
    methodology, sampling is the selection of a
    subset of individuals from within a statistical
    population to estimate characteristics of the
    whole population.
    Wikipedia
    https://en.wikipedia.org/wiki/Sampling_(statistics)
    Probabilistic Sampling: Random sampling
    decision. E.g. 0.01% or 1/1000th chance of being
    sampled. (Default)
    Rate Limiting: “Leaky Bucket” rate limiting. E.g.
    20 per second.
    Constant: Same decision for all traces. Either
    all or nothing.


    View Slide

  31. Jaeger vs. Zipkin
    31
    Jaeger
    ● Written in Go
    ● 8.6k stars
    ● Compatible with Zipkin client libraries
    ● Kubernetes Operator & official Helm chart
    ● CNCF project
    Zipkin
    ● Written in Java
    ● Released in 2012 by Twitter
    ● 11k stars
    ● Single binary deployment

    View Slide

  32. Demo
    32

    View Slide

  33. Resources
    Jaeger: https://jaegertracing.io
    Hot R.O.D Example: https://github.com/jaegertracing/jaeger/tree/master/examples/hotrod
    Hot R.O.D Tutorial: http://bit.ly/hotrod-tutorial
    OpenTracing Tutorial: https://github.com/yurishkuro/opentracing-tutorial
    Framework Libraries: https://github.com/opentracing-contrib/
    Supported Languages: https://opentracing.io/docs/supported-languages/
    33

    View Slide

  34. 34
    Thanks for
    Listening!

    View Slide

  35. 35
    @jmickey_
    jmichielsen
    jmickey
    mickey.dev
    [email protected]
    Thanks for Listening!

    View Slide