Upgrade to Pro — share decks privately, control downloads, hide ads and more …

Tactics for Safely Using Agile Metrics in JIRA

Tactics for Safely Using Agile Metrics in JIRA

Julia Wester

April 18, 2018
Tweet

More Decks by Julia Wester

Other Decks in Business

Transcript

  1. @everydaykanban | @TeamLagom !3 ship more value sooner start more

    or help finish lower WiP correlates to faster delivery Team’s current WiP levels Start with an outcome, not a metric Source: Larry Maccherone
  2. Don’t confuse activity with progress @everydaykanban | @TeamLagom !4 I

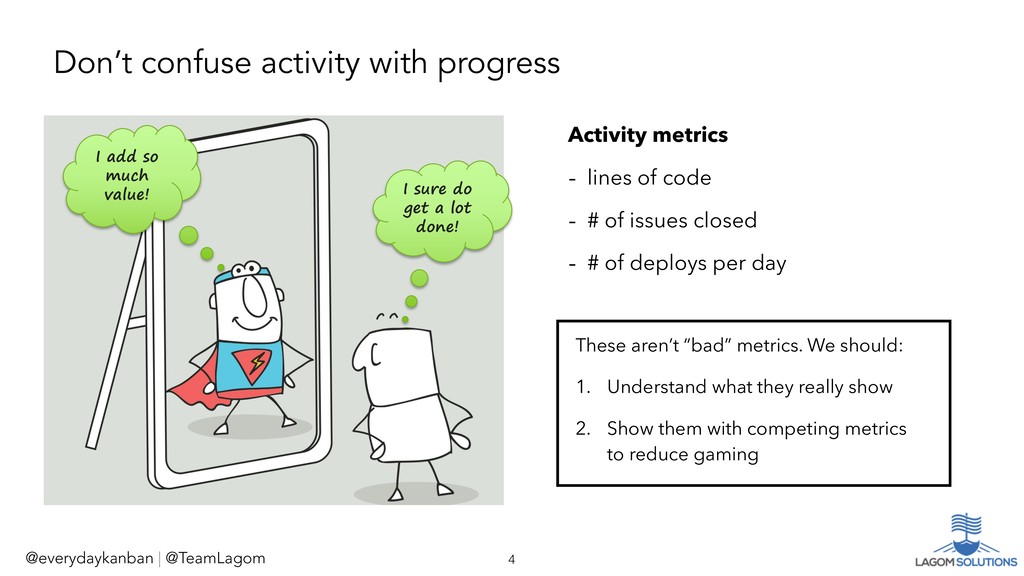
    sure do get a lot done! I add so much value! Activity metrics - lines of code - # of issues closed - # of deploys per day These aren’t “bad” metrics. We should: 1. Understand what they really show 2. Show them with competing metrics to reduce gaming
  3. Keep Your Metrics Balanced @everydaykanban | @TeamLagom !5 Quality How

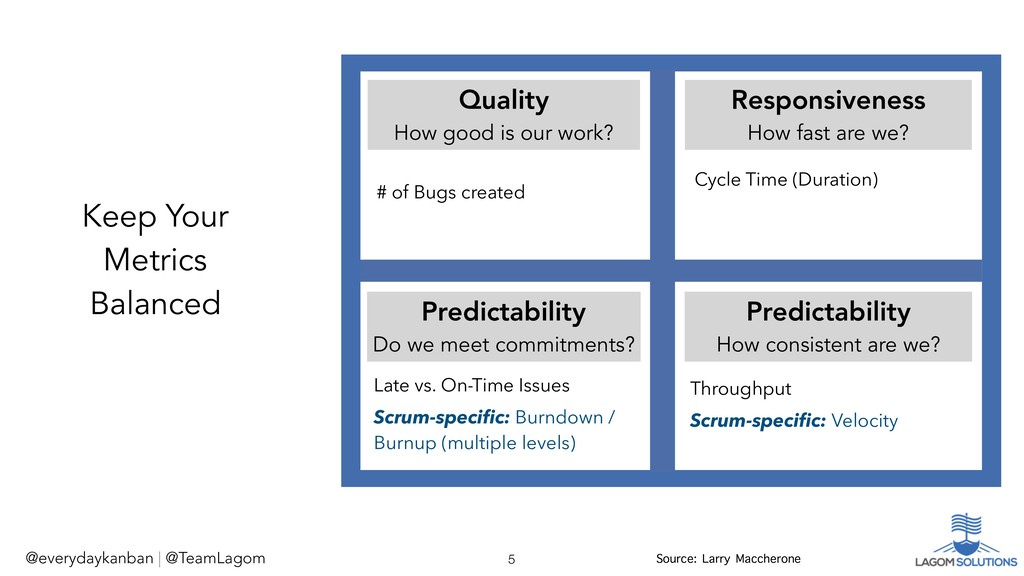
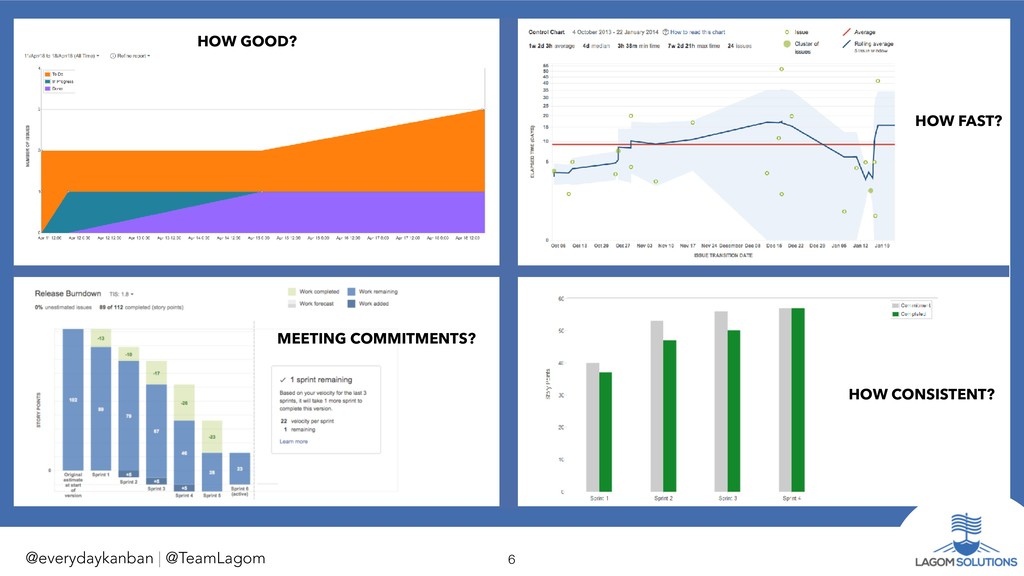
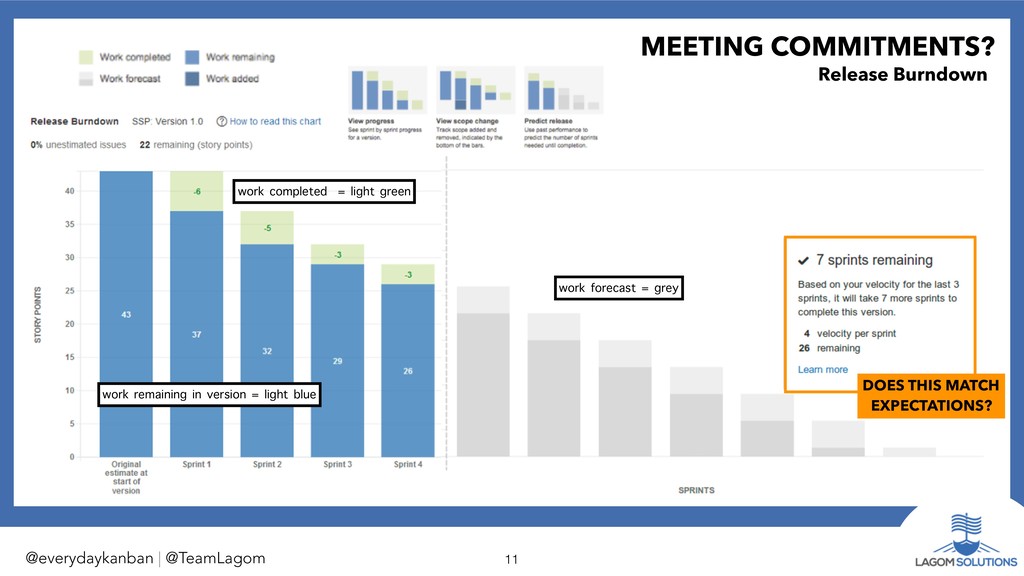
    good is our work? Responsiveness How fast are we? Predictability How consistent are we? Predictability Do we meet commitments? Throughput Scrum-specific: Velocity # of Bugs created Cycle Time (Duration) Late vs. On-Time Issues Scrum-specific: Burndown / Burnup (multiple levels) Source: Larry Maccherone
  4. @everydaykanban | @TeamLagom HOW !9 HOW GOOD? Cumulative Flow Diagram

    filter on issuetype = Bug Blue band disappeared orange band is getting wider! orange band is getting narrower the purple band is completely horizontal
  5. @everydaykanban | @TeamLagom HOW !10 HOW FAST? Control Chart
 Filter

    by desired segment and date range Tip: Focus on trends over individual data points
  6. HOW MEETING COMMITMENTS? Release Burndown @everydaykanban | @TeamLagom !11 work

    completed = light green work remaining in version = light blue work forecast = grey DOES THIS MATCH EXPECTATIONS?
  7. @everydaykanban | @TeamLagom HOW MEETING COMMITMENTS? Sprint Burndown !12 You

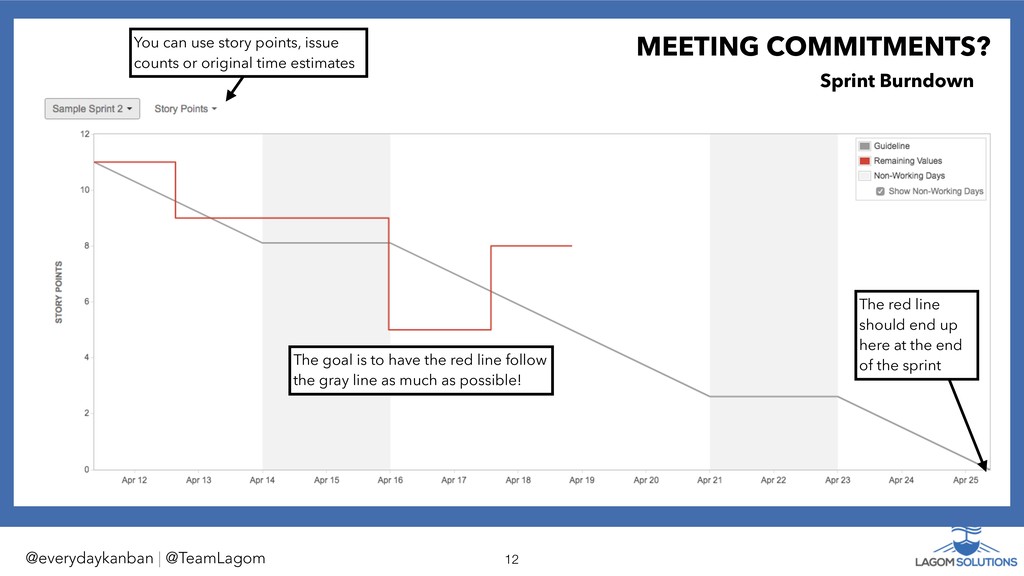
    can use story points, issue counts or original time estimates The goal is to have the red line follow the gray line as much as possible! The red line should end up here at the end of the sprint
  8. @everydaykanban | @TeamLagom HOW !13 HOW CONSISTENT? Velocity Chart Is

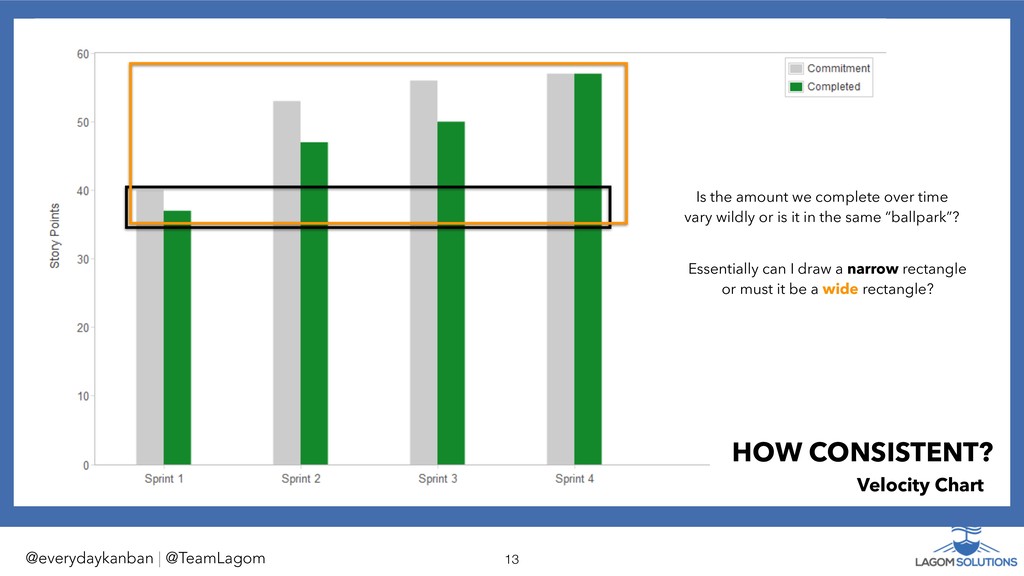
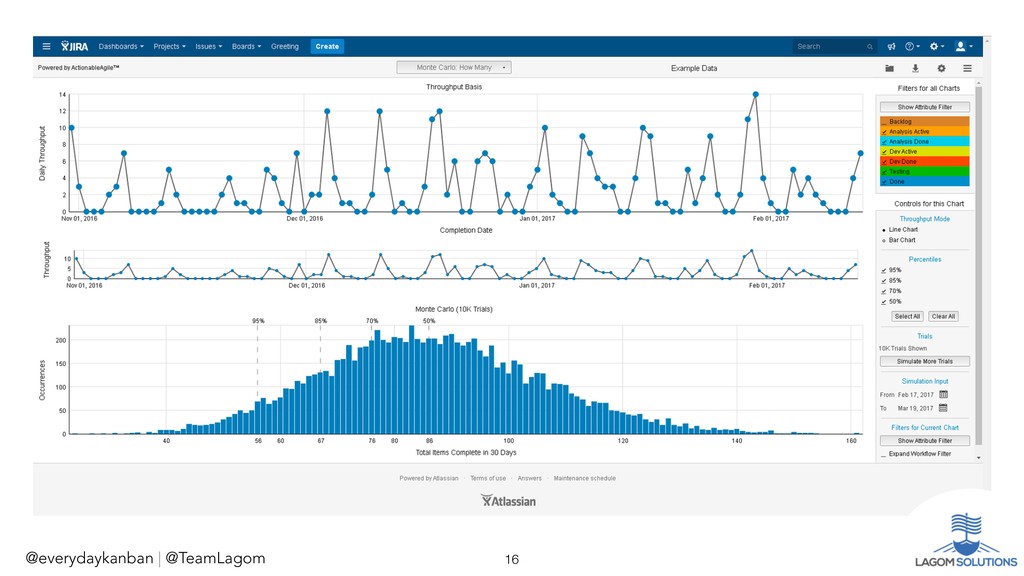
    the amount we complete over time vary wildly or is it in the same “ballpark”? Essentially can I draw a narrow rectangle or must it be a wide rectangle?