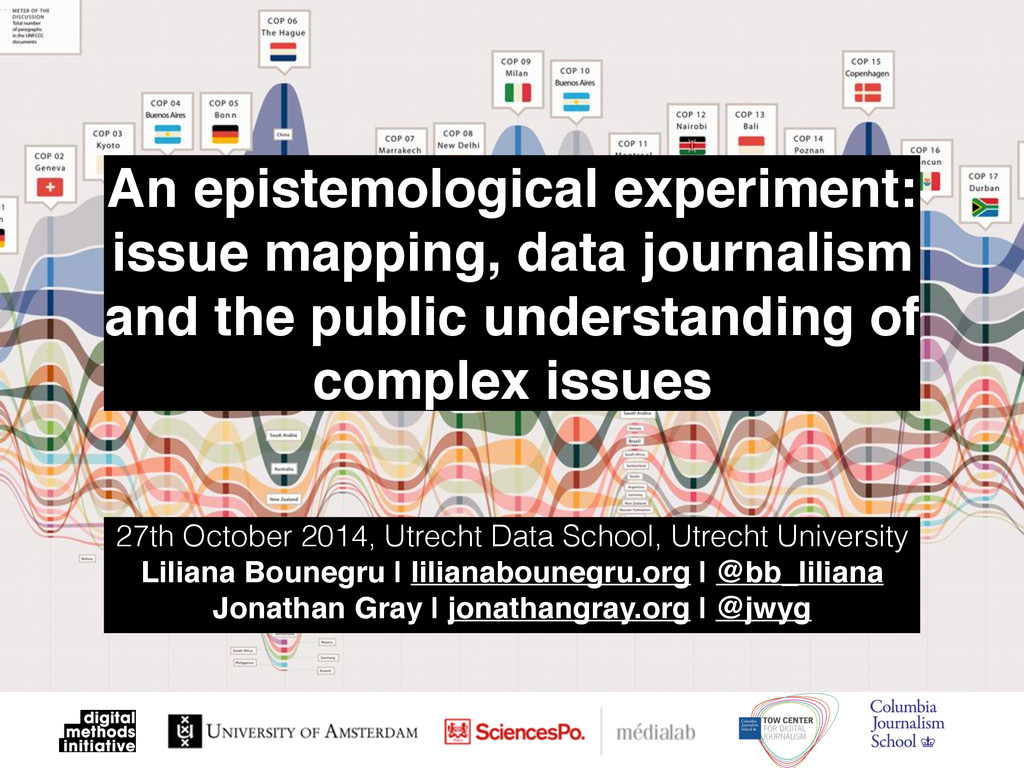
understanding of complex issues 27th October 2014, Utrecht Data School, Utrecht University Liliana Bounegru | lilianabounegru.org | @bb_liliana! Jonathan Gray | jonathangray.org | @jwyg
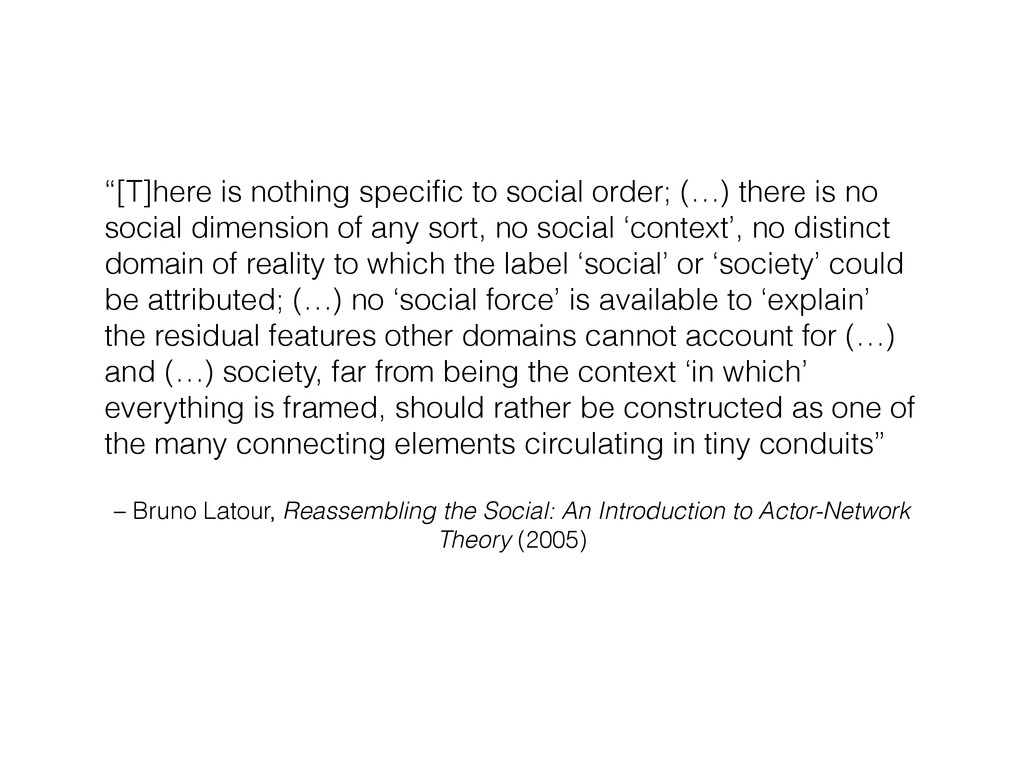
Theory (2005) “[T]here is nothing specific to social order; (…) there is no social dimension of any sort, no social ‘context’, no distinct domain of reality to which the label ‘social’ or ‘society’ could be attributed; (…) no ‘social force’ is available to ‘explain’ the residual features other domains cannot account for (…) and (…) society, far from being the context ‘in which’ everything is framed, should rather be constructed as one of the many connecting elements circulating in tiny conduits”
every interaction that passes through them leaves traces..” – Bruno Latour & Tommaso Venturini, “The Social Fabric: Digital Traces and Quali-quantitative Methods” (2009)
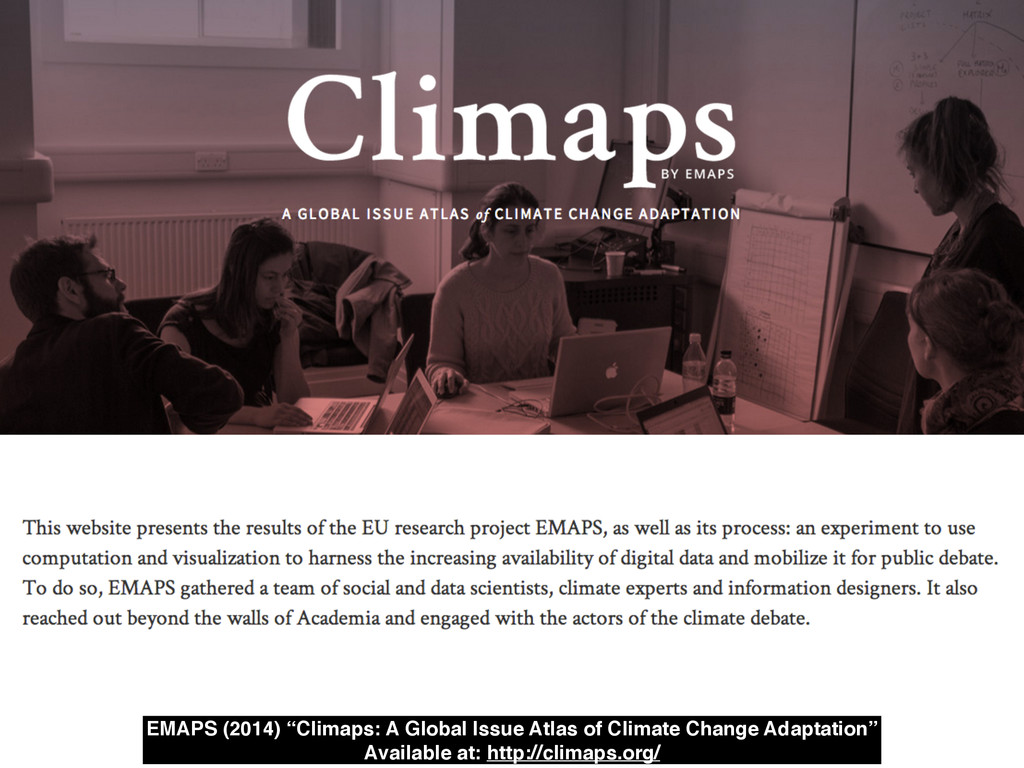
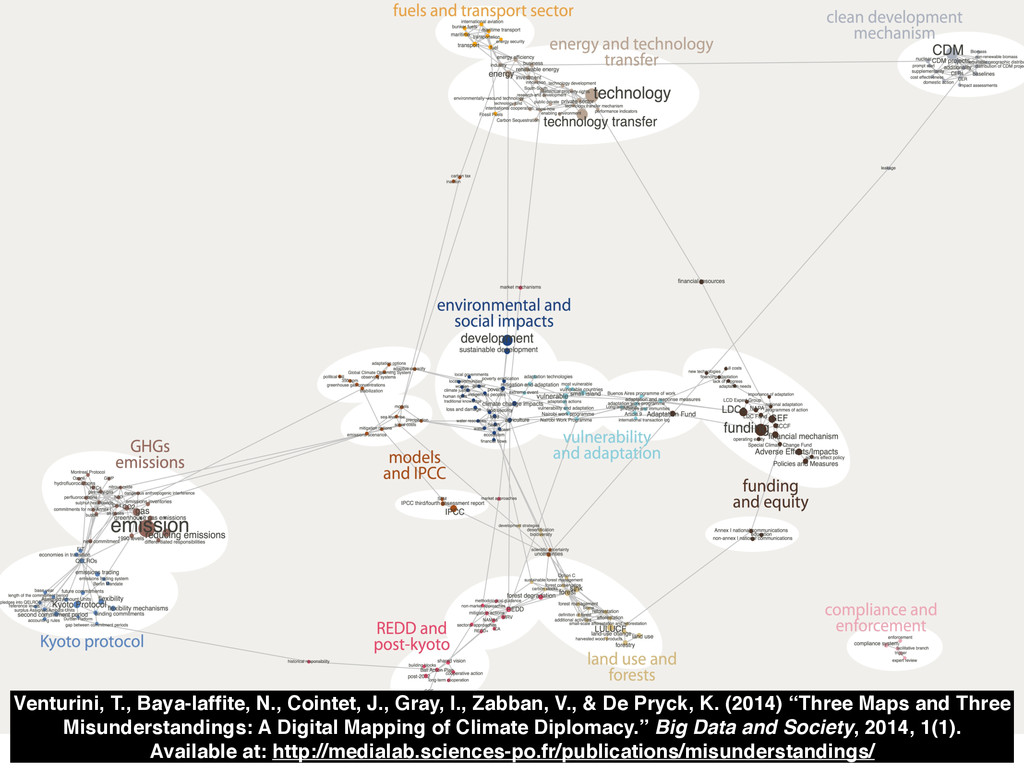
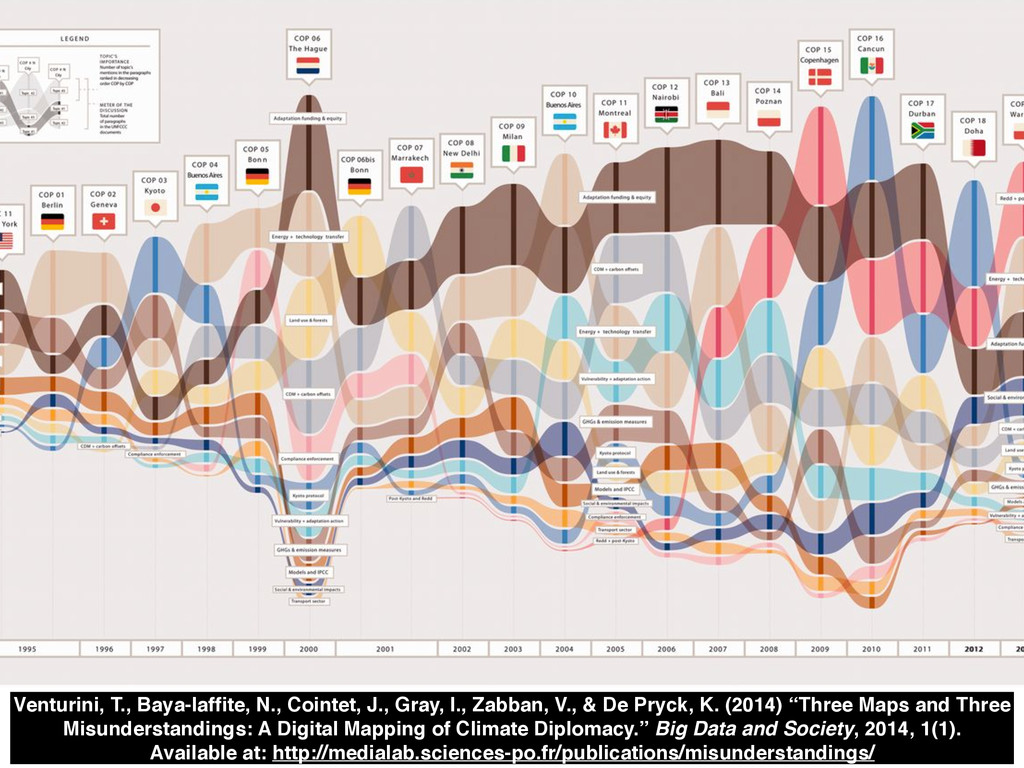
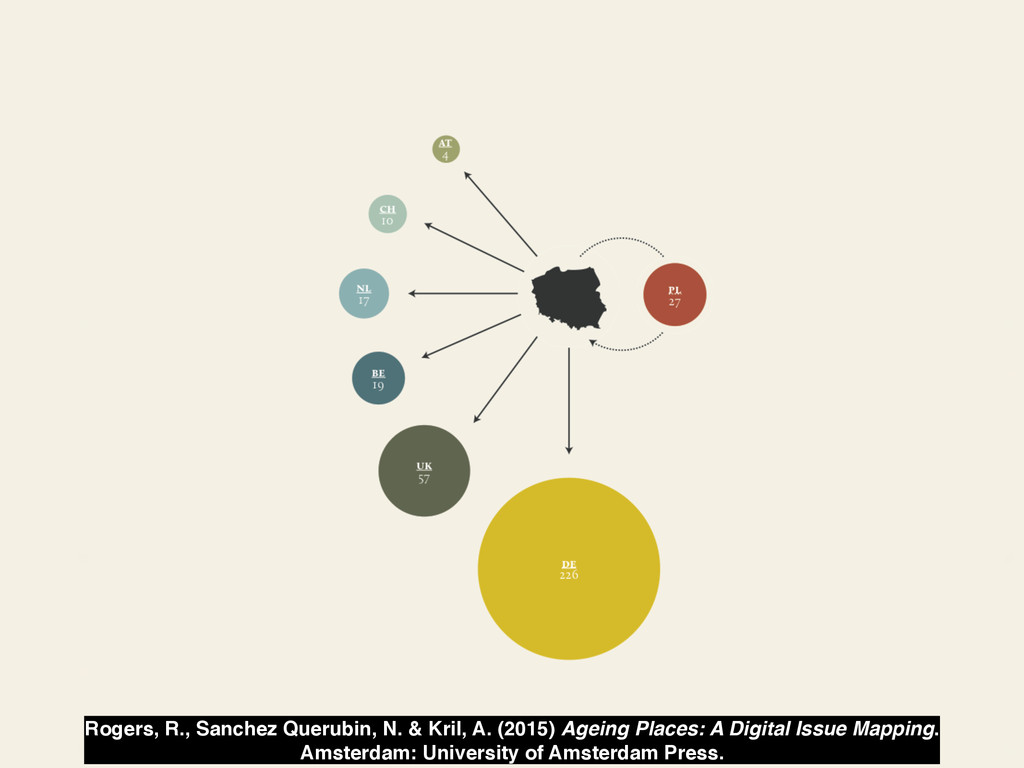
& De Pryck, K. (2014) “Three Maps and Three Misunderstandings : A Digital Mapping of Climate Diplomacy.” Big Data and Society, 2014, 1(1). Available at: http://medialab.sciences-po.fr/publications/misunderstandings/
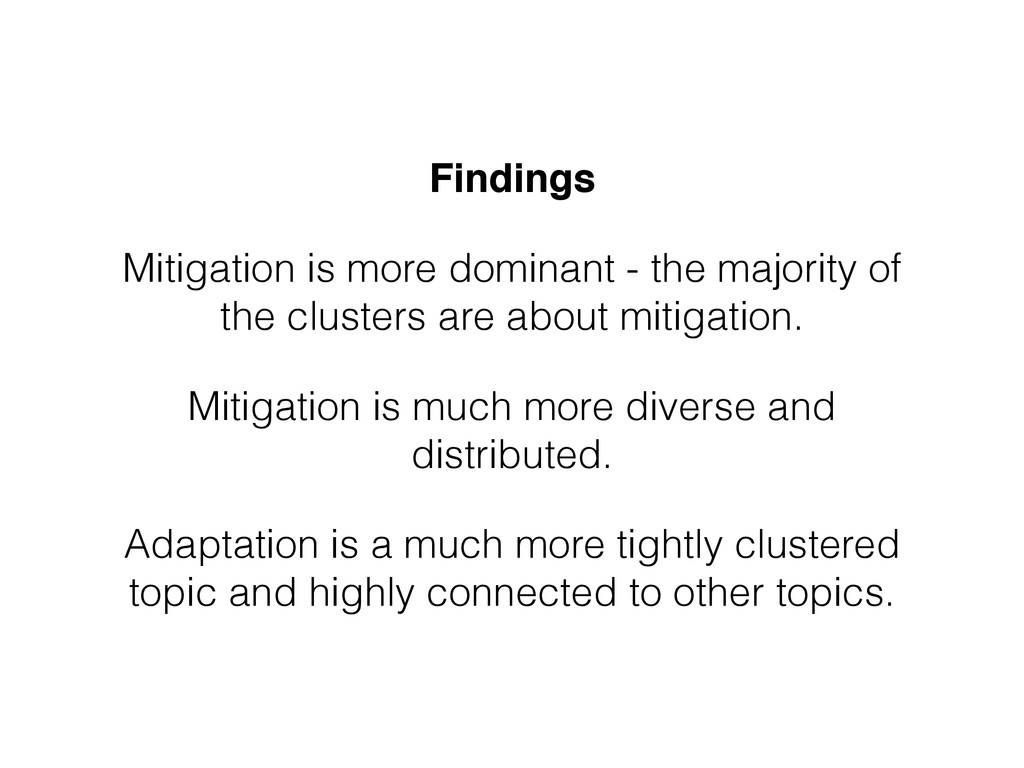
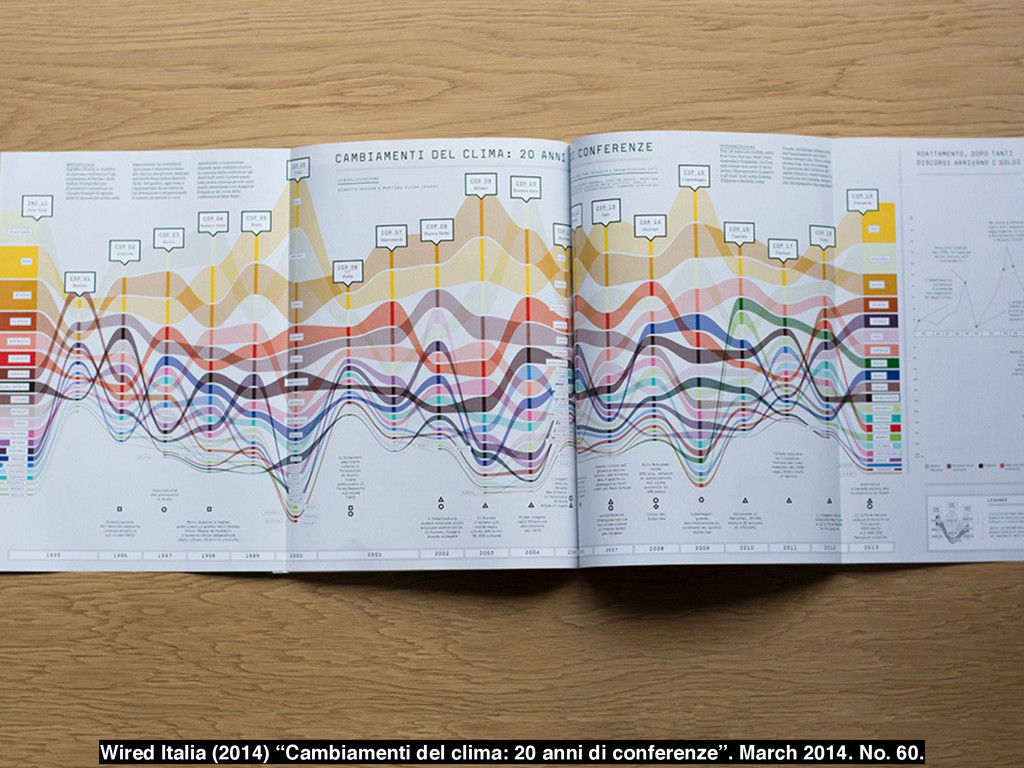
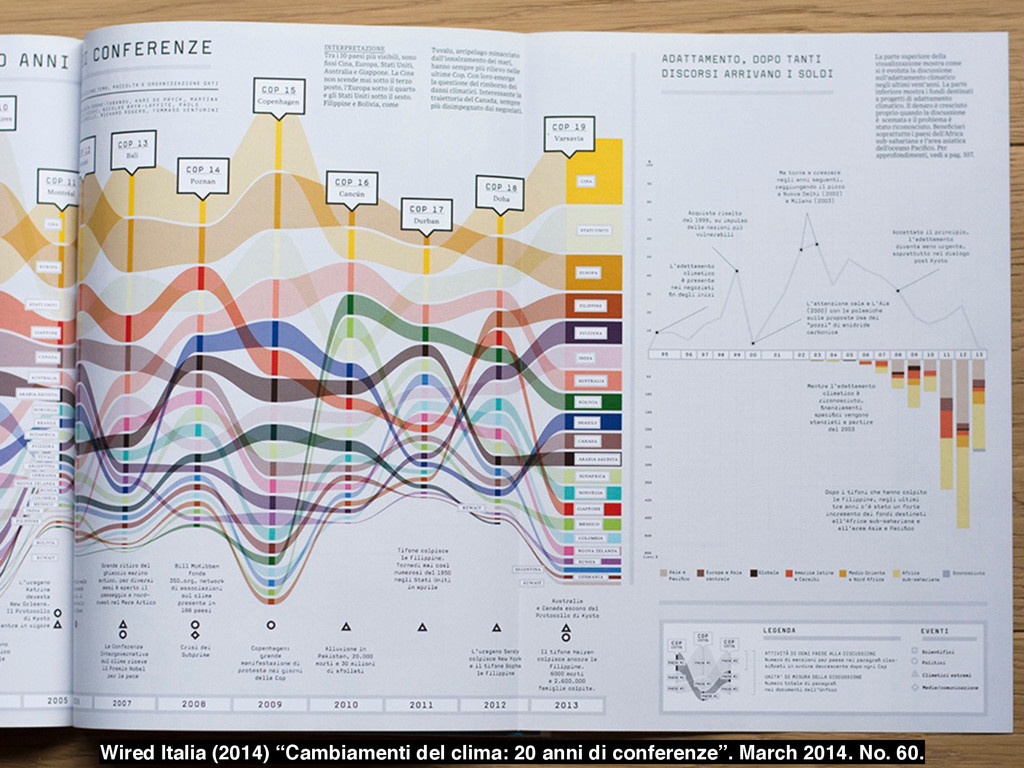
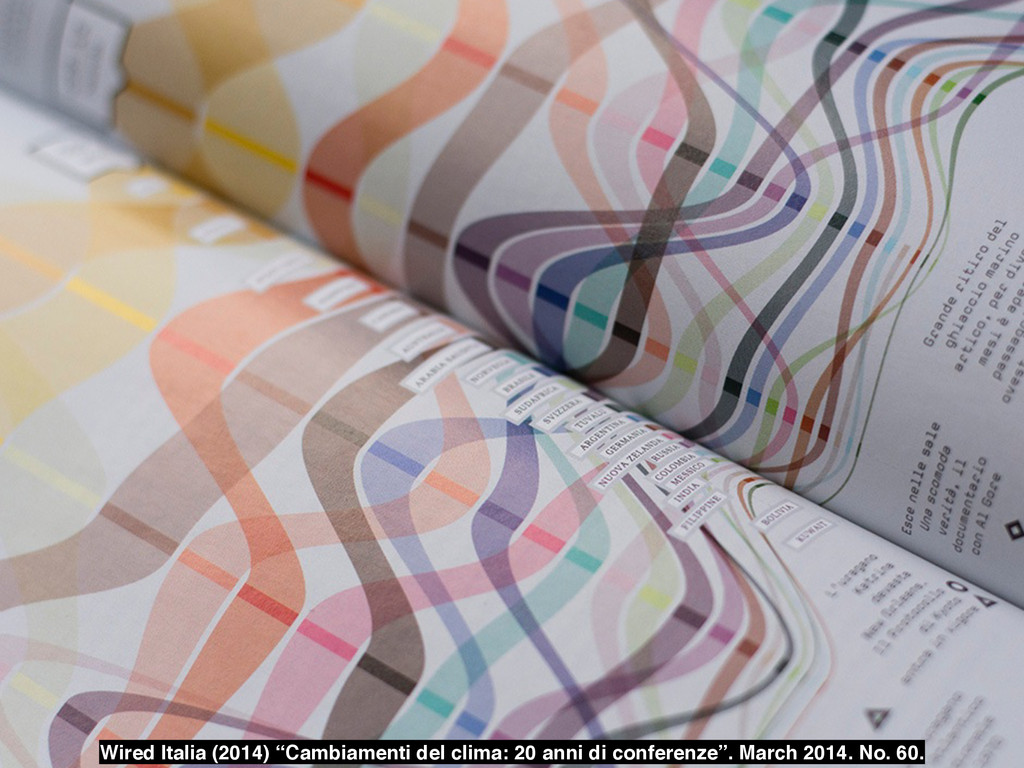
clusters are about mitigation. Mitigation is much more diverse and distributed. Adaptation is a much more tightly clustered topic and highly connected to other topics.
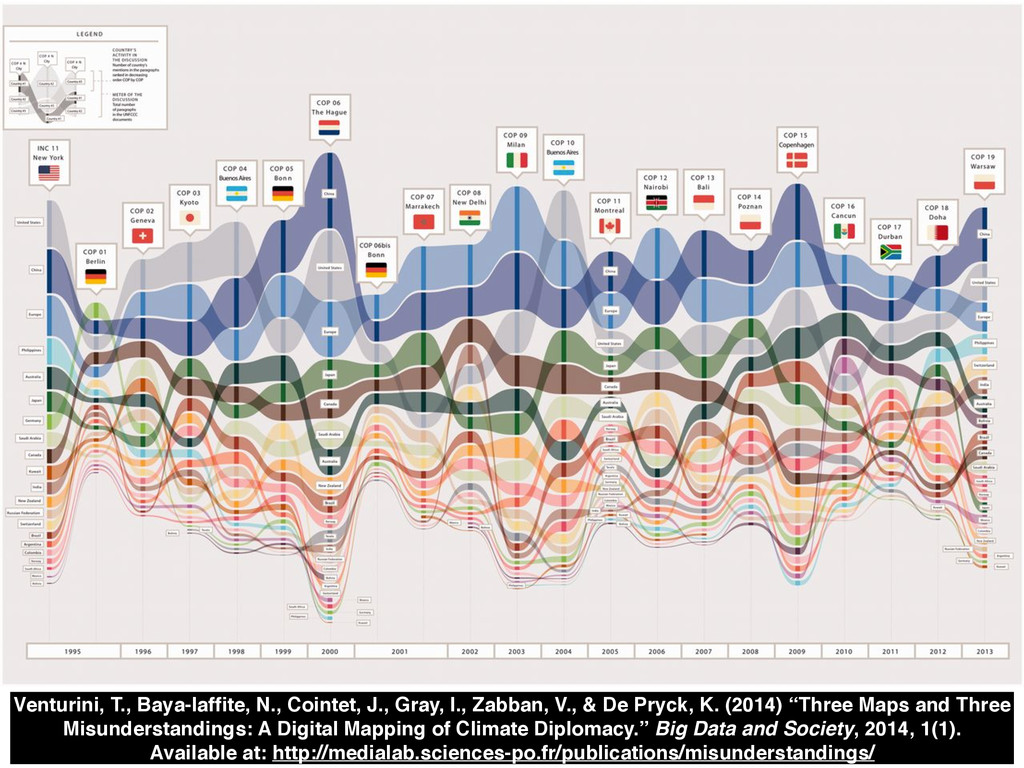
& De Pryck, K. (2014) “Three Maps and Three Misunderstandings : A Digital Mapping of Climate Diplomacy.” Big Data and Society, 2014, 1(1). Available at: http://medialab.sciences-po.fr/publications/misunderstandings/
& De Pryck, K. (2014) “Three Maps and Three Misunderstandings : A Digital Mapping of Climate Diplomacy.” Big Data and Society, 2014, 1(1). Available at: http://medialab.sciences-po.fr/publications/misunderstandings/
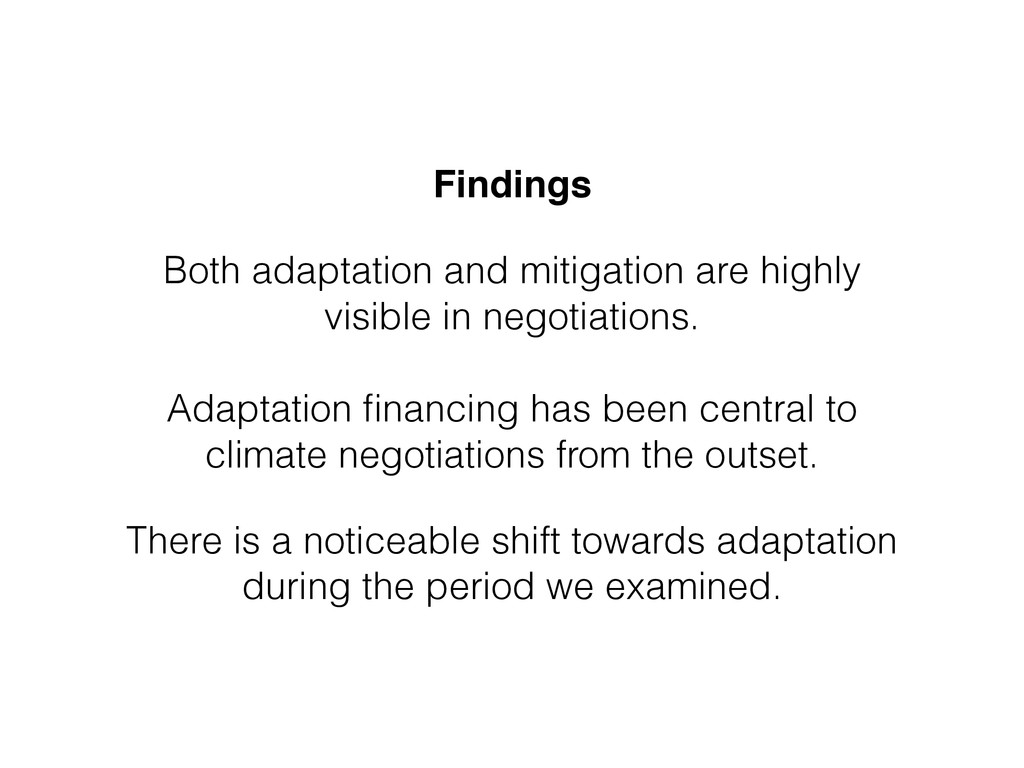
Adaptation financing has been central to climate negotiations from the outset. There is a noticeable shift towards adaptation during the period we examined.
& De Pryck, K. (2014) “Three Maps and Three Misunderstandings : A Digital Mapping of Climate Diplomacy.” Big Data and Society, 2014, 1(1). Available at: http://medialab.sciences-po.fr/publications/misunderstandings/
& De Pryck, K. (2014) “Three Maps and Three Misunderstandings : A Digital Mapping of Climate Diplomacy.” Big Data and Society, 2014, 1(1). Available at: http://medialab.sciences-po.fr/publications/misunderstandings/
exceptions include Bolivia and Philippines who are becoming more prominent in recent negotiations. Most active are China (representing G77), United States and Europe. Countries tend to be more active when they host the negotiations.
& De Pryck, K. (2014) “Three Maps and Three Misunderstandings : A Digital Mapping of Climate Diplomacy.” Big Data and Society, 2014, 1(1). Available at: http://medialab.sciences-po.fr/publications/misunderstandings/
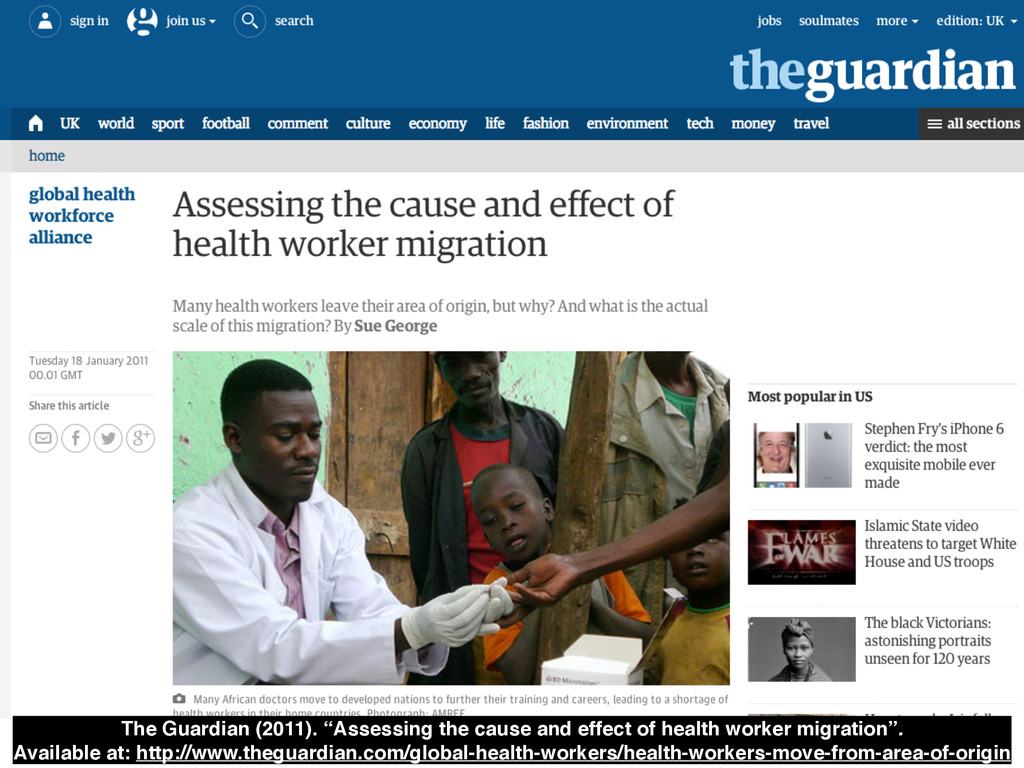
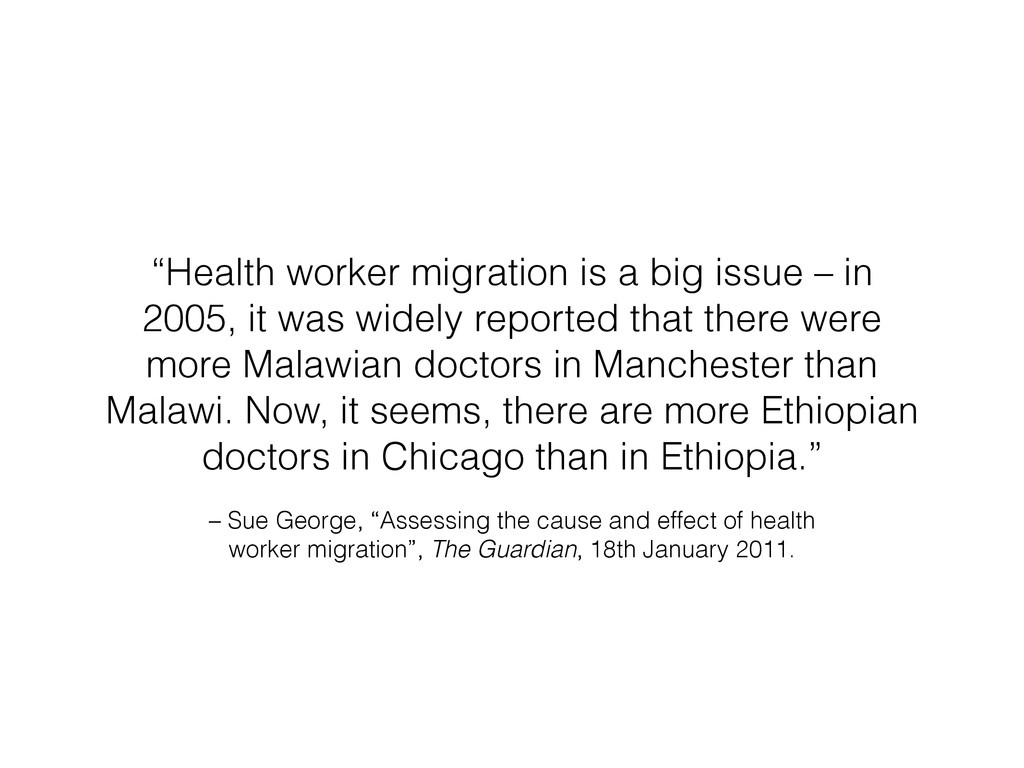
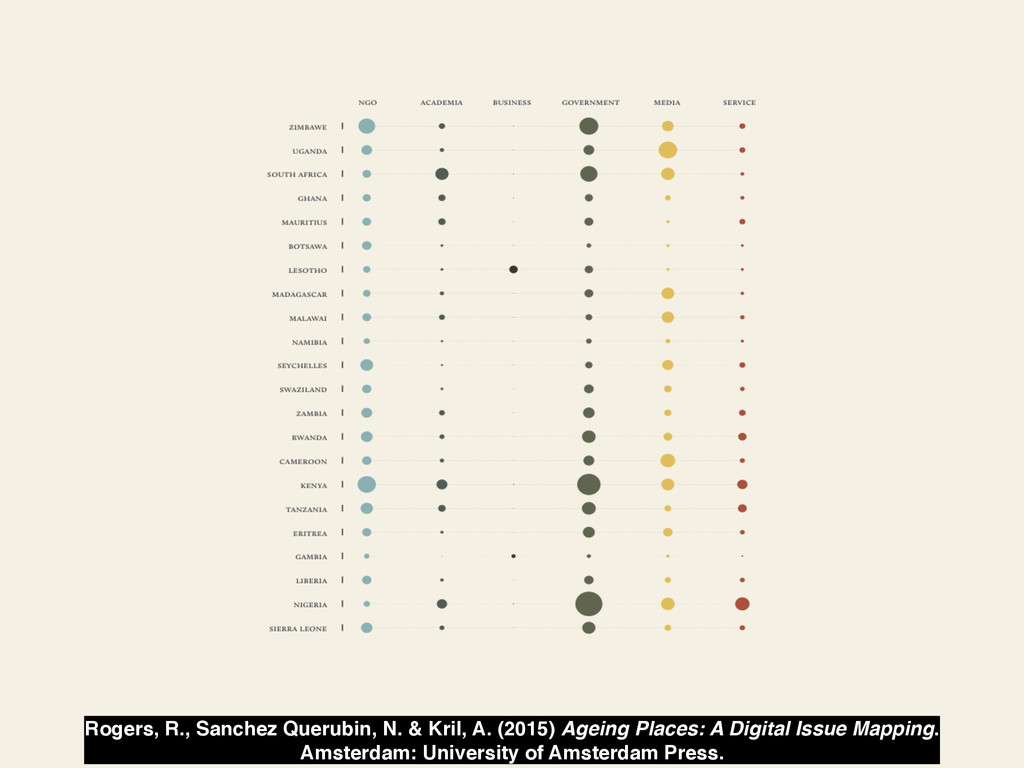
worker migration”, The Guardian, 18th January 2011. “Health worker migration is a big issue – in 2005, it was widely reported that there were more Malawian doctors in Manchester than Malawi. Now, it seems, there are more Ethiopian doctors in Chicago than in Ethiopia.”
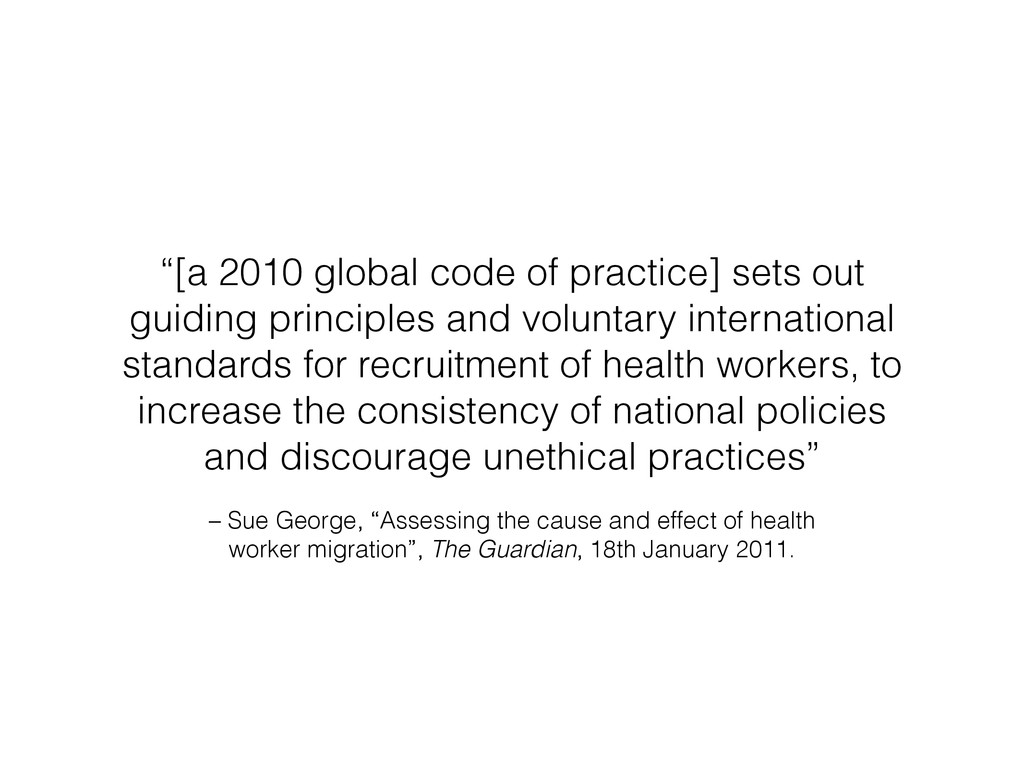
worker migration”, The Guardian, 18th January 2011. “[a 2010 global code of practice] sets out guiding principles and voluntary international standards for recruitment of health workers, to increase the consistency of national policies and discourage unethical practices”
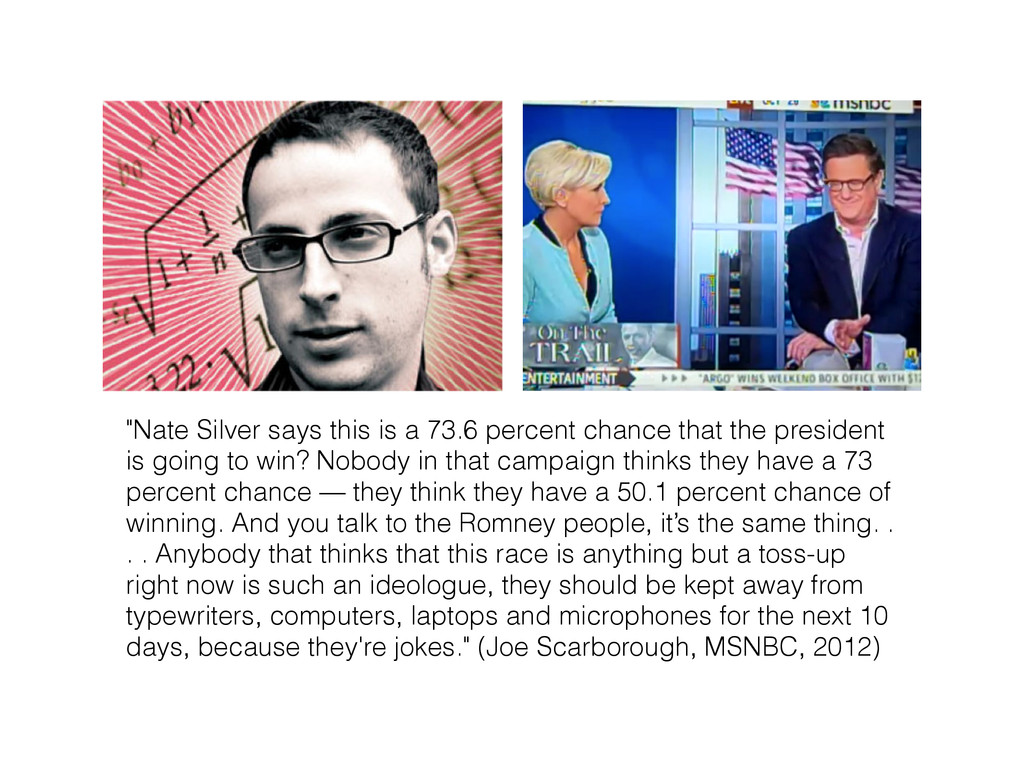
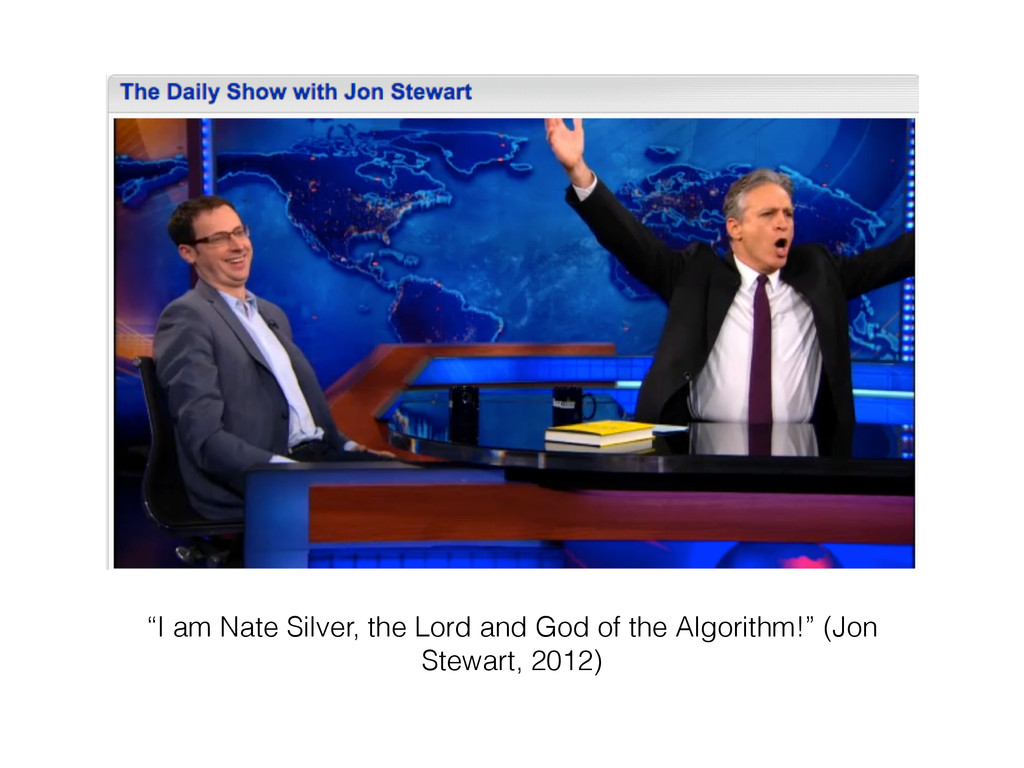
the president is going to win? Nobody in that campaign thinks they have a 73 percent chance — they think they have a 50.1 percent chance of winning. And you talk to the Romney people, it’s the same thing. . . . Anybody that thinks that this race is anything but a toss-up right now is such an ideologue, they should be kept away from typewriters, computers, laptops and microphones for the next 10 days, because they're jokes." (Joe Scarborough, MSNBC, 2012)
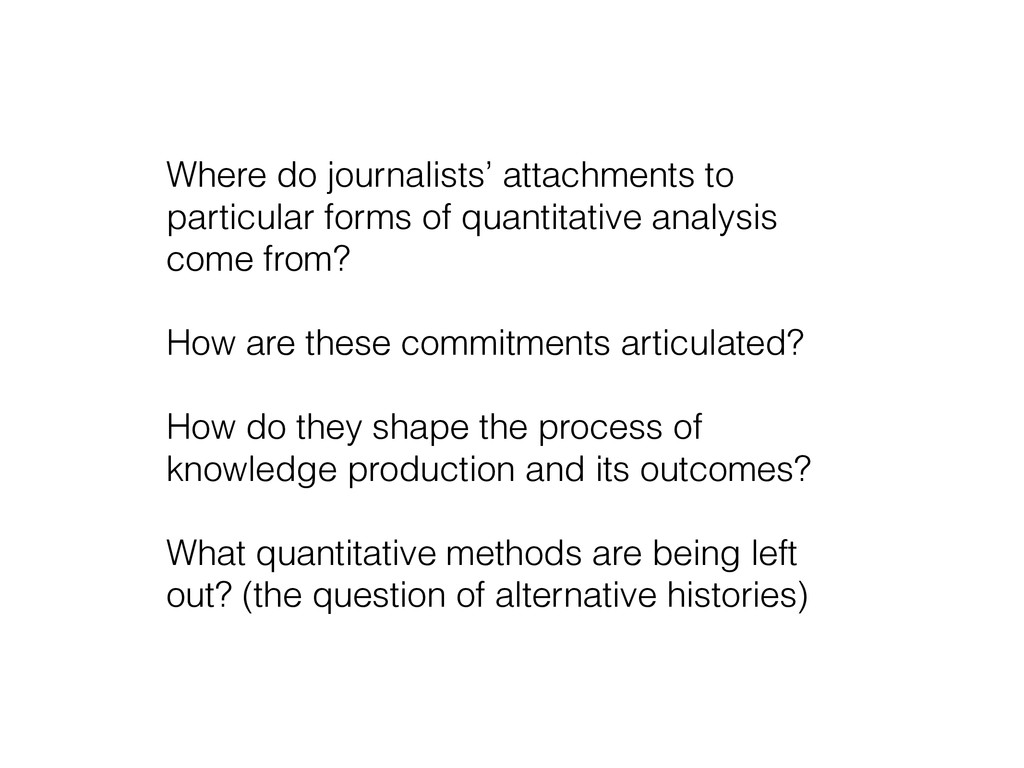
come from? How are these commitments articulated? How do they shape the process of knowledge production and its outcomes? What quantitative methods are being left out? (the question of alternative histories)
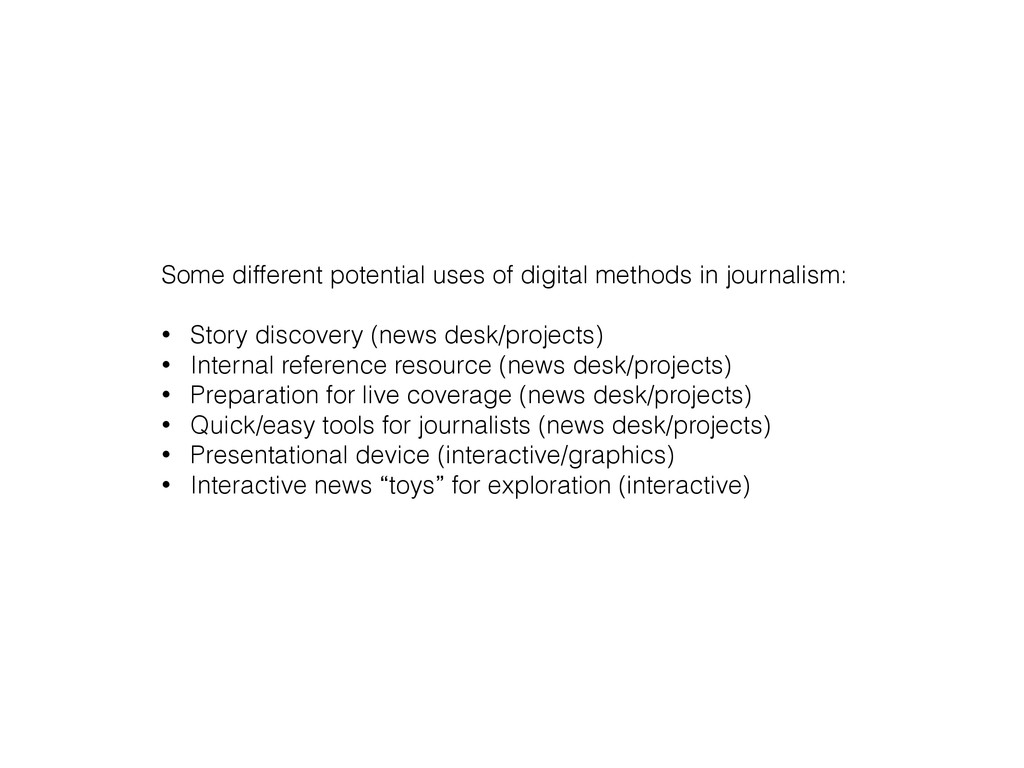
Time, resource and budget constraints • Resistance to change in (especially bigger) newsrooms, hard to introduce new tools/methods • Social scientists often want to capture complexity, journalists often want to simplify • Tension between traditional journalistic values (recency, human interest, etc) and research values • Rendering complexity readable and accessible to broader publics - not just issue experts/researchers • Keeping interactive projects about current events up to date • Not just tool provision, but also training • Transparency of tools and interpretation of results • Some of tools are complex to install and no web version available • Speed of using tools as events unfold • Efficiency of these methods compared to others • Hard to find stories in data
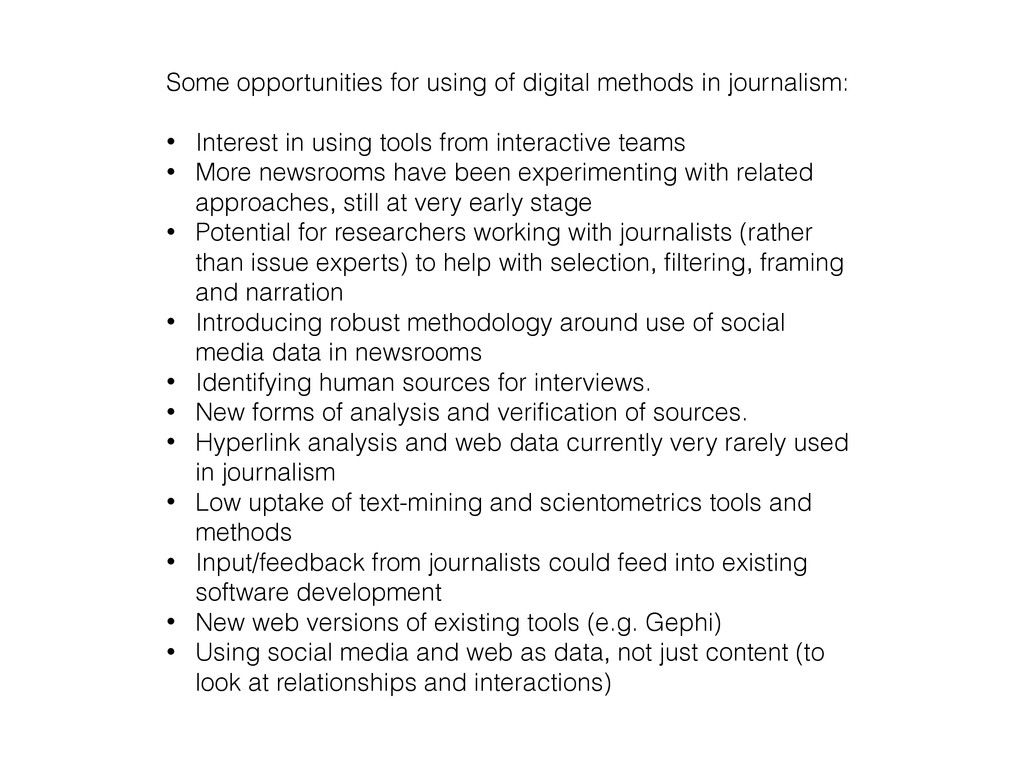
• Interest in using tools from interactive teams • More newsrooms have been experimenting with related approaches, still at very early stage • Potential for researchers working with journalists (rather than issue experts) to help with selection, filtering, framing and narration • Introducing robust methodology around use of social media data in newsrooms • Identifying human sources for interviews. • New forms of analysis and verification of sources. • Hyperlink analysis and web data currently very rarely used in journalism • Low uptake of text-mining and scientometrics tools and methods • Input/feedback from journalists could feed into existing software development • New web versions of existing tools (e.g. Gephi) • Using social media and web as data, not just content (to look at relationships and interactions)