Upgrade to Pro — share decks privately, control downloads, hide ads and more …

Exploratory-v54-Introduction-en.pdf

Kan Nishida
December 04, 2019

 Exploratory-v54-Introduction-en.pdf

Kan is going to introduce some of the key new features of Exploratory v5.4.

- Google Analytics
- Super Table
- Chart: Edit Display Name
- Chart: Error Bar
- Analytics: Dependency Plot
- Data Catalog

etc.

Kan Nishida

December 04, 2019
Tweet

More Decks by Kan Nishida

Other Decks in Technology

Transcript

  1. Kan Nishida CEO/co-founder Exploratory Summary Beginning of 2016, launched Exploratory,

    Inc. to democratize Data Science. Prior to Exploratory, Kan was a director of product development at Oracle leading teams for building various Data Science products in areas including Machine Learning, BI, Data Visualization, Mobile Analytics, Big Data, etc. While at Oracle, Kan also provided training and consulting services to help organizations transform with data. @KanAugust Speaker
  2. Questions Communication (Dashboard, Note, Slides) Data Access Data Wrangling Visualization

    Analytics (Statistics / Machine Learning) Data Analysis What you can do with Exploratory
  3. • Google Analytics • Super Table • ChartɿChanging Legend Label

    Text, ‘Others’ Group • Chart : Error Bar • Analytics : Effects by Variables, Multicollinearity, Log, Repeat By • Note : New Format • Data Catalog
  4. • Google Analytics • Super Table • ChartɿChanging Legend Label

    Text, ‘Others’ Group • Chart : Error Bar • Analytics : Effects by Variables, Multicollinearity, Log, Repeat By • Note : New Format • Data Catalog
  5. Much Better Experience! • Select dimensions & measures • Change

    the account, the property, and the view • Select a segment from the dropdown • Set the date range
  6. • Google Analytics • Super Table • ChartɿChanging Legend Label

    Text, ‘Others’ Group • Chart : Error Bar • Analytics : Effects by Variables, Multicollinearity, Log, Repeat By • Note : New Format • Data Catalog
  7. • Select Columns • Re-order Columns • Configure Each Column

    - Column header name, Number / Date format, Color, etc. More Visually Intuitive & More Controls
  8. • Change Column Header Names • Apply Functions to Data

    • Setup Sorting Rules • Format Number/Date Data • Create URL Links • Setup Visual Formatting Column Setting
  9. Visual Formatting • Show Bar on Background • Assign Color

    to Text or Background • Conditional Formatting
  10. • Google Analytics • Super Table • ChartɿChanging Legend Label

    Text, ‘Others’ Group • Chart : Error Bar • Analytics : Effects by Variables, Multicollinearity, Log, Repeat By • Note : New Format • Data Catalog
  11. • Google Analytics • Super Table • ChartɿChanging Legend Label

    Text, ‘Others’ Group • Chart : Error Bar • Analytics : Effects by Variables, Multicollinearity, Log, Repeat By • Note : New Format • Data Catalog
  12. • Google Analytics • Super Table • ChartɿChanging Legend Label

    Text, ‘Others’ Group • Chart : Error Bar • Analytics : Effects by Variables, Multicollinearity, Log, Repeat By • Note : New Format • Data Catalog
  13. • Google Analytics • Super Table • ChartɿChanging Legend Label

    Text, ‘Others’ Group • Chart : Error Bar • Analytics : Effects by Variables, Multicollinearity, Log, Repeat By • Note : New Format • Data Catalog
  14. Analytics • Effects by Variables • Multicollinearity • Base Level

    • Numeric Functions - Log, Normalize, Integer, etc. • Outliers Removal • Summary Table - Showing Bars with Repeat By
  15. • Google Analytics • Super Table • ChartɿChanging Legend Label

    Text, ‘Others’ Group • Chart : Error Bar • Analytics : Effects by Variables, Multicollinearity, Log, Repeat By • Note : New Format • Data Catalog
  16. • Google Analytics • Super Table • ChartɿChanging Legend Label

    Text, ‘Others’ Group • Chart : Error Bar • Analytics : Effects by Variables, Multicollinearity, Log, Repeat By • Note : New Format • Data Catalog
  17. Exploratory Desktop BI Excel R / Python / JS Exploratory

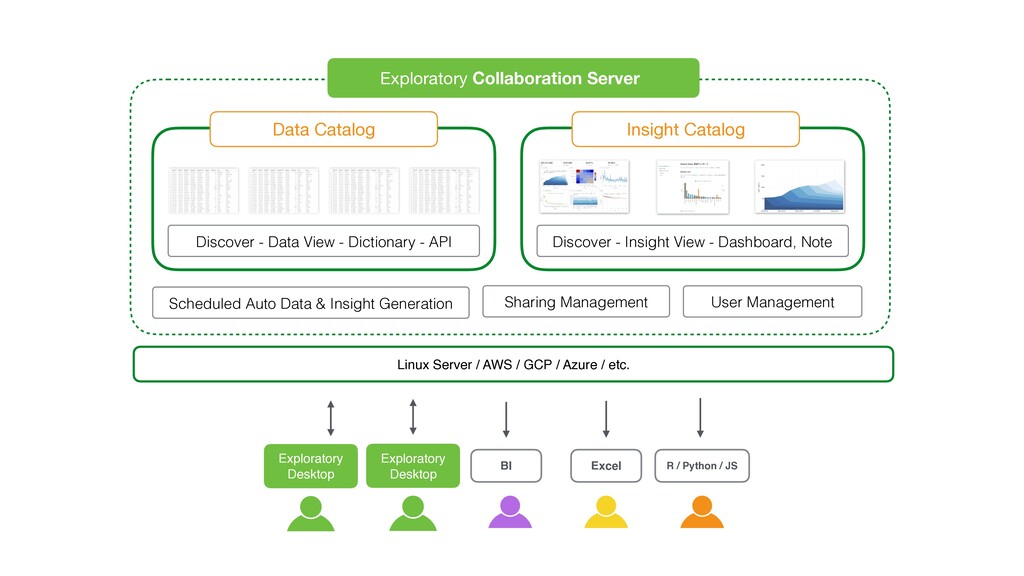
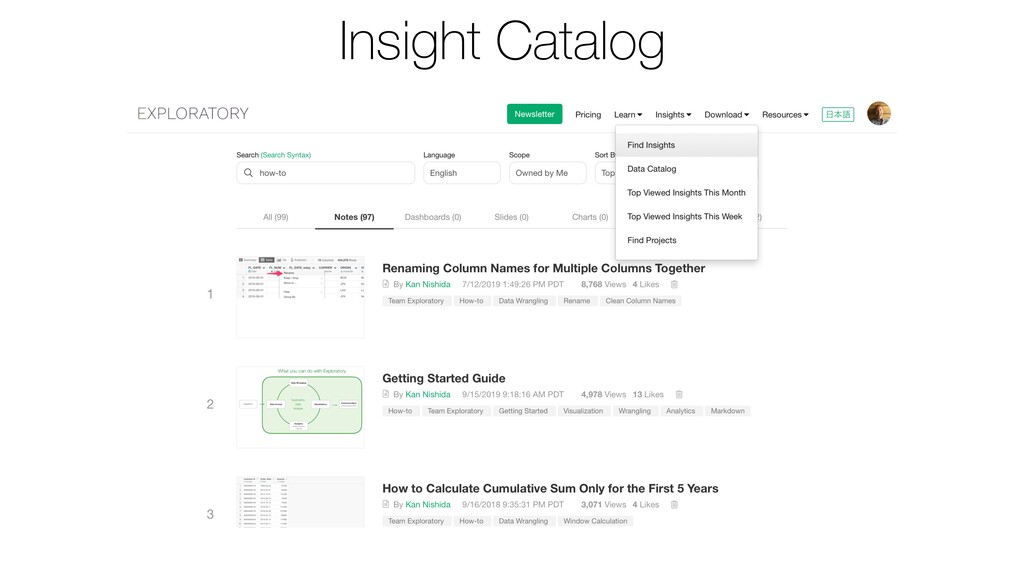
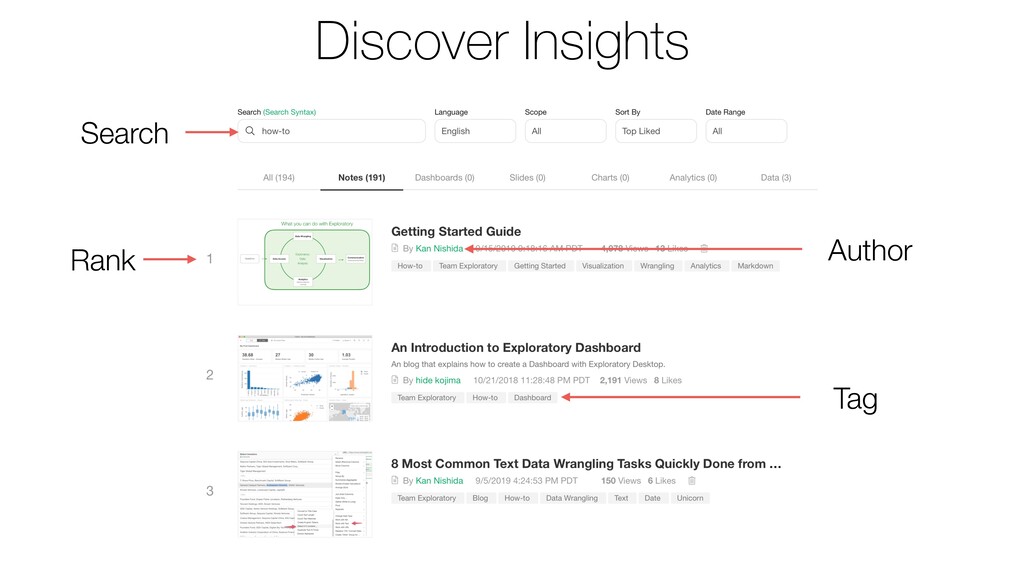
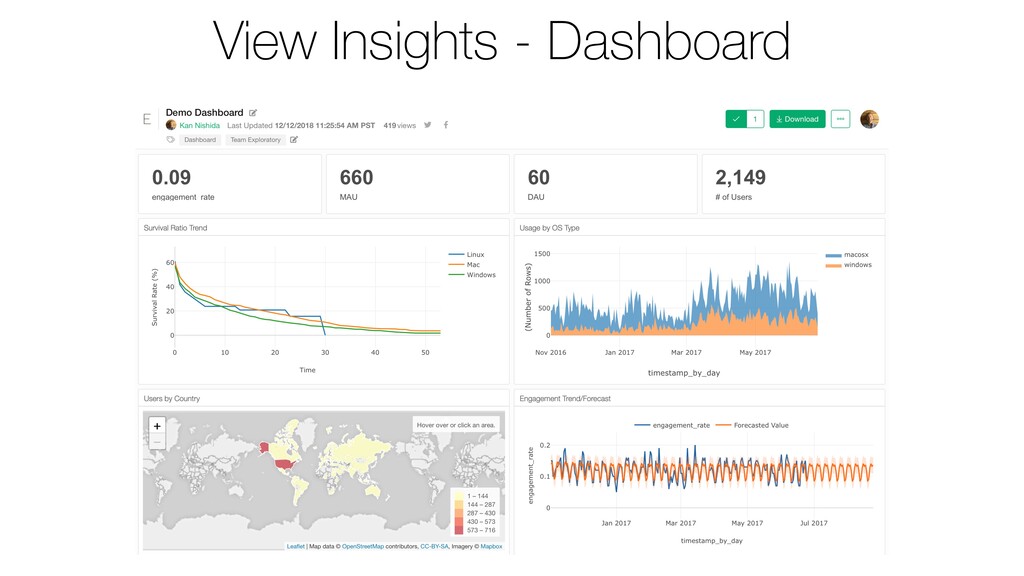
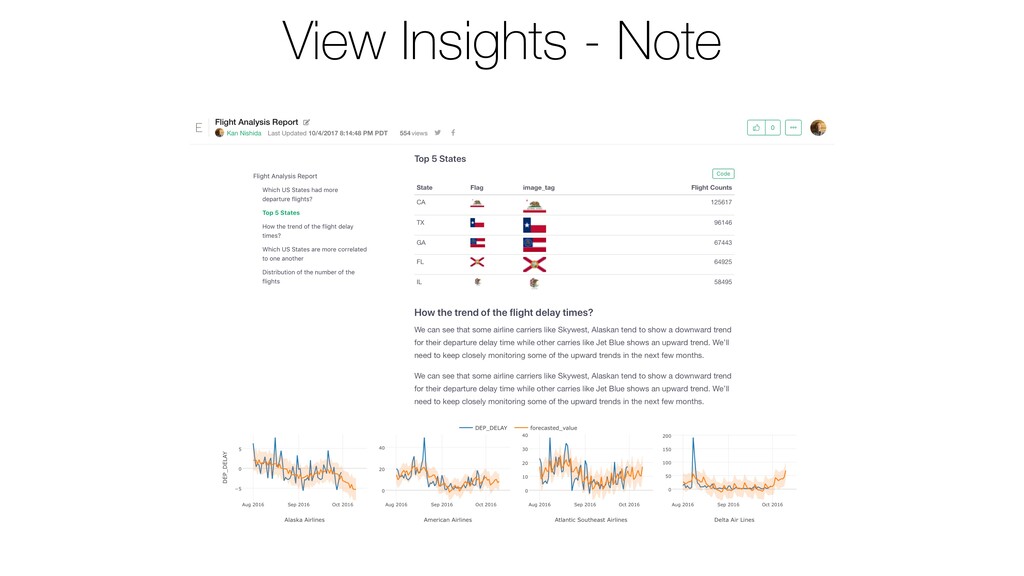
    Desktop Scheduled Auto Data & Insight Generation Discover - Data View - Dictionary - API Exploratory Collaboration Server Data Catalog Linux Server / AWS / GCP / Azure / etc. Insight Catalog Discover - Insight View - Dashboard, Note User Management Sharing Management
  18. Create Insights & Data Publish Discover Data Insight & Data

    Management with Collaboration Server Share Extend
  19. Price • Starts from $2,498 / year. • Up to

    3 authors & 10 viewers. • Requires separate subscriptions for Exploratory Desktop, but no minimal subscriptions.