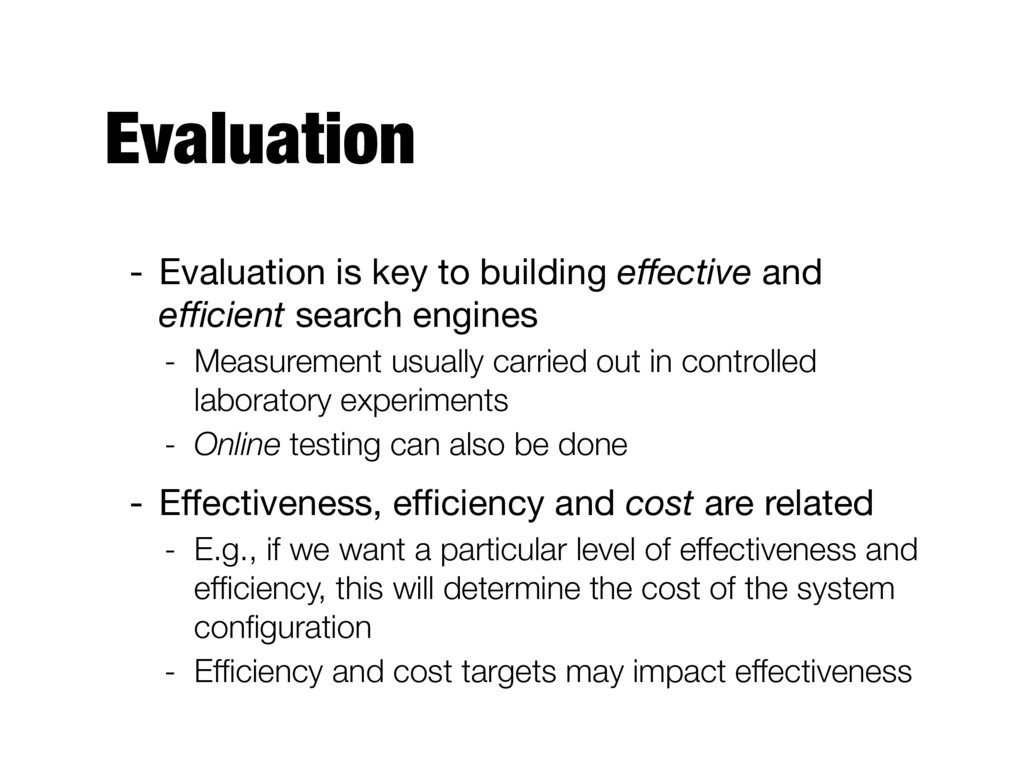
search engines - Measurement usually carried out in controlled laboratory experiments - Online testing can also be done - Effectiveness, efficiency and cost are related - E.g., if we want a particular level of effectiveness and efficiency, this will determine the cost of the system configuration - Efficiency and cost targets may impact effectiveness
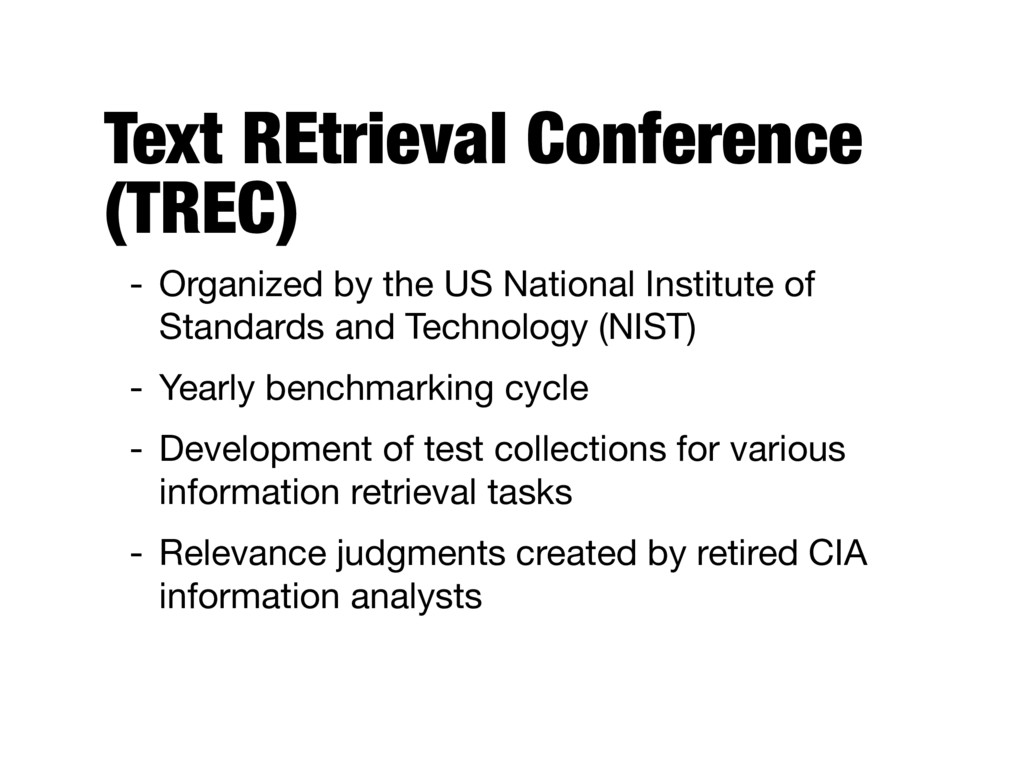
Institute of Standards and Technology (NIST) - Yearly benchmarking cycle - Development of test collections for various information retrieval tasks - Relevance judgments created by retired CIA information analysts
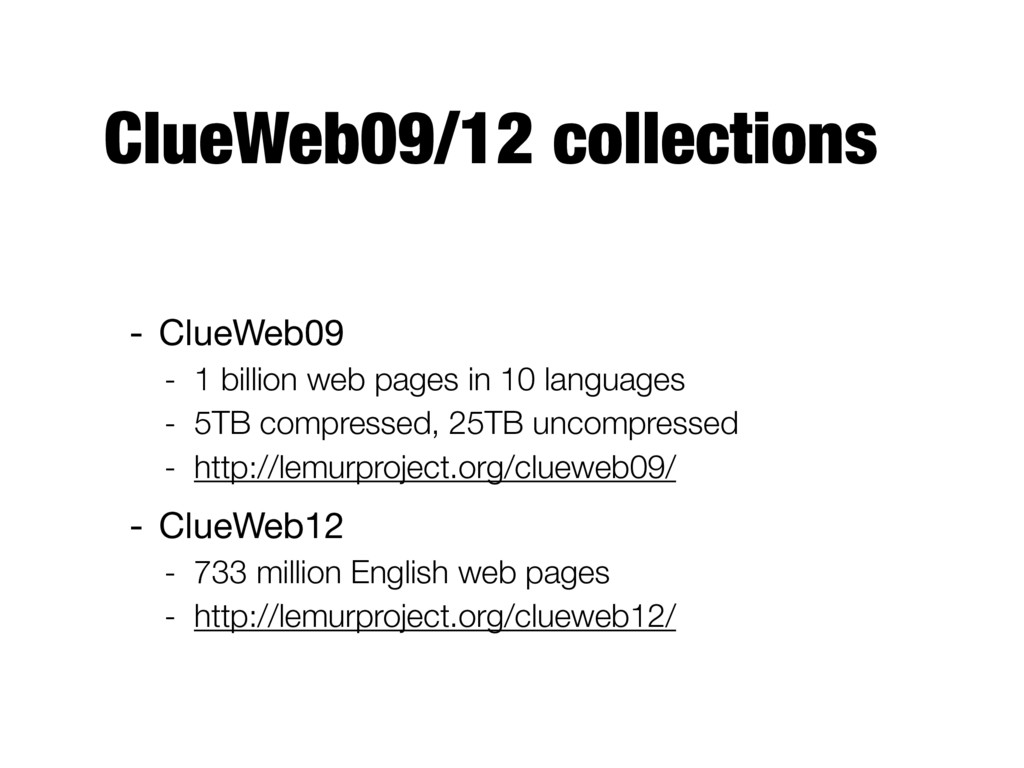
10 languages - 5TB compressed, 25TB uncompressed - http://lemurproject.org/clueweb09/ - ClueWeb12 - 733 million English web pages - http://lemurproject.org/clueweb12/
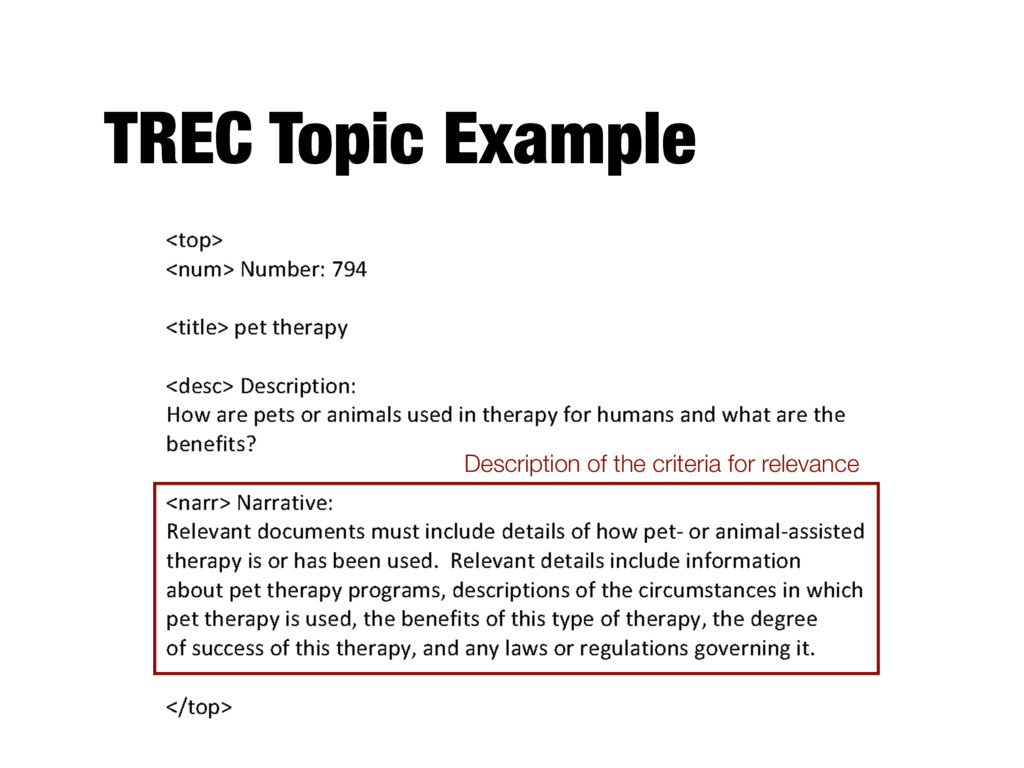
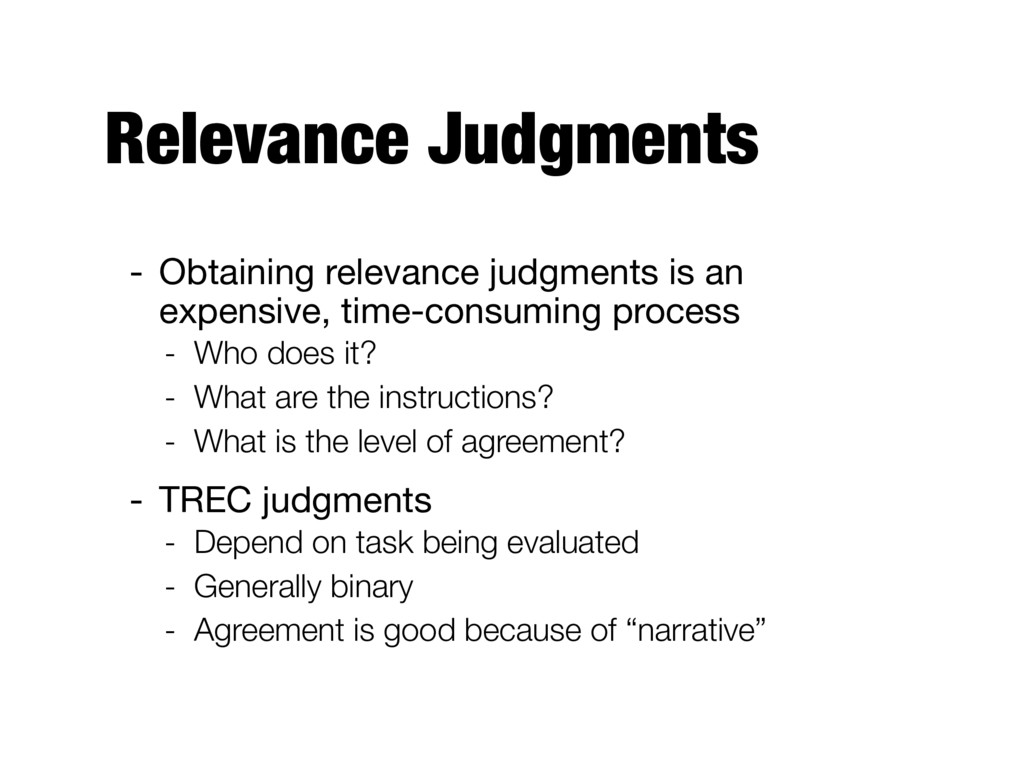
process - Who does it? - What are the instructions? - What is the level of agreement? - TREC judgments - Depend on task being evaluated - Generally binary - Agreement is good because of “narrative”
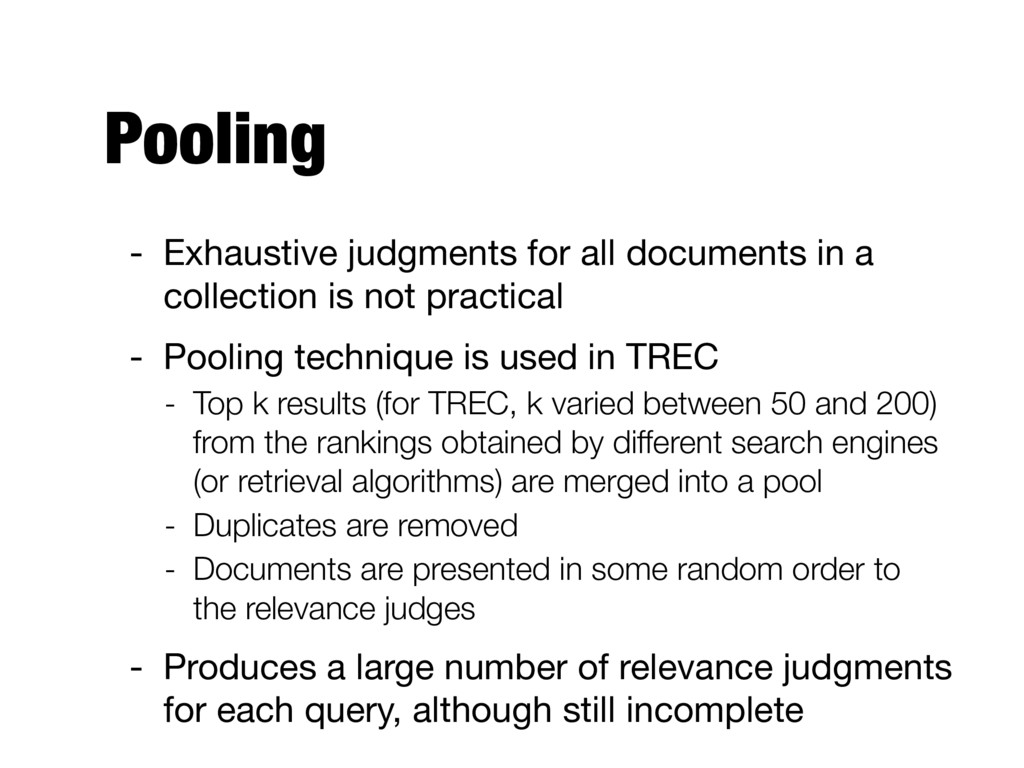
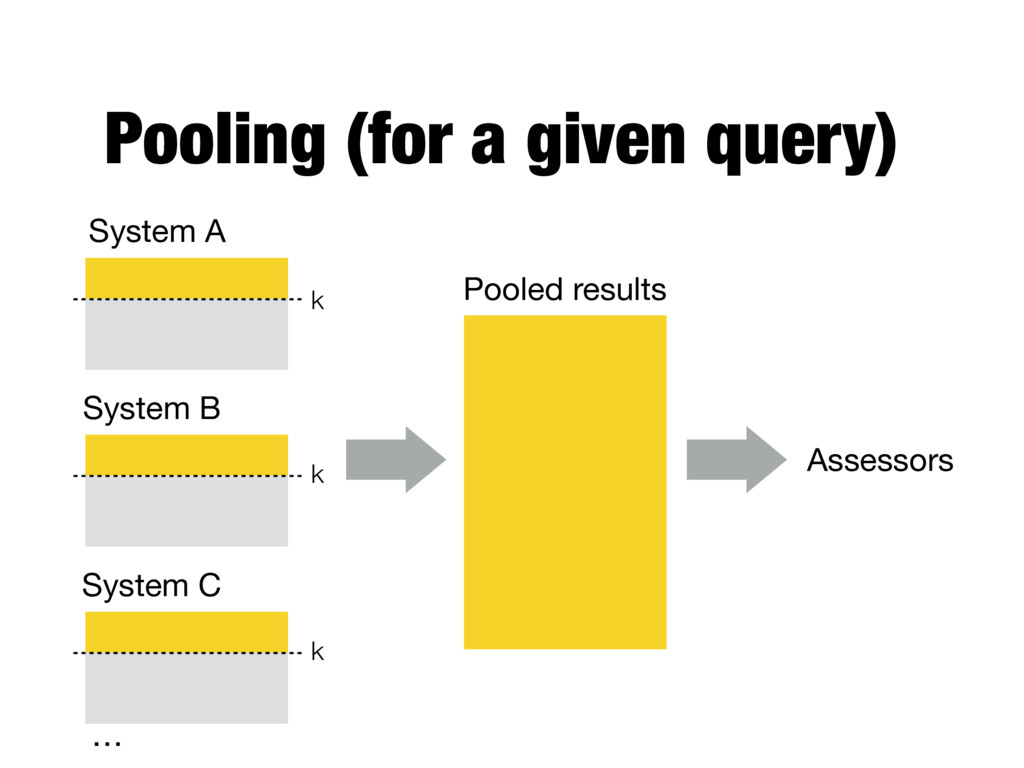
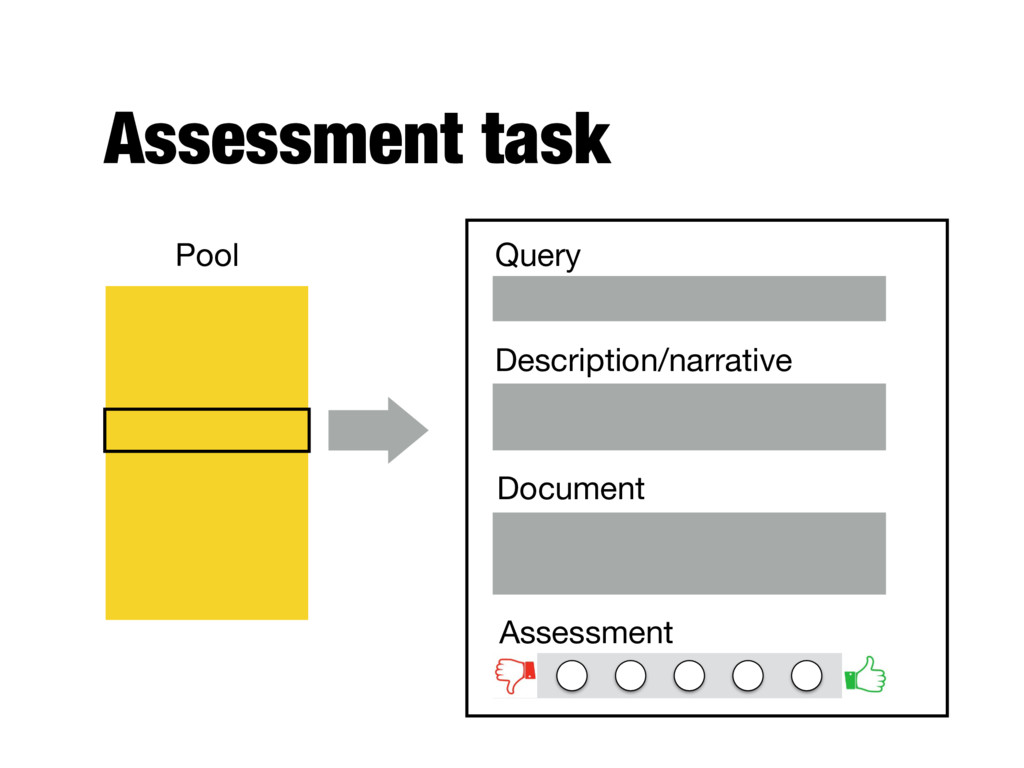
is not practical - Pooling technique is used in TREC - Top k results (for TREC, k varied between 50 and 200) from the rankings obtained by different search engines (or retrieval algorithms) are merged into a pool - Duplicates are removed - Documents are presented in some random order to the relevance judges - Produces a large number of relevance judgments for each query, although still incomplete
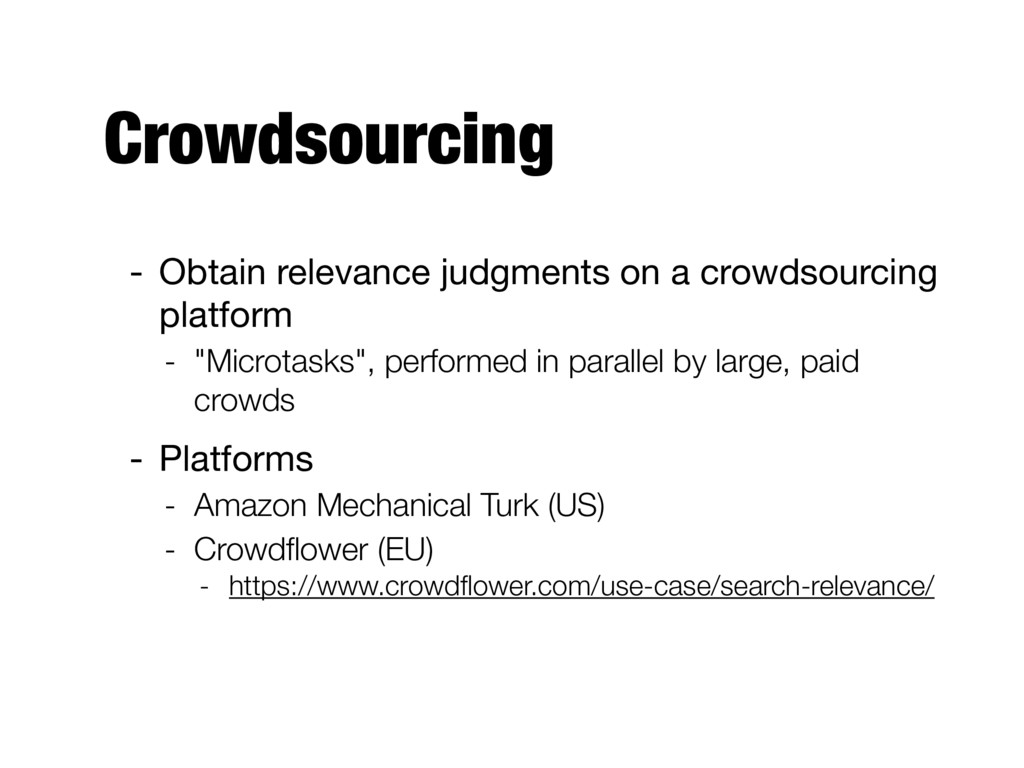
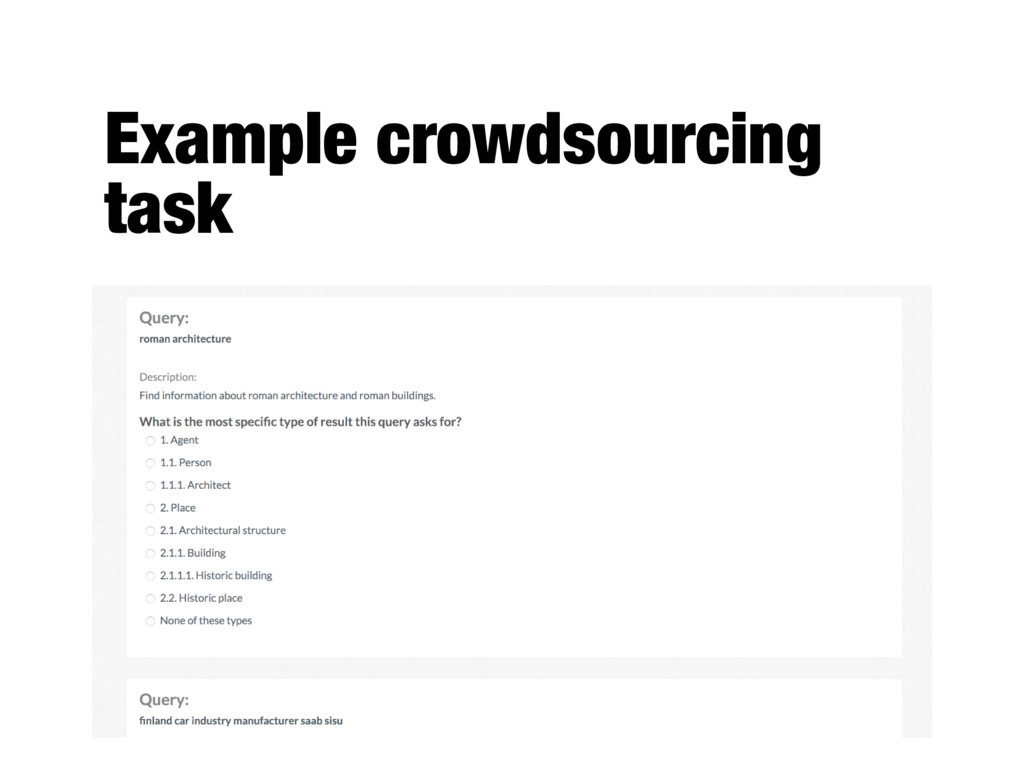
"Microtasks", performed in parallel by large, paid crowds - Platforms - Amazon Mechanical Turk (US) - Crowdflower (EU) - https://www.crowdflower.com/use-case/search-relevance/
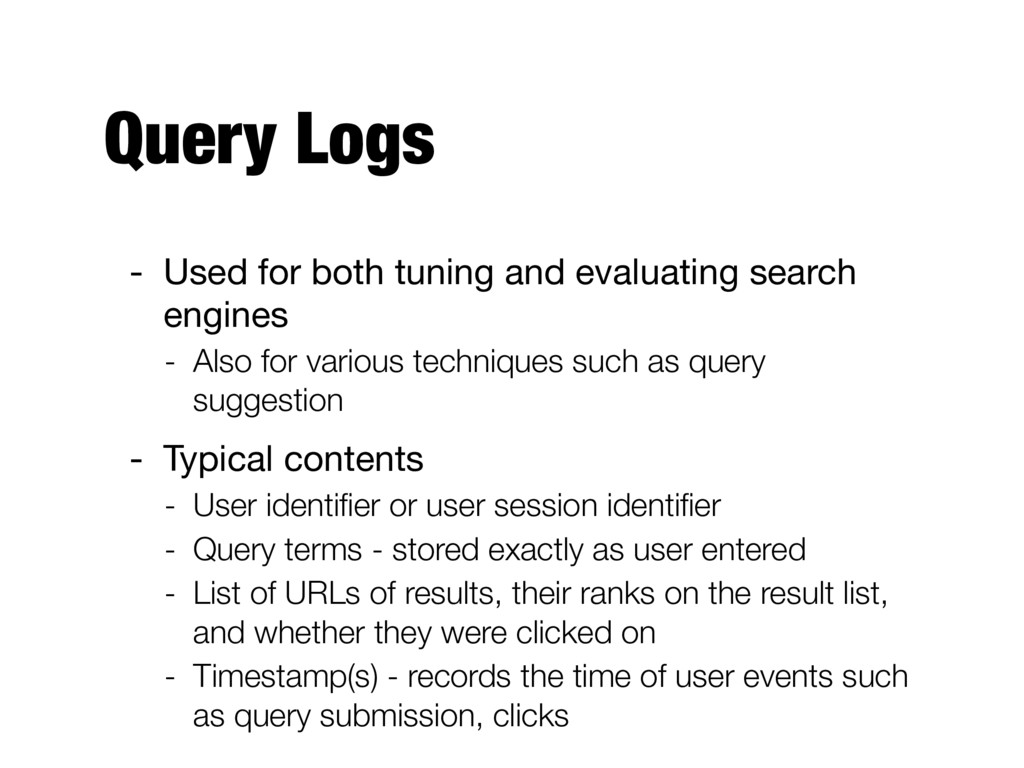
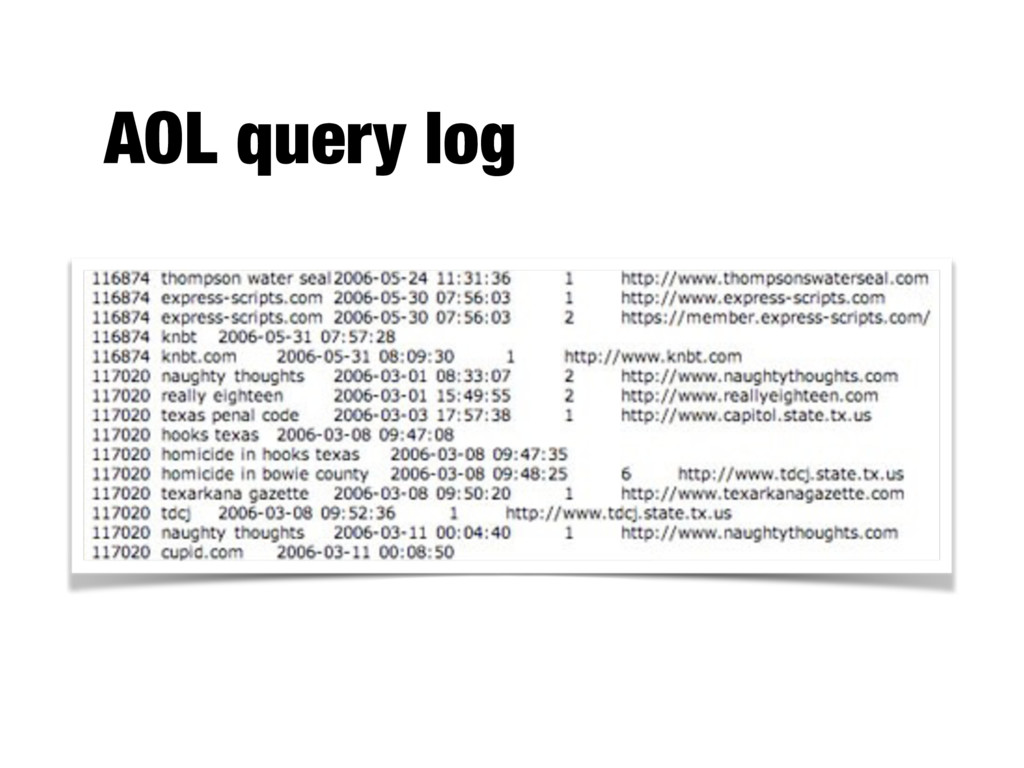
engines - Also for various techniques such as query suggestion - Typical contents - User identifier or user session identifier - Query terms - stored exactly as user entered - List of URLs of results, their ranks on the result list, and whether they were clicked on - Timestamp(s) - records the time of user events such as query submission, clicks
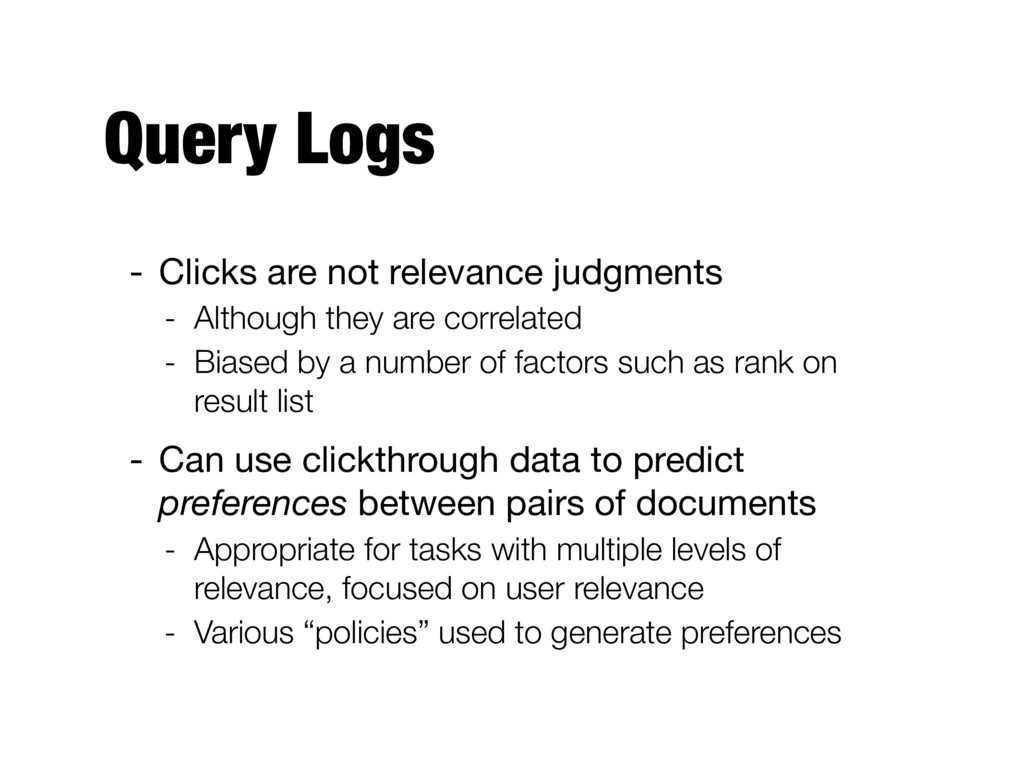
they are correlated - Biased by a number of factors such as rank on result list - Can use clickthrough data to predict preferences between pairs of documents - Appropriate for tasks with multiple levels of relevance, focused on user relevance - Various “policies” used to generate preferences
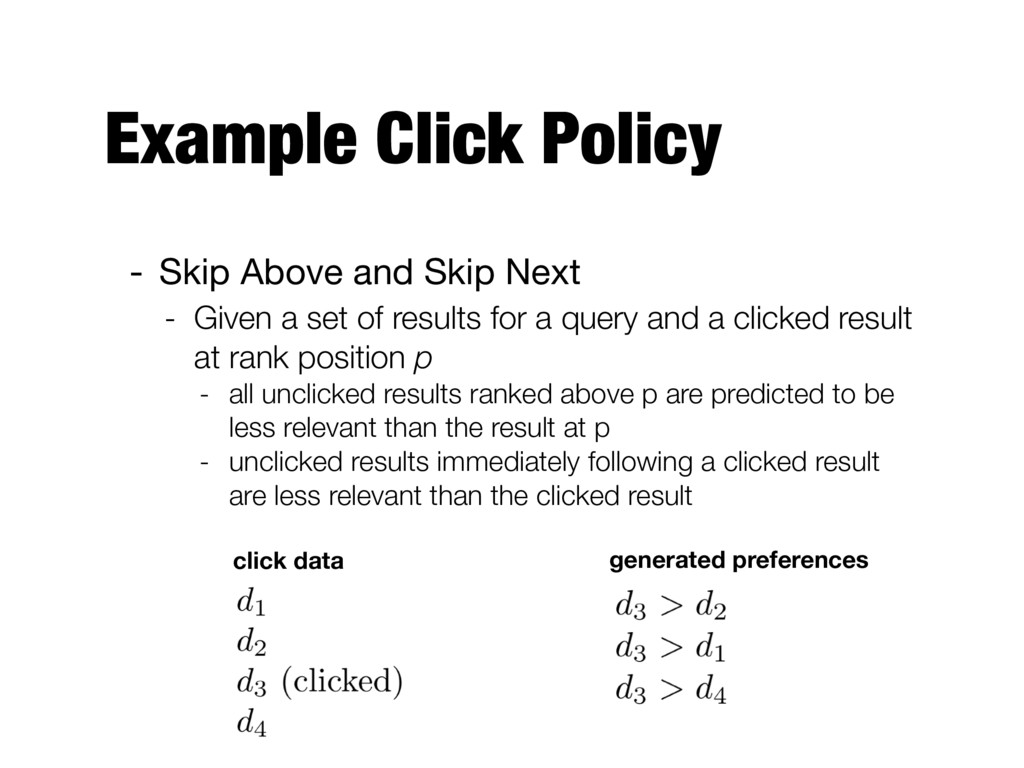
Given a set of results for a query and a clicked result at rank position p - all unclicked results ranked above p are predicted to be less relevant than the result at p - unclicked results immediately following a clicked result are less relevant than the clicked result click data generated preferences
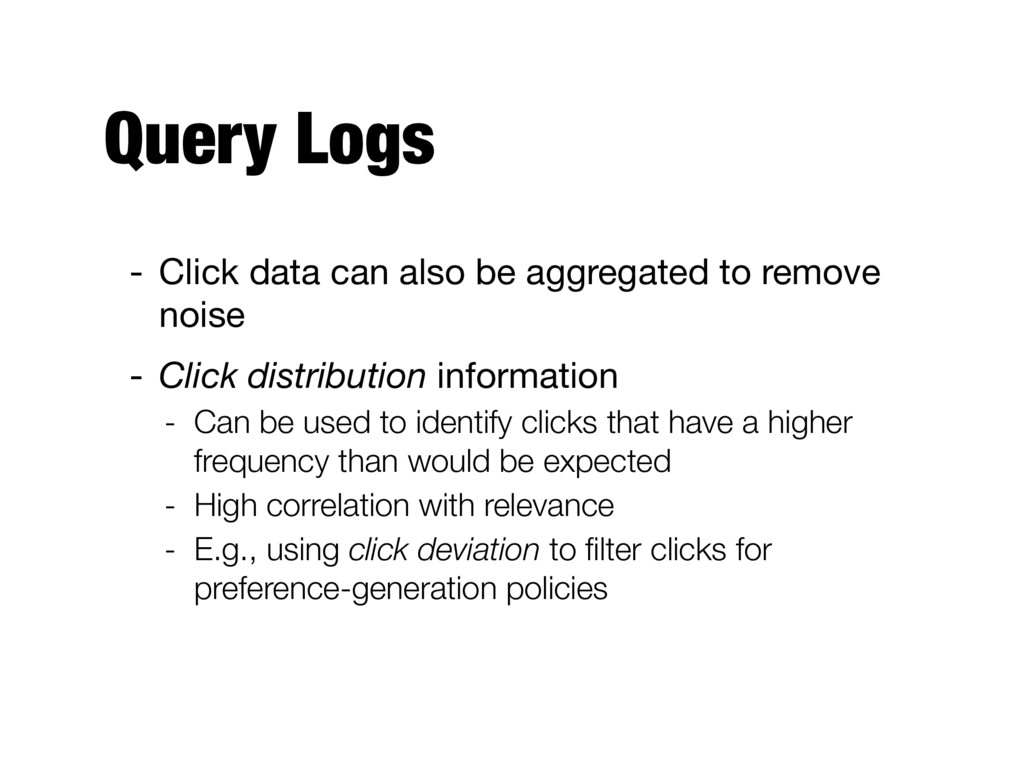
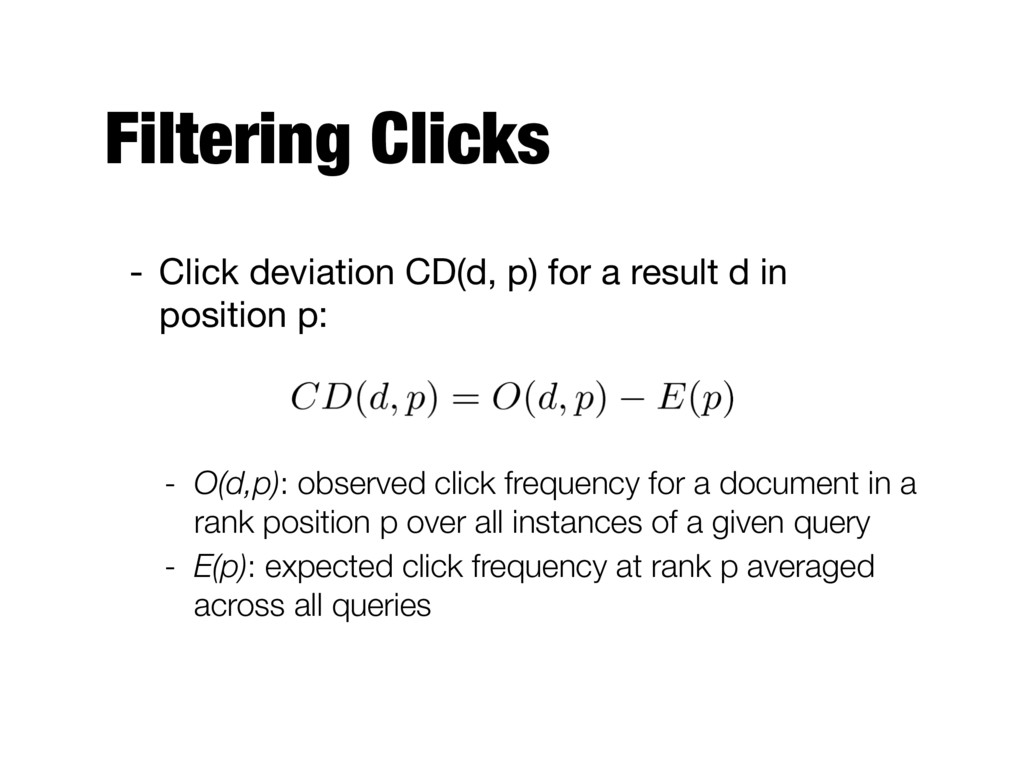
remove noise - Click distribution information - Can be used to identify clicks that have a higher frequency than would be expected - High correlation with relevance - E.g., using click deviation to filter clicks for preference-generation policies
d in position p: - O(d,p): observed click frequency for a document in a rank position p over all instances of a given query - E(p): expected click frequency at rank p averaged across all queries
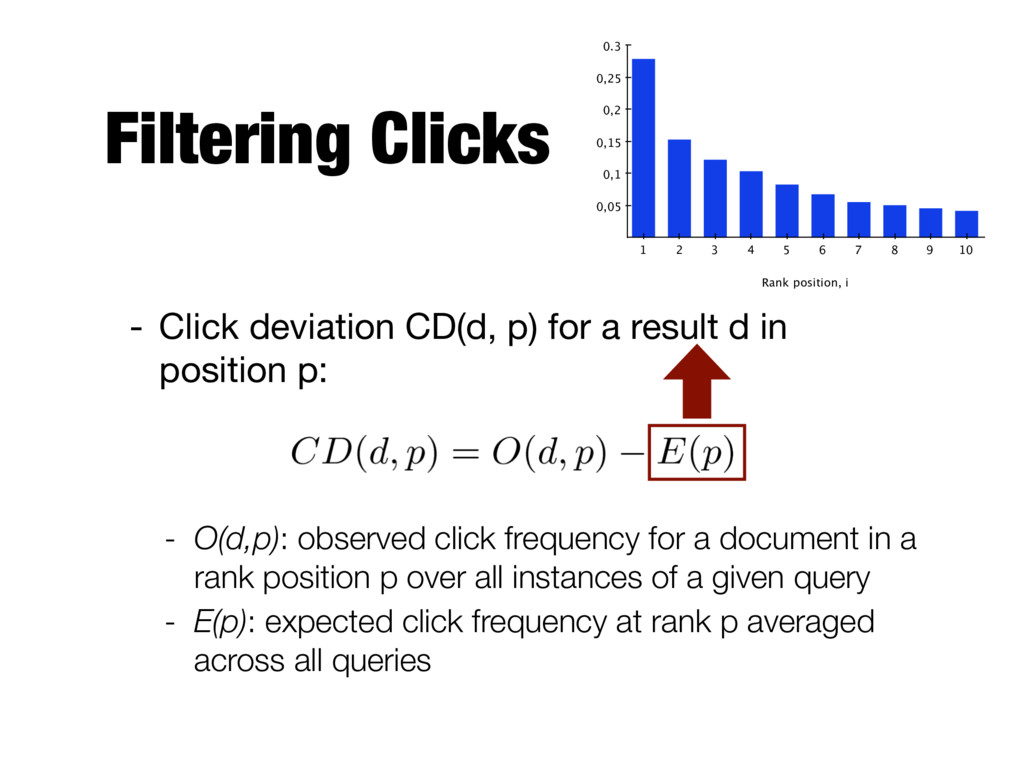
d in position p: - O(d,p): observed click frequency for a document in a rank position p over all instances of a given query - E(p): expected click frequency at rank p averaged across all queries 1 2 3 4 5 6 7 8 9 10 0.3 0,05 0,1 0,15 0,2 0,25 Rank position, i Probability of click, P(i)
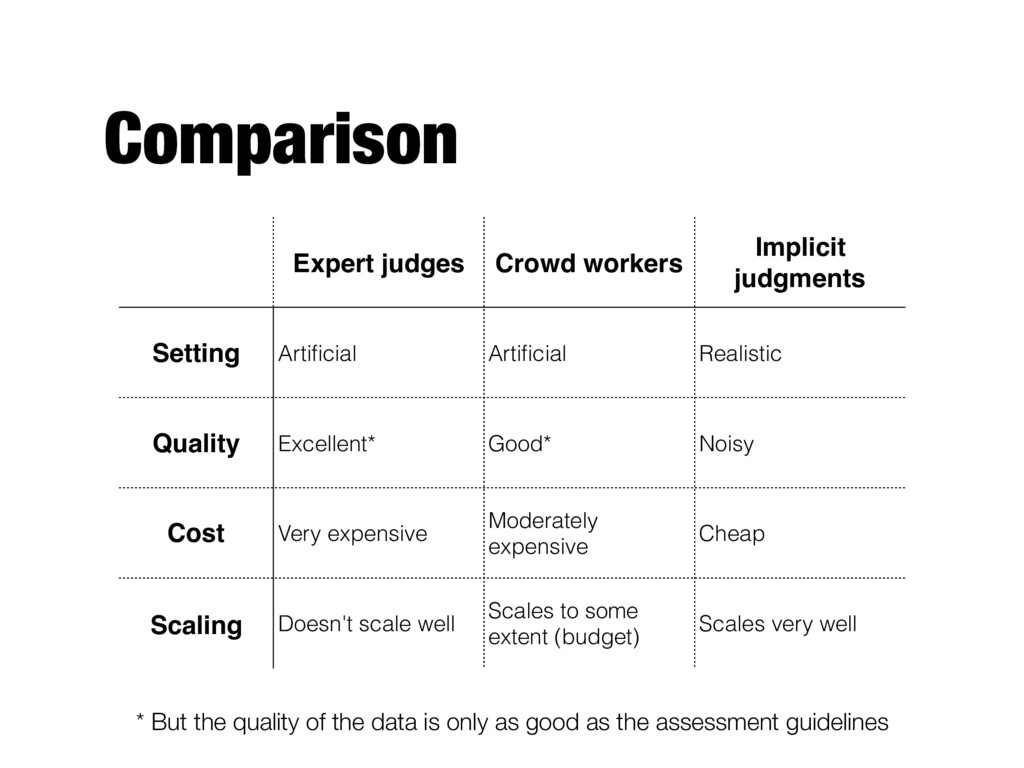
Realistic Quality Excellent* Good* Noisy Cost Very expensive Moderately expensive Cheap Scaling Doesn't scale well Scales to some extent (budget) Scales very well * But the quality of the data is only as good as the assessment guidelines
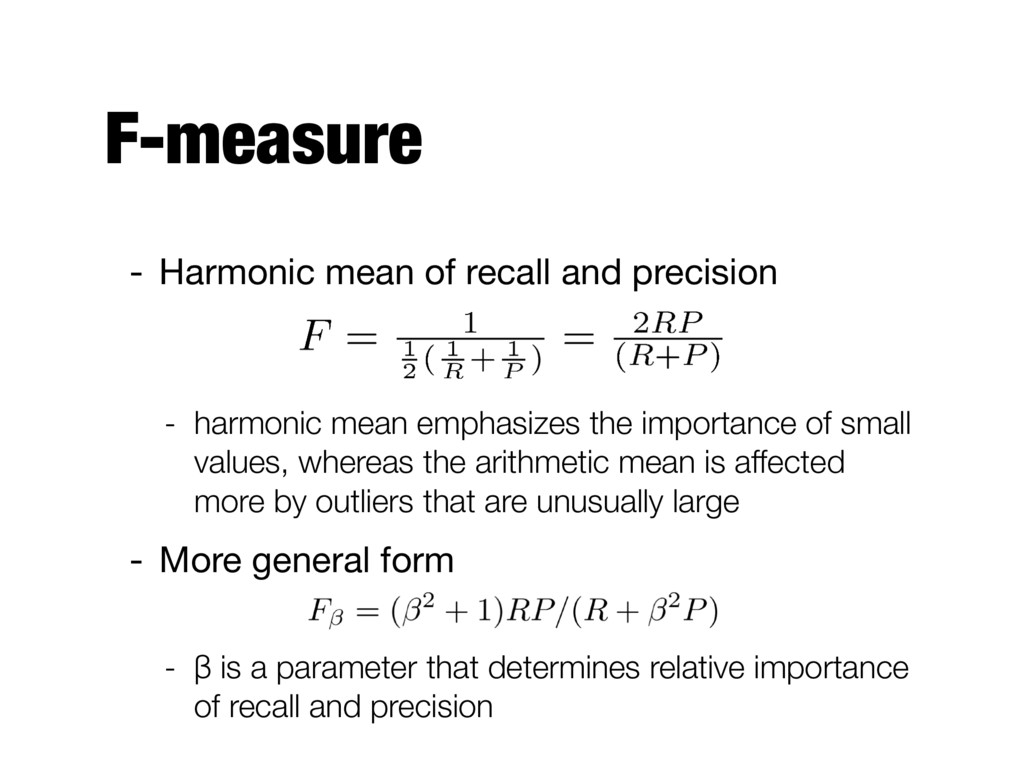
mean emphasizes the importance of small values, whereas the arithmetic mean is affected more by outliers that are unusually large - More general form - β is a parameter that determines relative importance of recall and precision
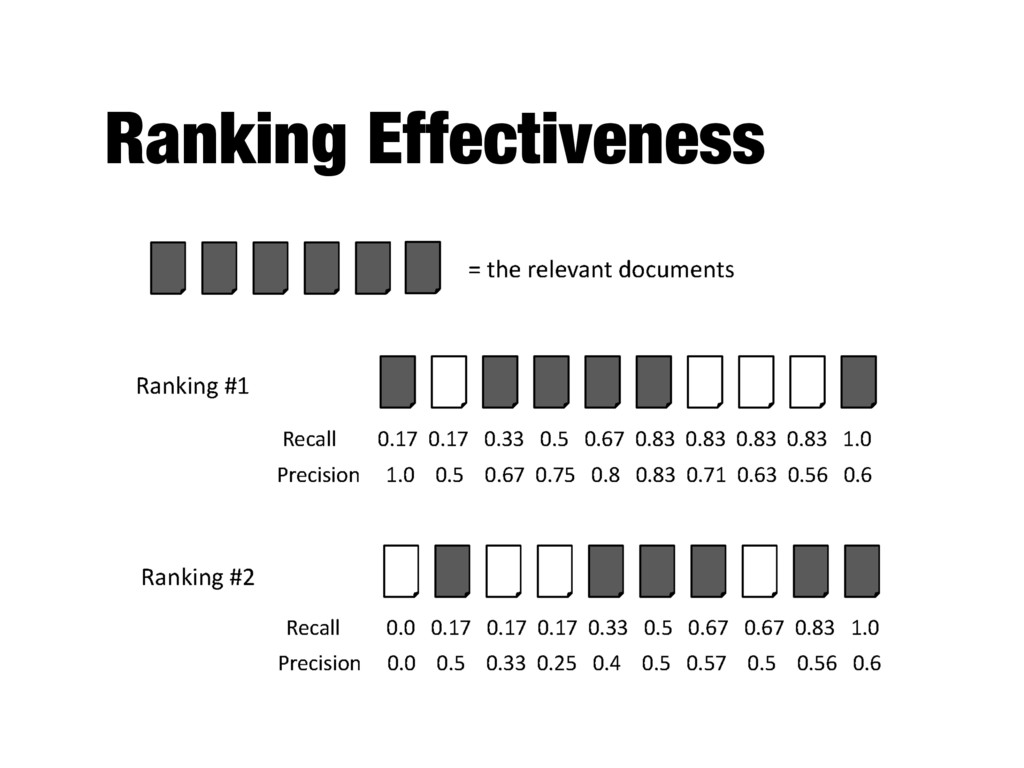
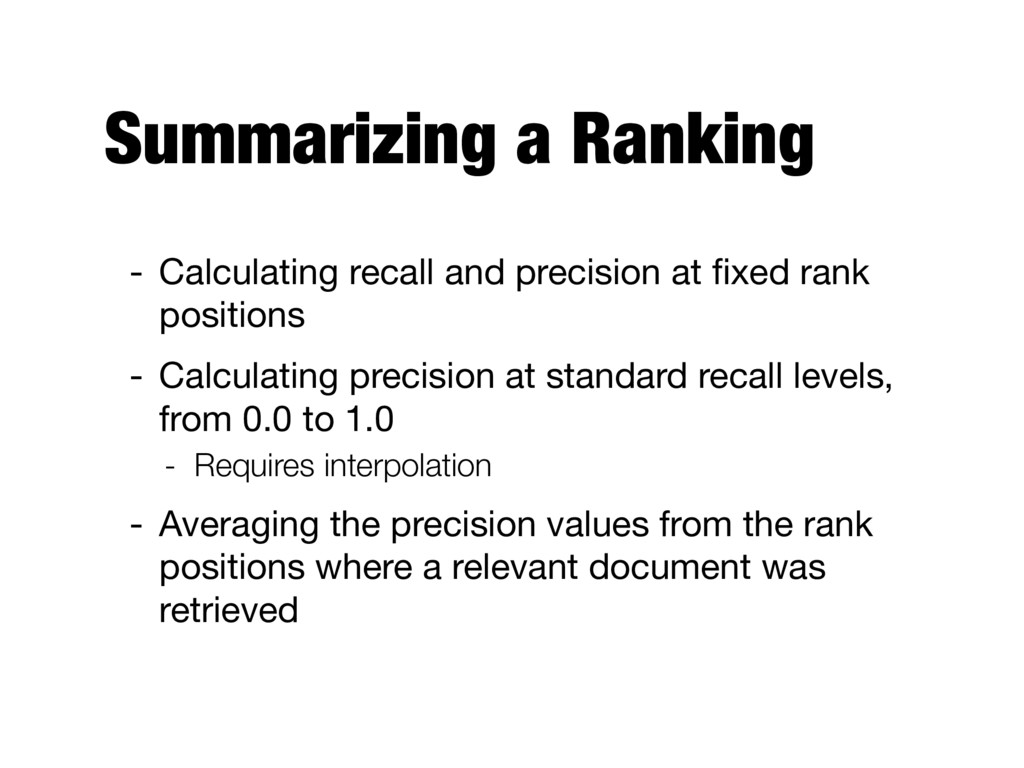
How to evaluate a ranked list? - Calculate recall and precision values at every rank position - Produces a long list of numbers (see previous slide) - Need to summarize the effectiveness of a ranking
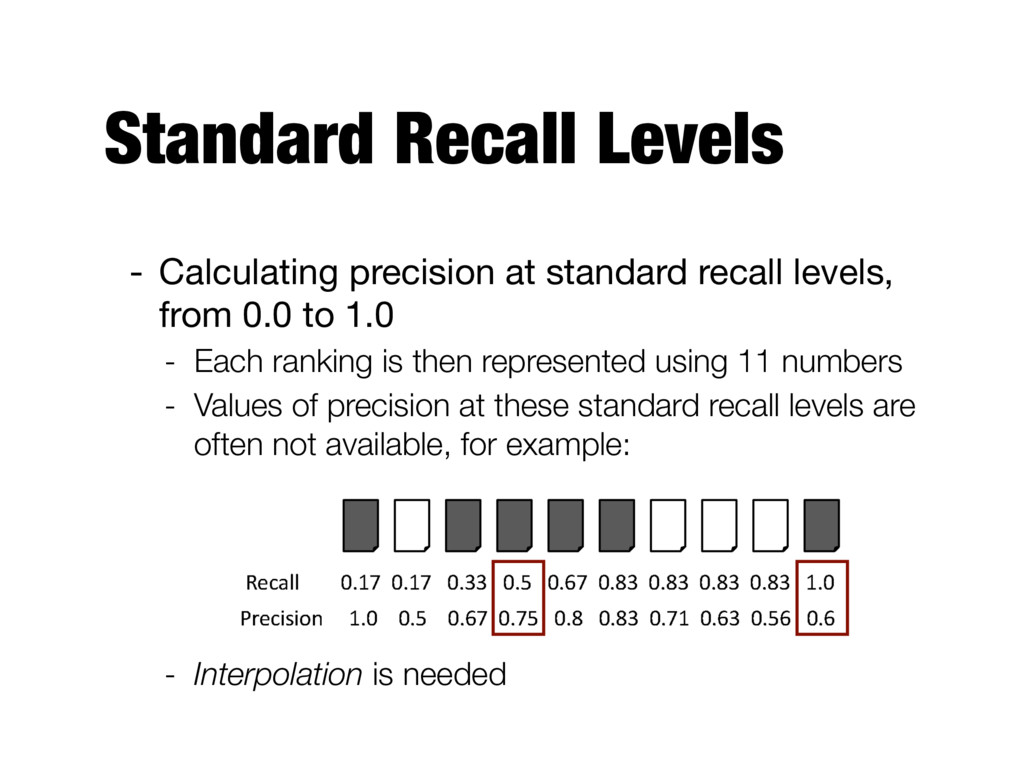
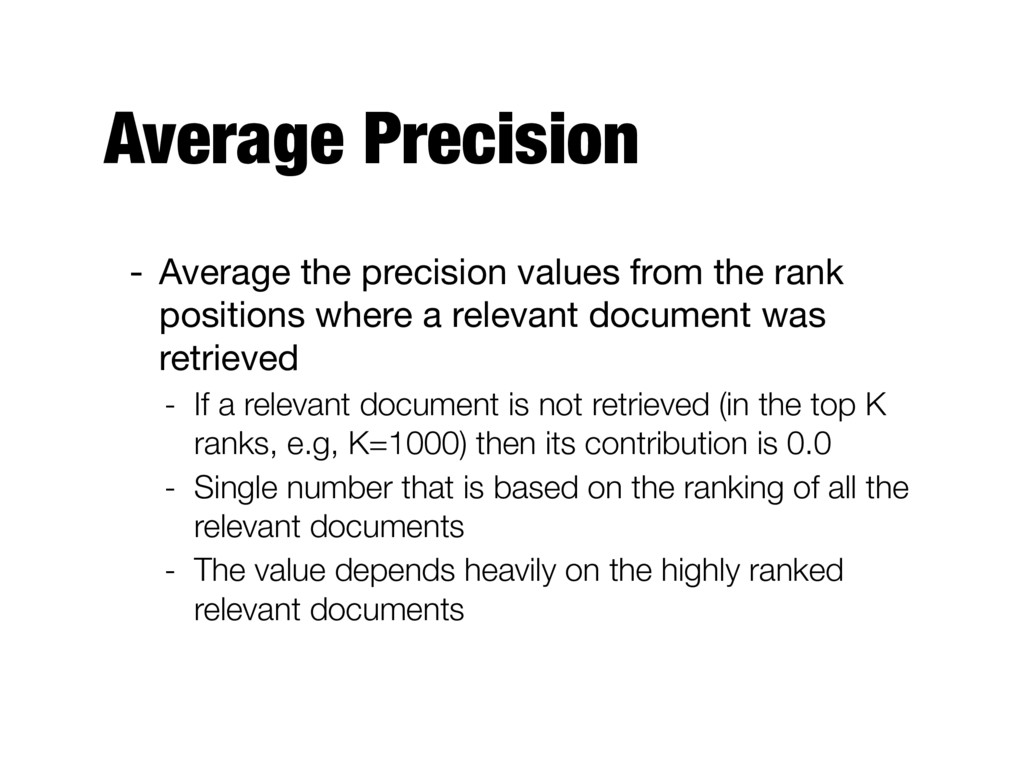
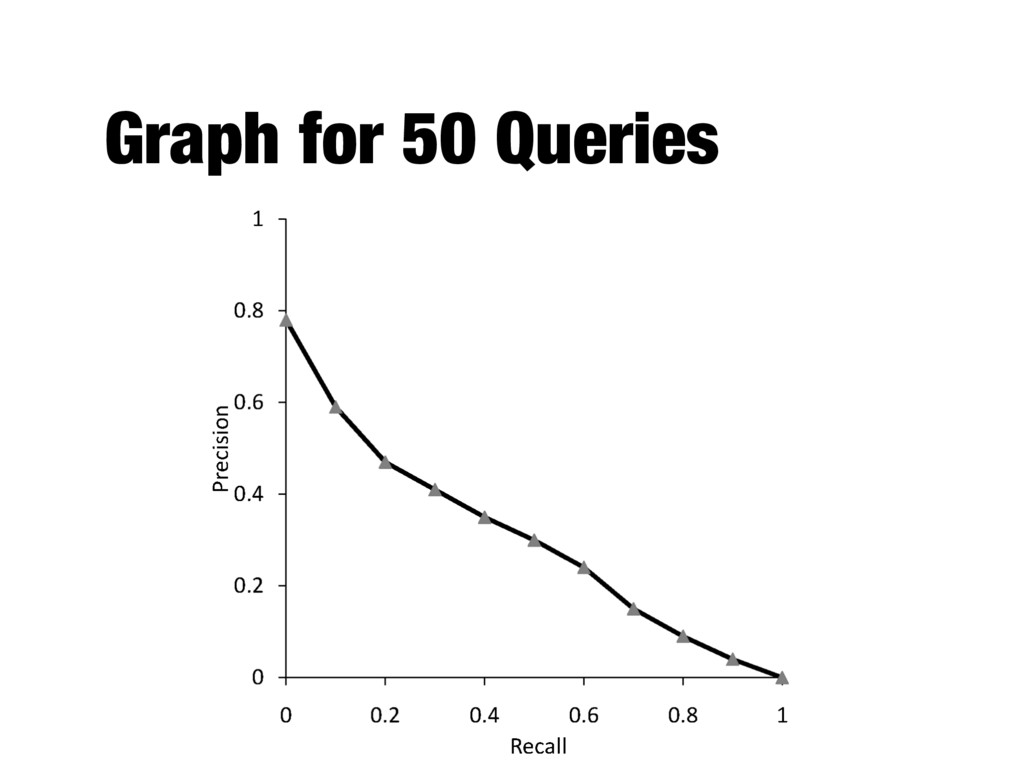
rank positions - Calculating precision at standard recall levels, from 0.0 to 1.0 - Requires interpolation - Averaging the precision values from the rank positions where a relevant document was retrieved
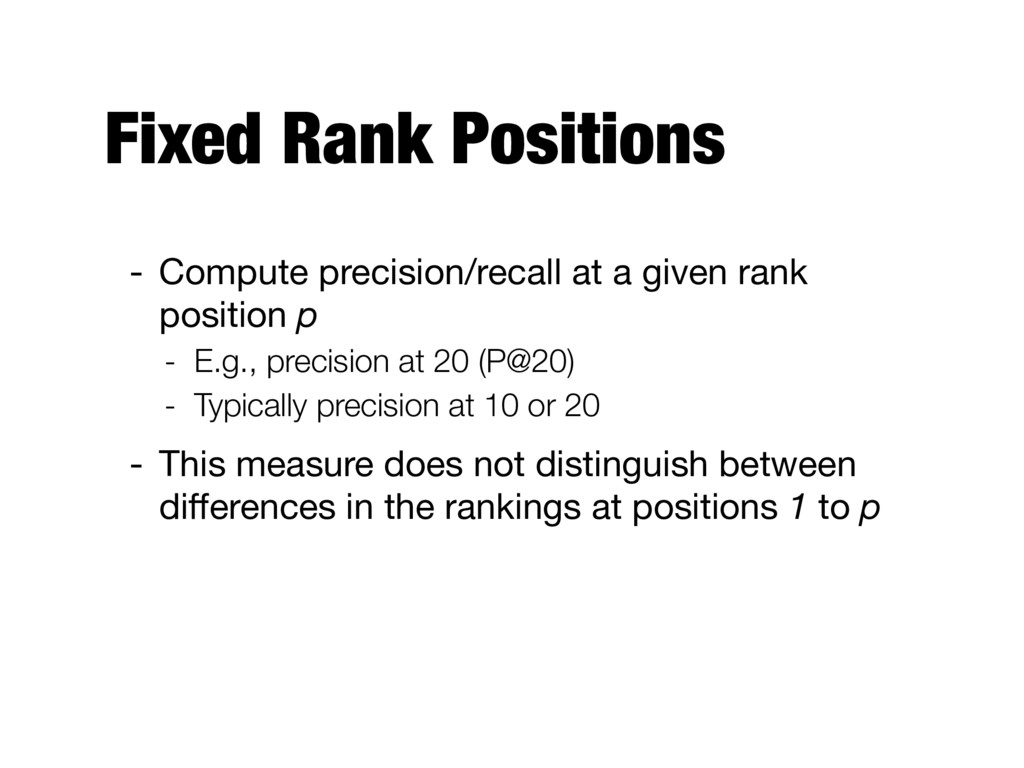
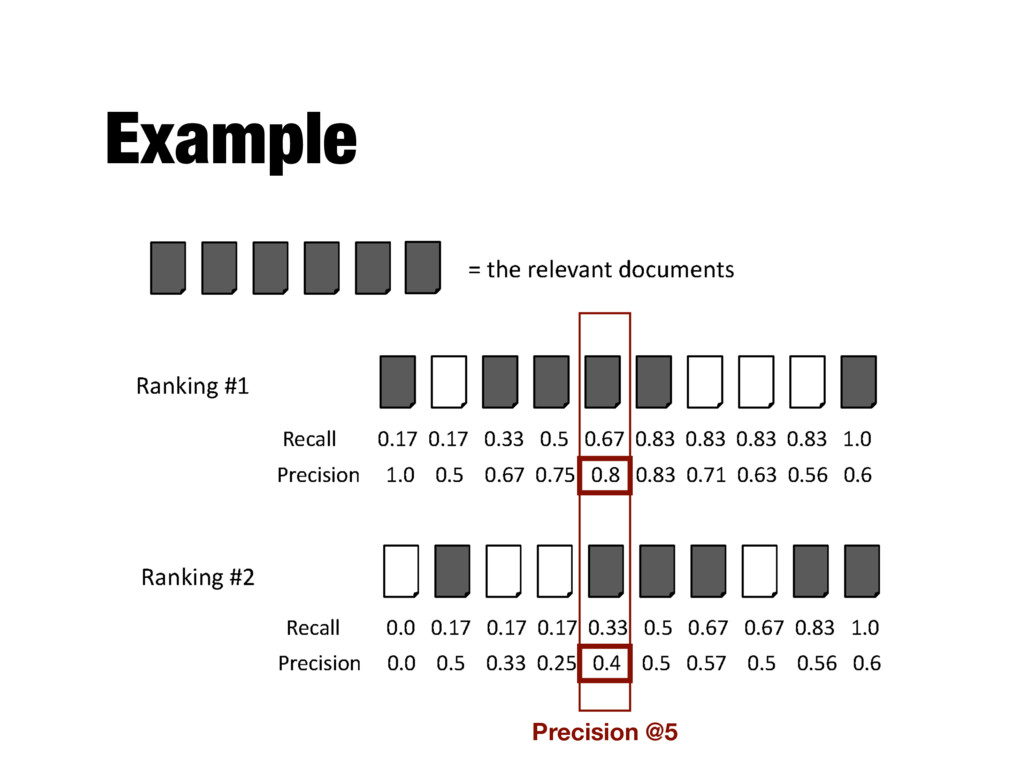
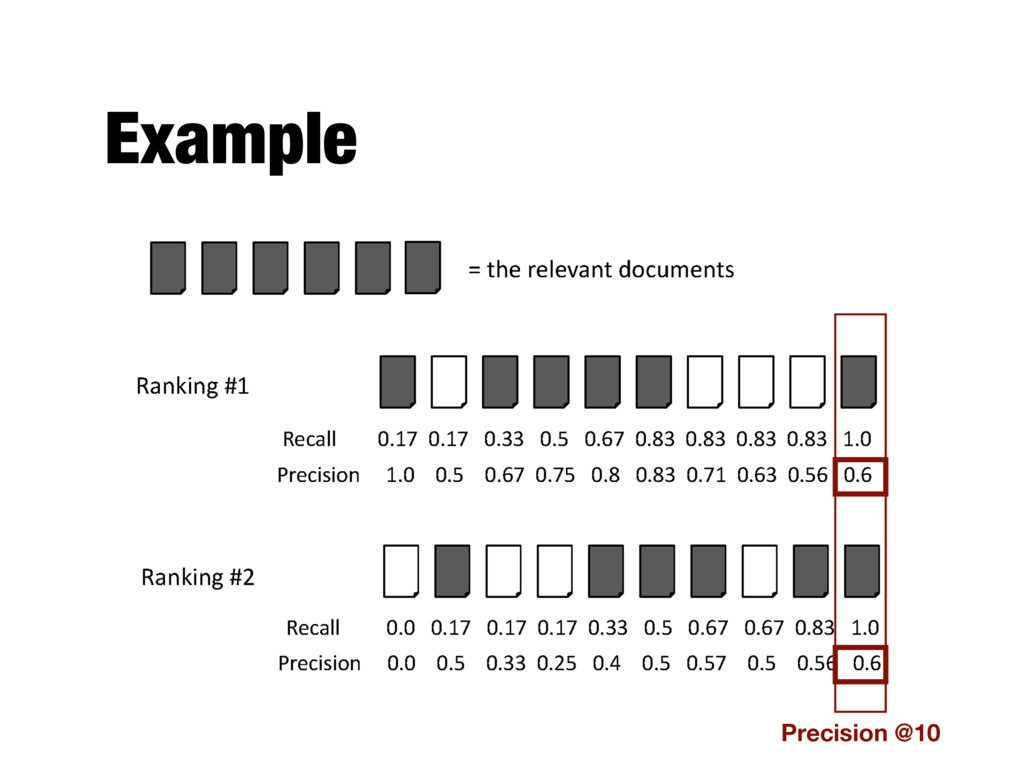
position p - E.g., precision at 20 (P@20) - Typically precision at 10 or 20 - This measure does not distinguish between differences in the rankings at positions 1 to p
from 0.0 to 1.0 - Each ranking is then represented using 11 numbers - Values of precision at these standard recall levels are often not available, for example: - Interpolation is needed
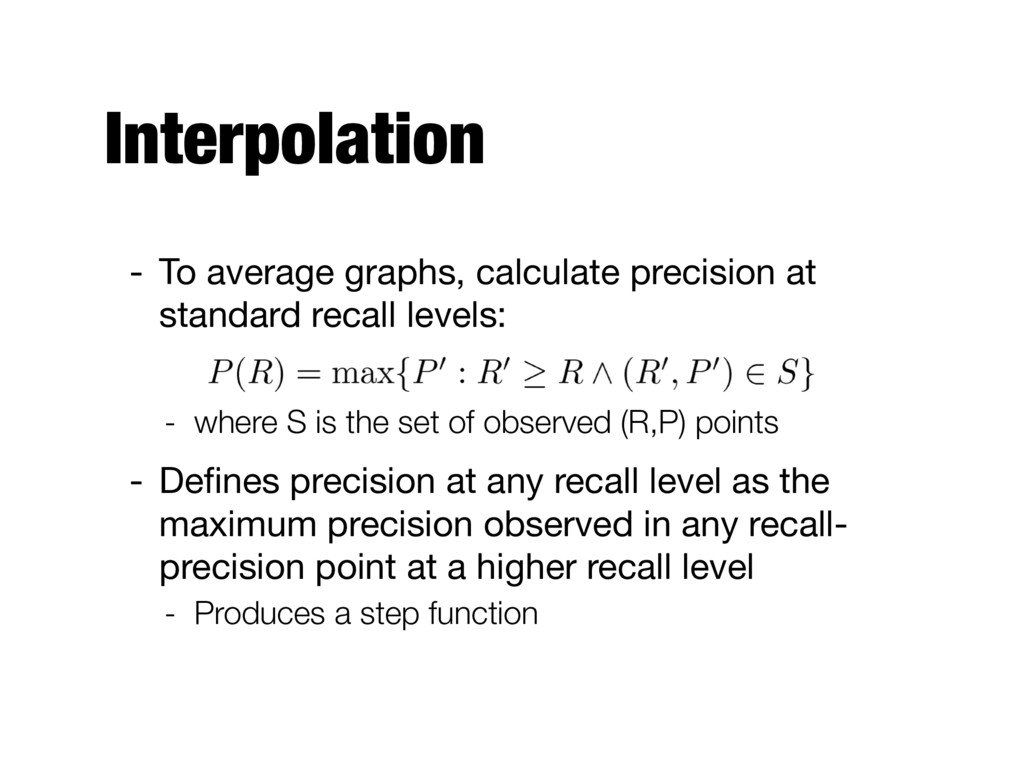
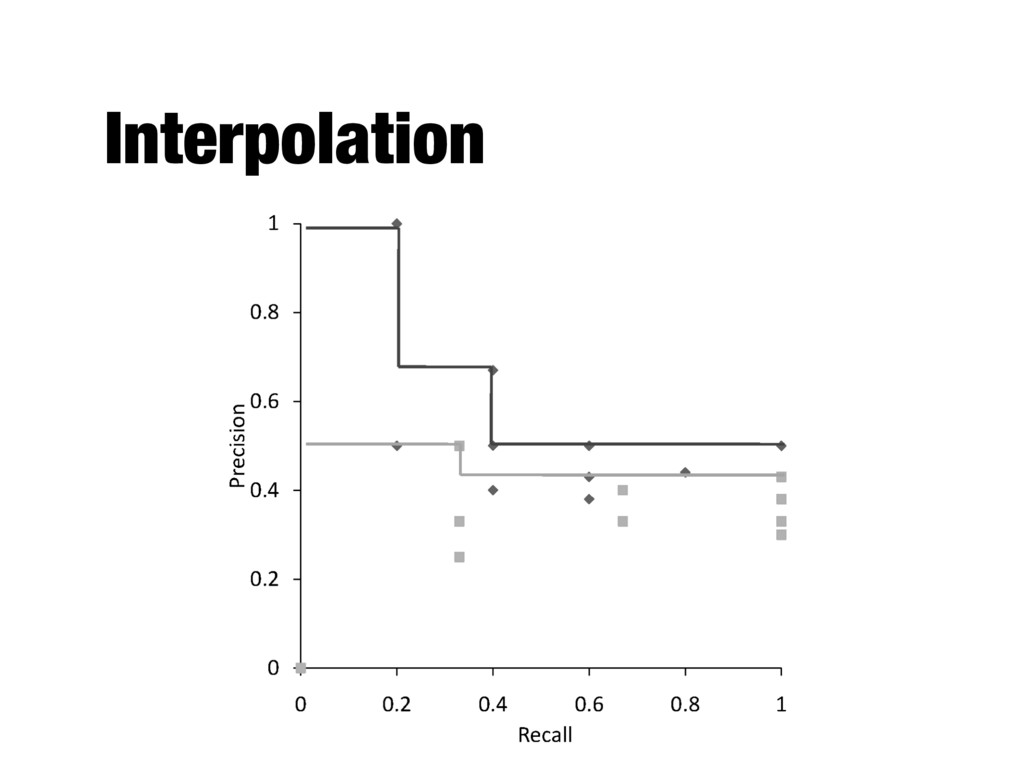
levels: - where S is the set of observed (R,P) points - Defines precision at any recall level as the maximum precision observed in any recall- precision point at a higher recall level - Produces a step function
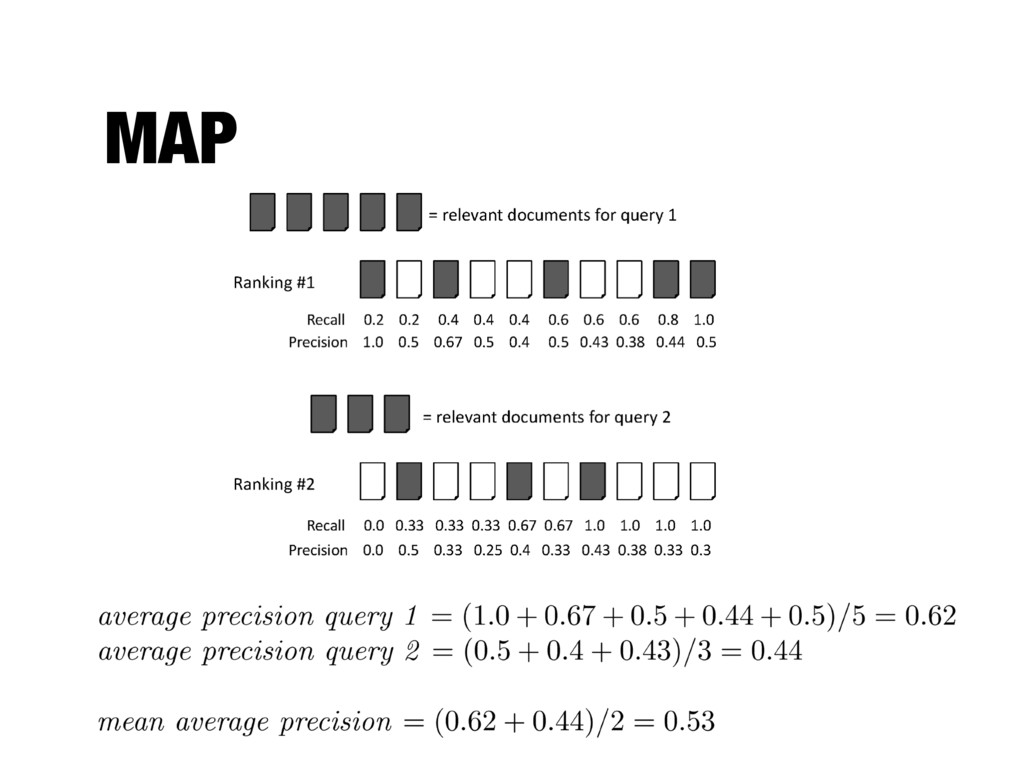
positions where a relevant document was retrieved - If a relevant document is not retrieved (in the top K ranks, e.g, K=1000) then its contribution is 0.0 - Single number that is based on the ranking of all the relevant documents - The value depends heavily on the highly ranked relevant documents
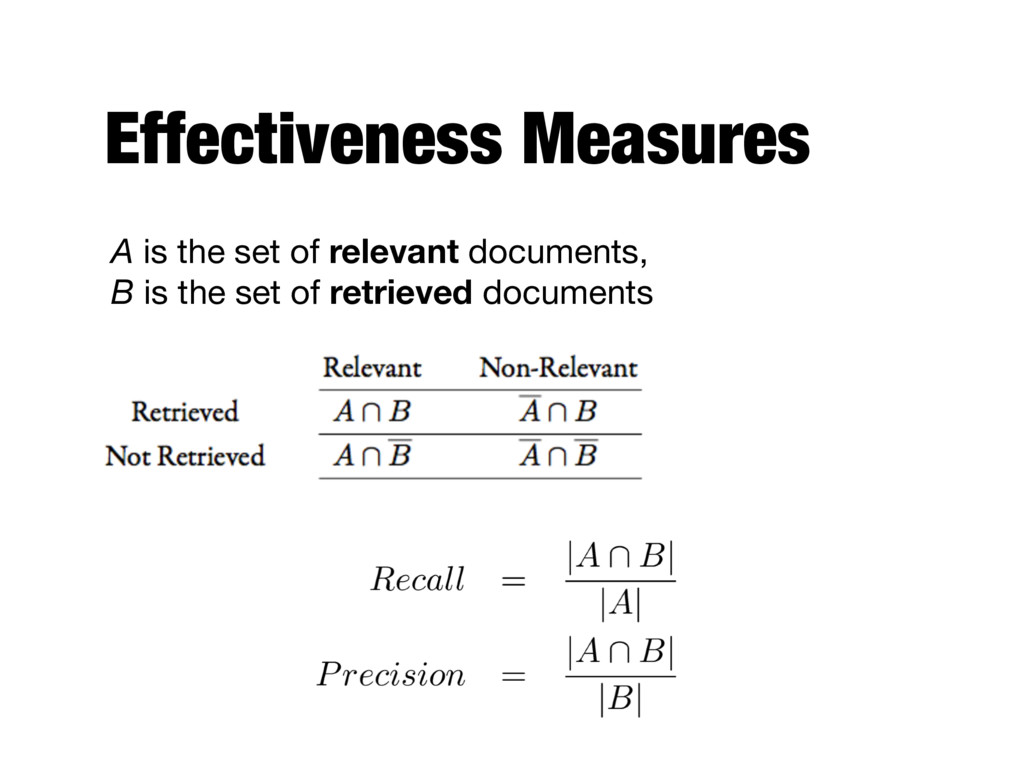
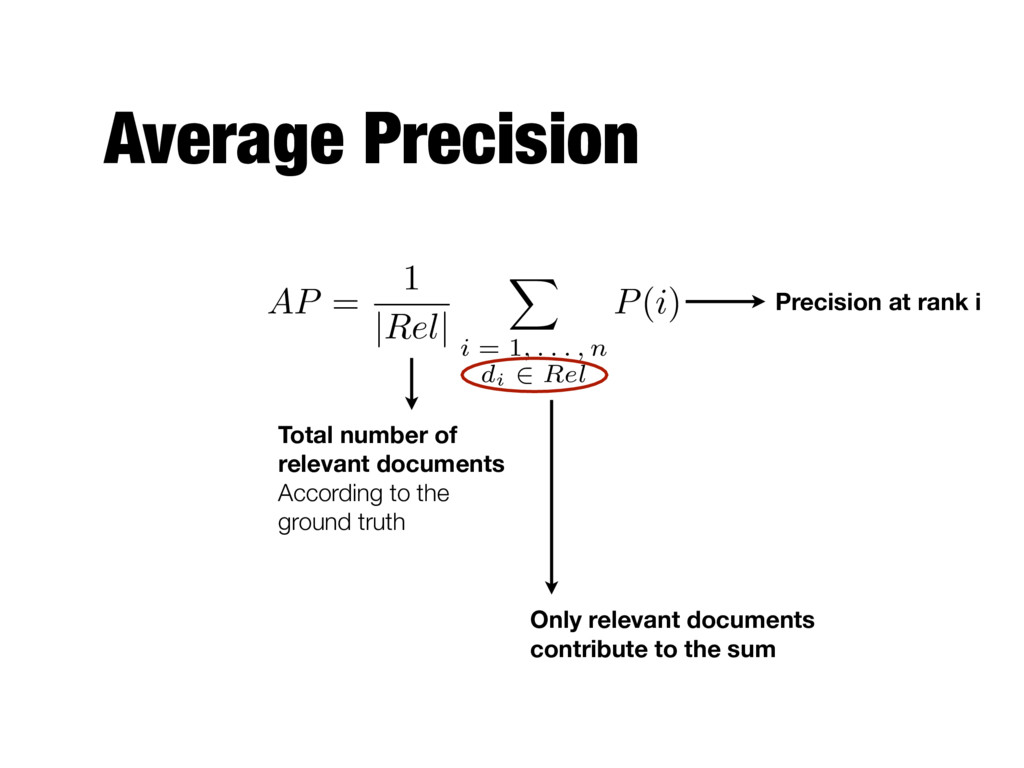
. . . , n di 2 Rel P(i) Total number of relevant documents According to the ground truth Precision at rank i Only relevant documents contribute to the sum
by averaging average precision - Very succinct summary - Most commonly used measure in research papers - Assumes user is interested in finding many relevant documents for each query - Requires many relevance judgments
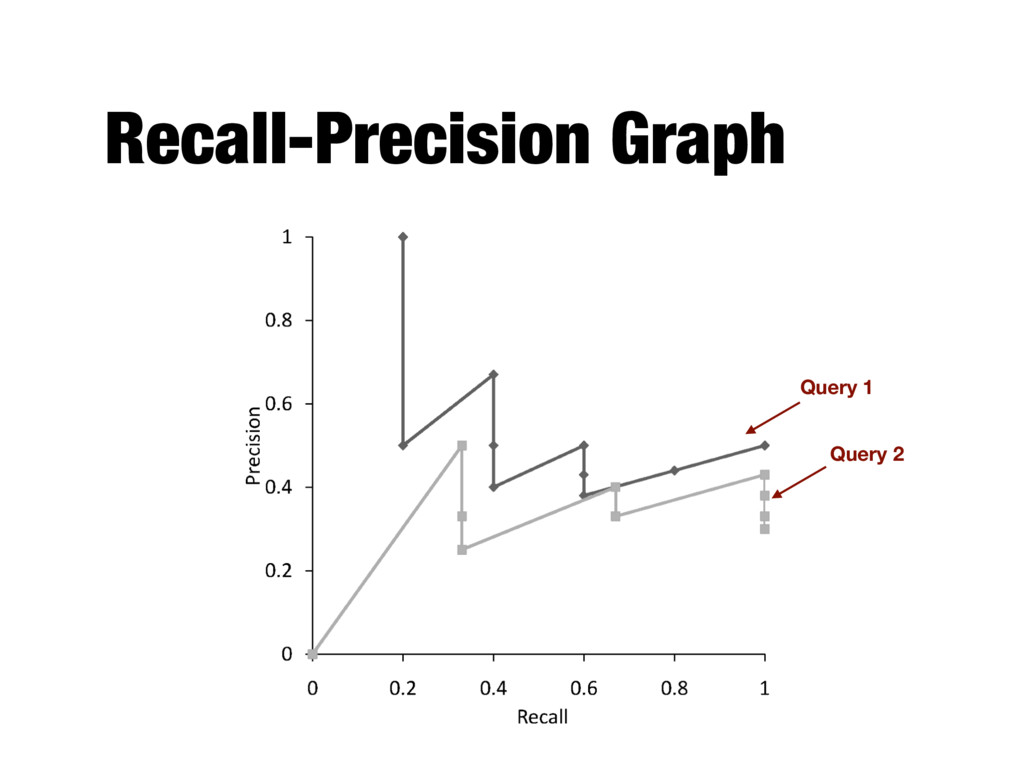
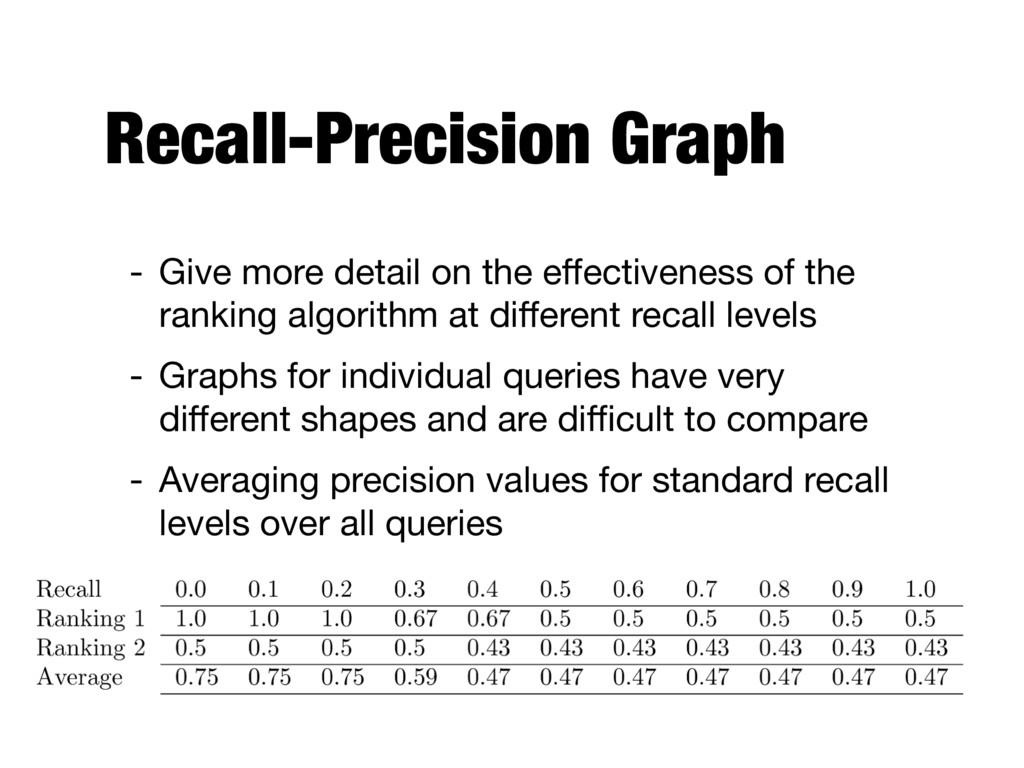
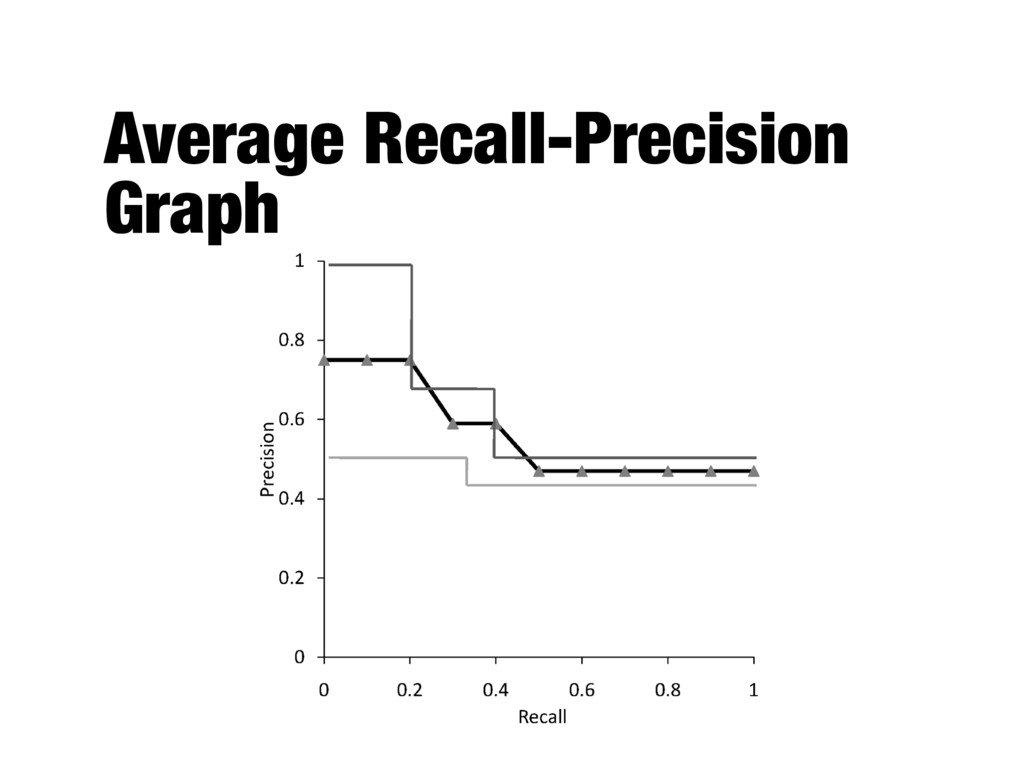
the ranking algorithm at different recall levels - Graphs for individual queries have very different shapes and are difficult to compare - Averaging precision values for standard recall levels over all queries
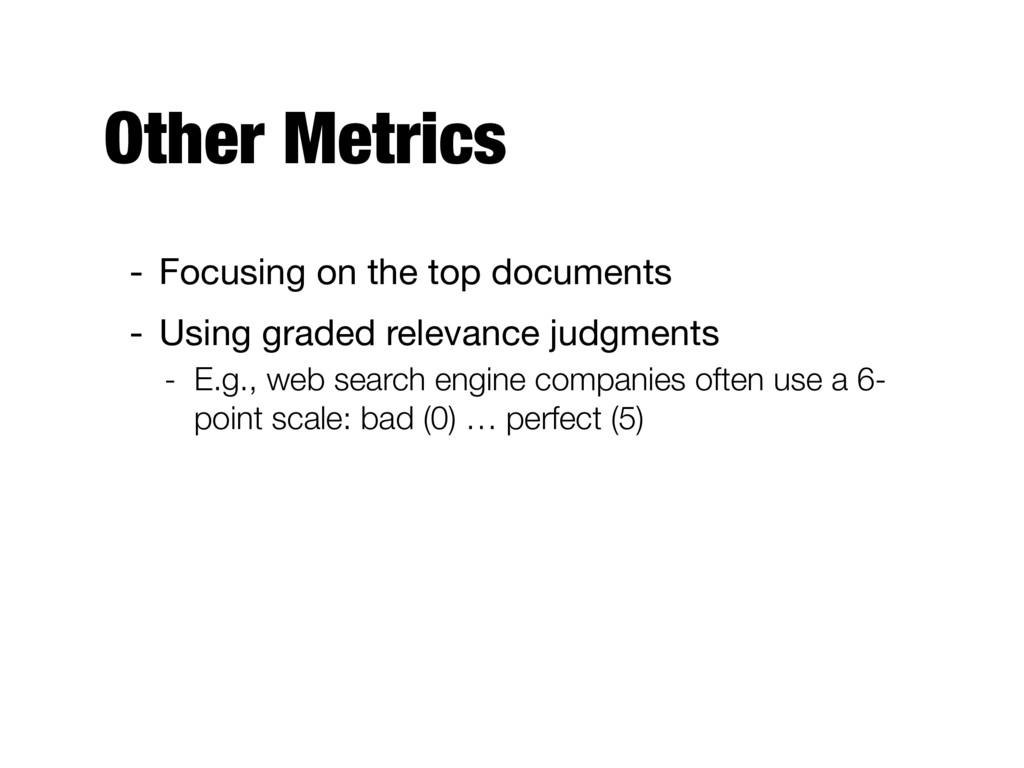
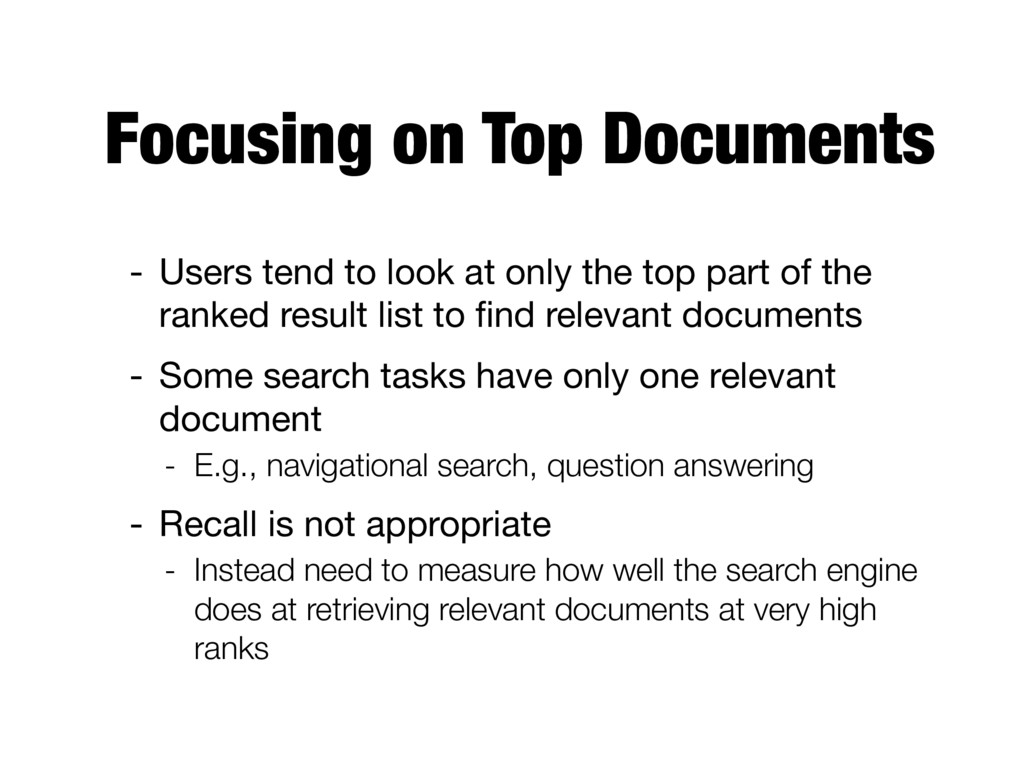
only the top part of the ranked result list to find relevant documents - Some search tasks have only one relevant document - E.g., navigational search, question answering - Recall is not appropriate - Instead need to measure how well the search engine does at retrieving relevant documents at very high ranks
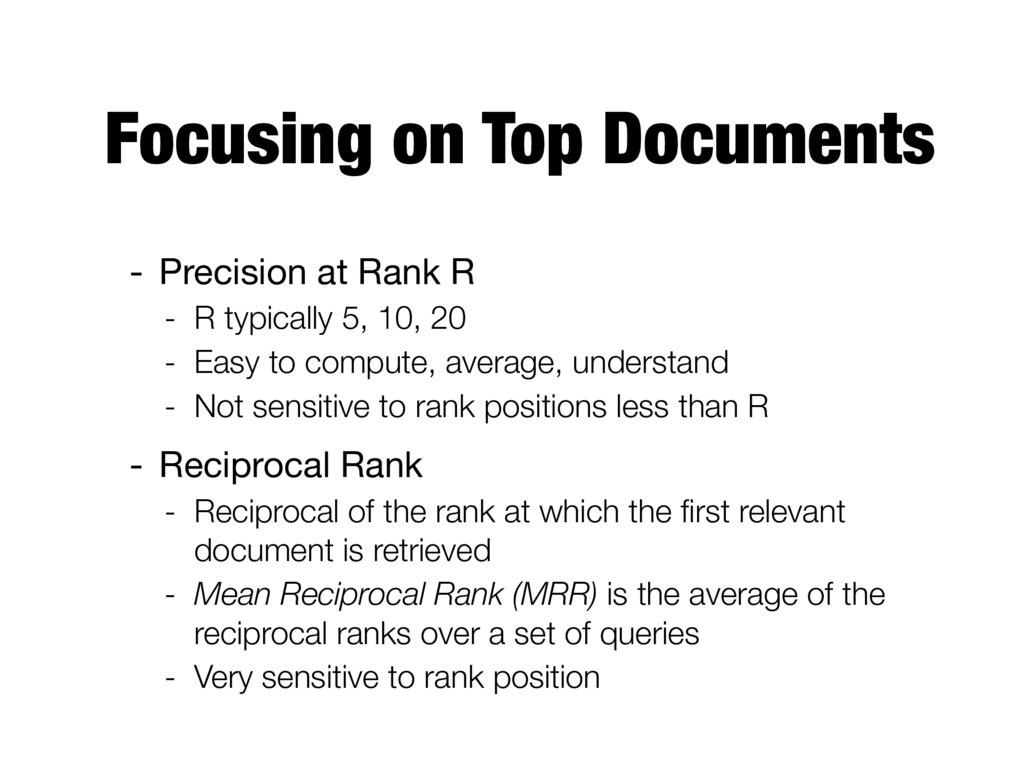
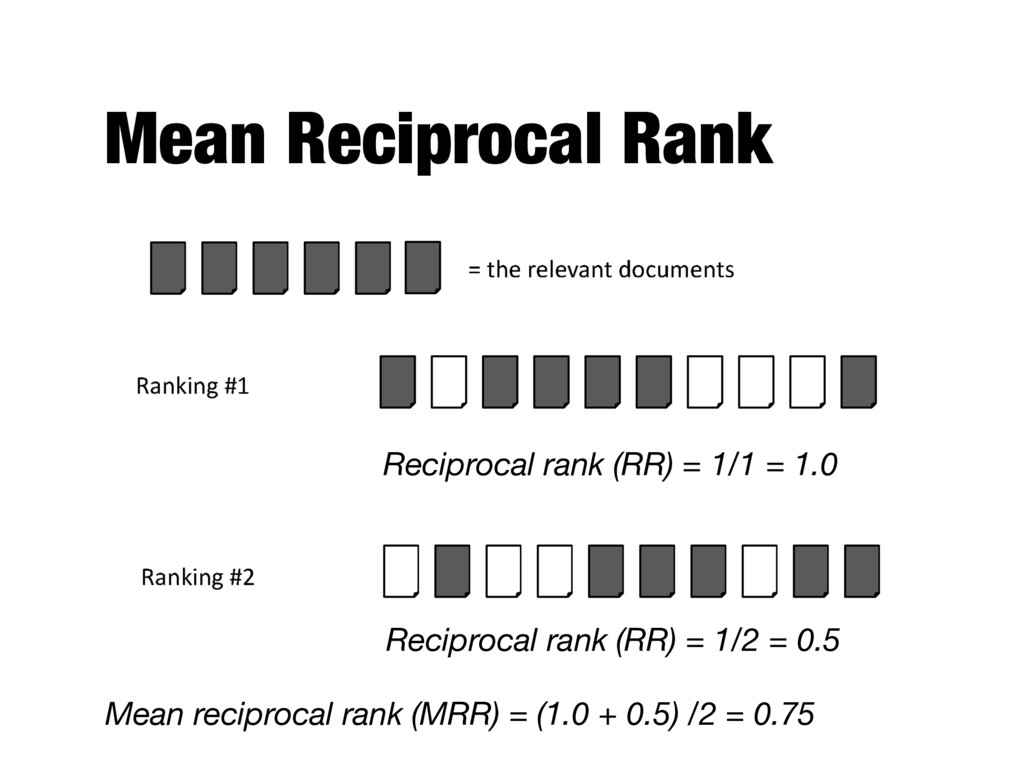
R typically 5, 10, 20 - Easy to compute, average, understand - Not sensitive to rank positions less than R - Reciprocal Rank - Reciprocal of the rank at which the first relevant document is retrieved - Mean Reciprocal Rank (MRR) is the average of the reciprocal ranks over a set of queries - Very sensitive to rank position
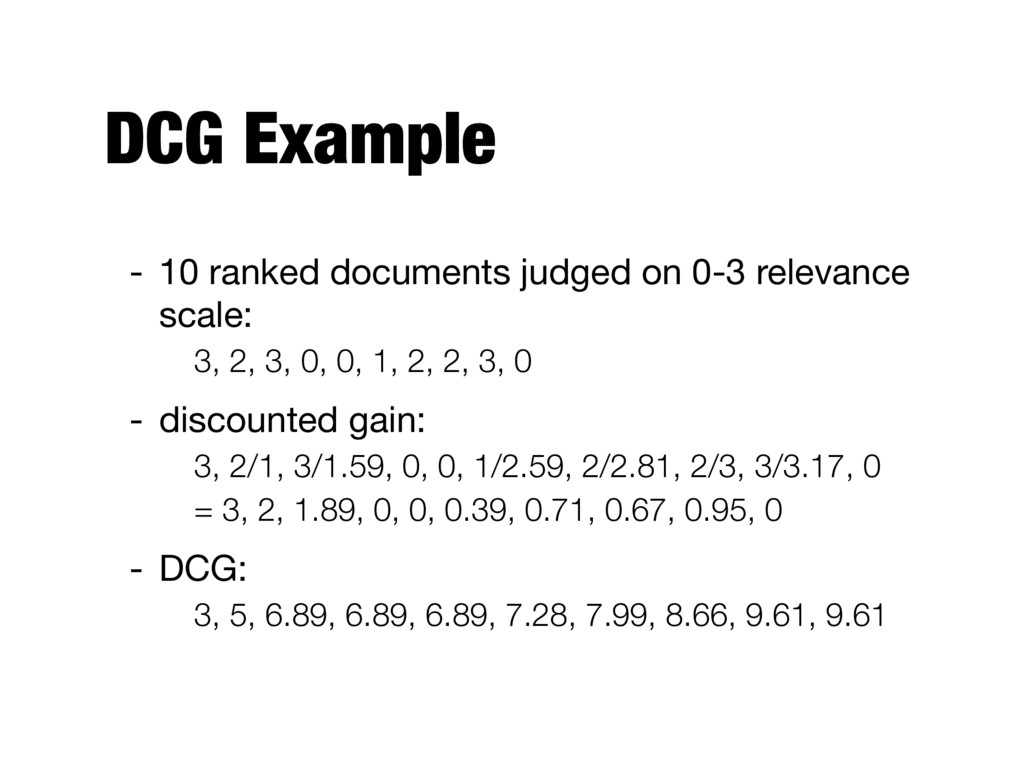
and related tasks - Two assumptions: - Highly relevant documents are more useful than marginally relevant document - The lower the ranked position of a relevant document, the less useful it is for the user, since it is less likely to be examined
of the usefulness, or gain, from examining a document - Gain is accumulated starting at the top of the ranking and may be reduced, or discounted, at lower ranks - Typical discount is 1/log (rank) - With base 2, the discount at rank 4 is 1/2, and at rank 8 it is 1/3
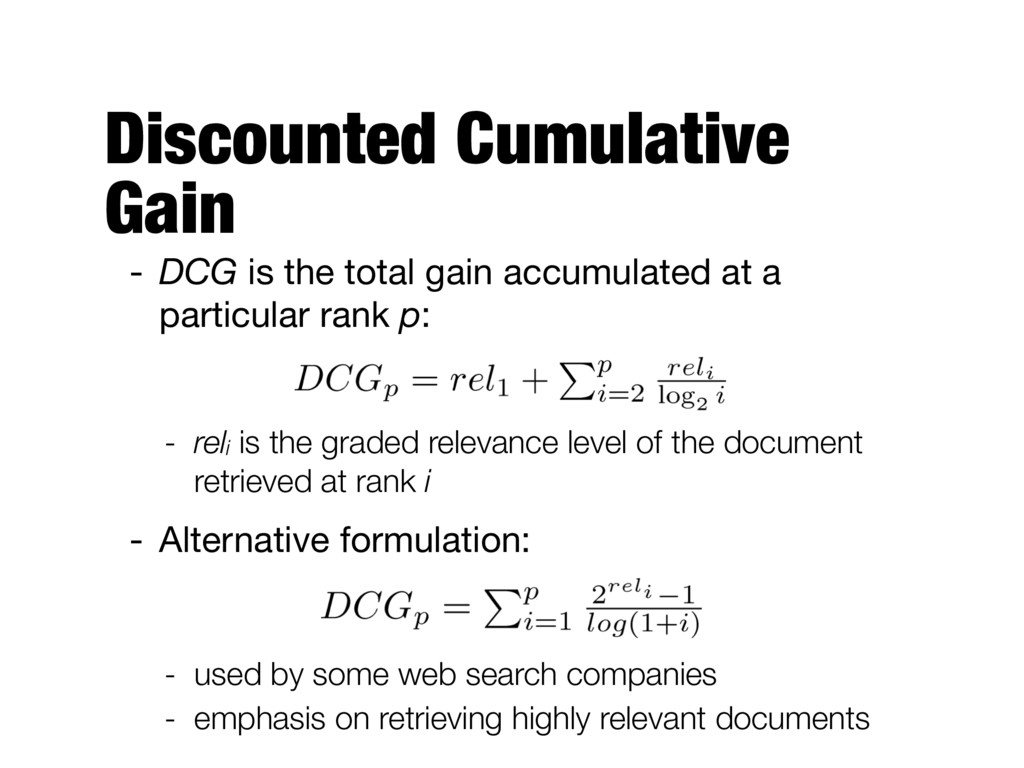
at a particular rank p: - reli is the graded relevance level of the document retrieved at rank i - Alternative formulation: - used by some web search companies - emphasis on retrieving highly relevant documents
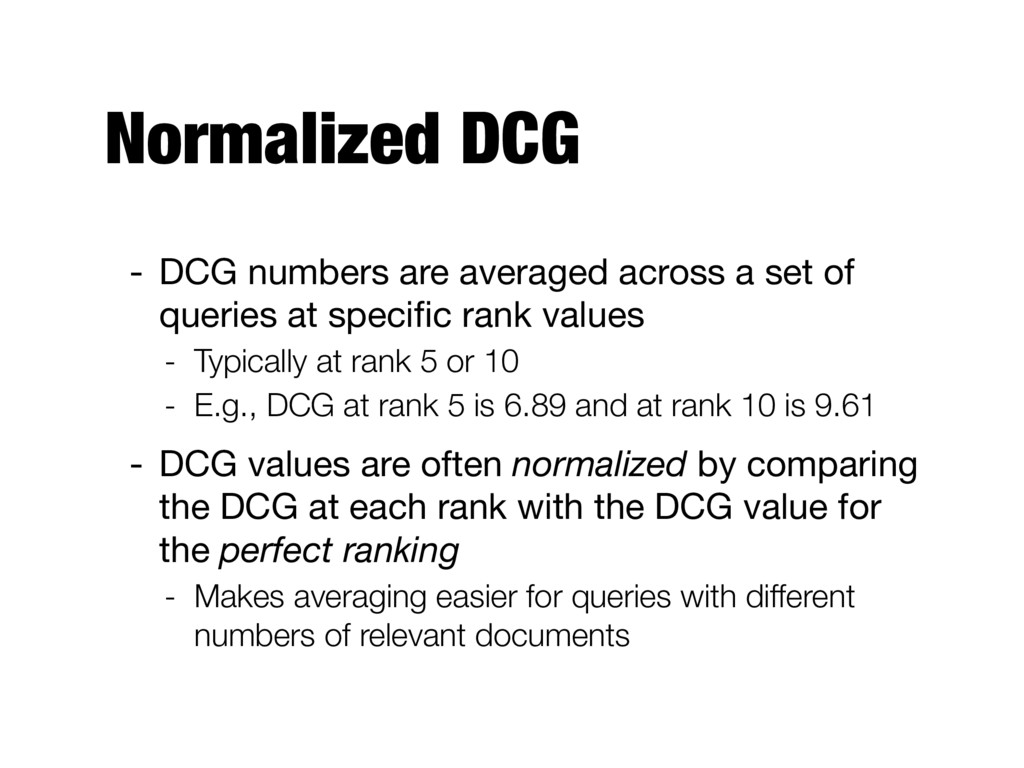
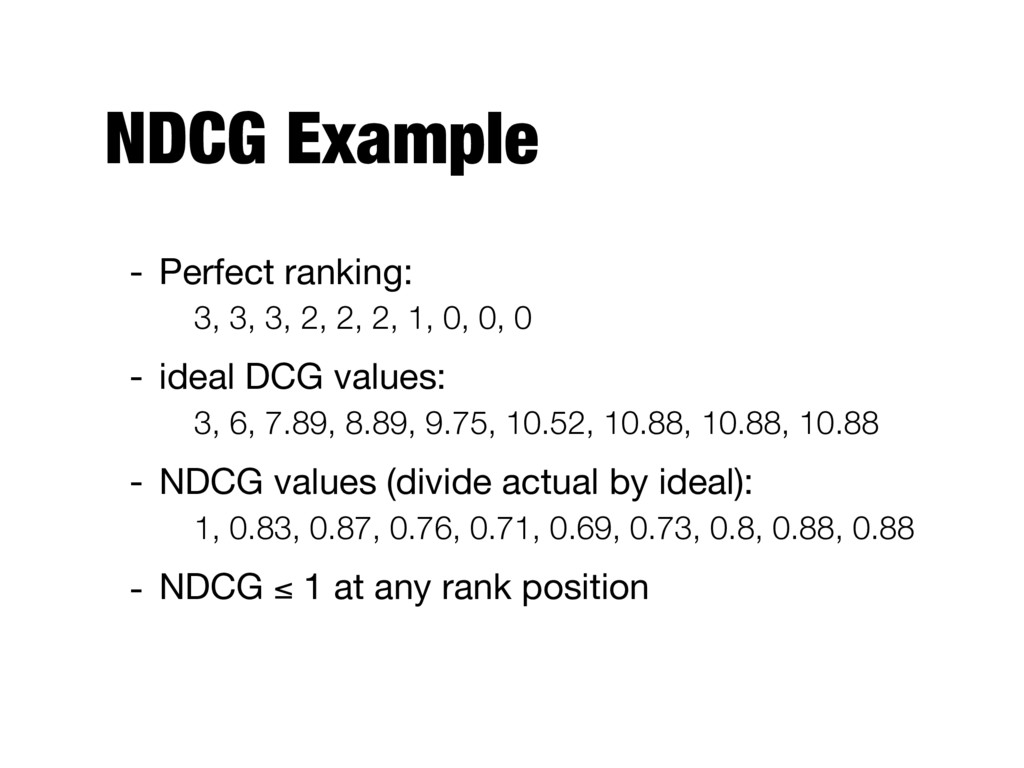
of queries at specific rank values - Typically at rank 5 or 10 - E.g., DCG at rank 5 is 6.89 and at rank 10 is 9.61 - DCG values are often normalized by comparing the DCG at each rank with the DCG value for the perfect ranking - Makes averaging easier for queries with different numbers of relevant documents
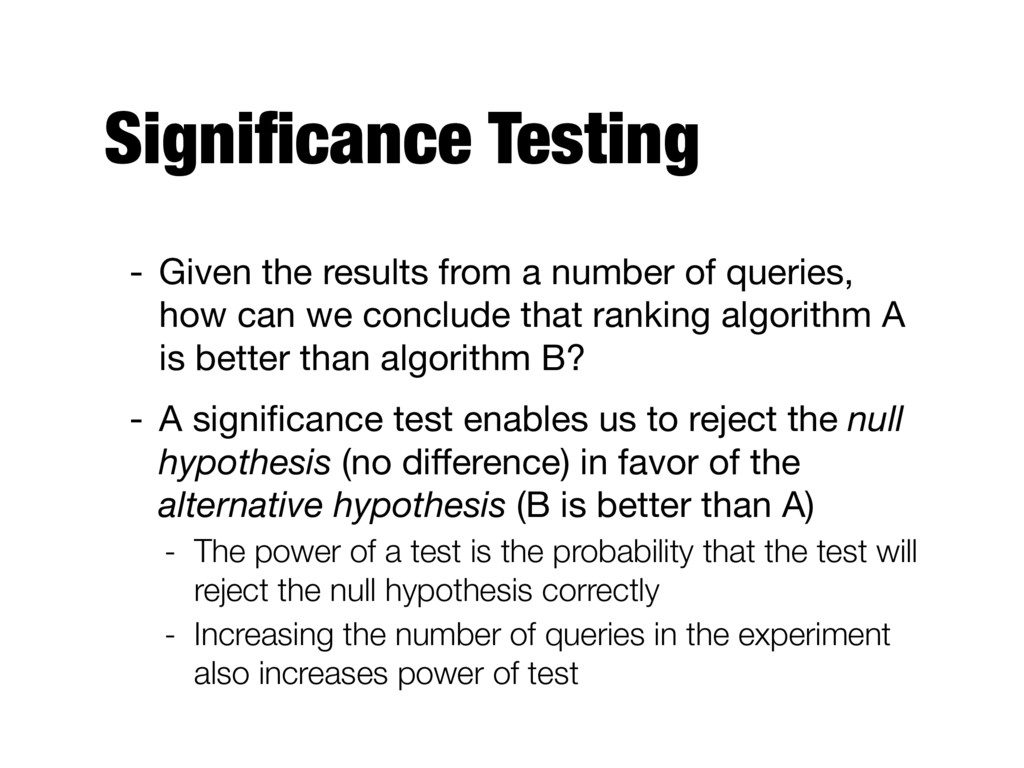
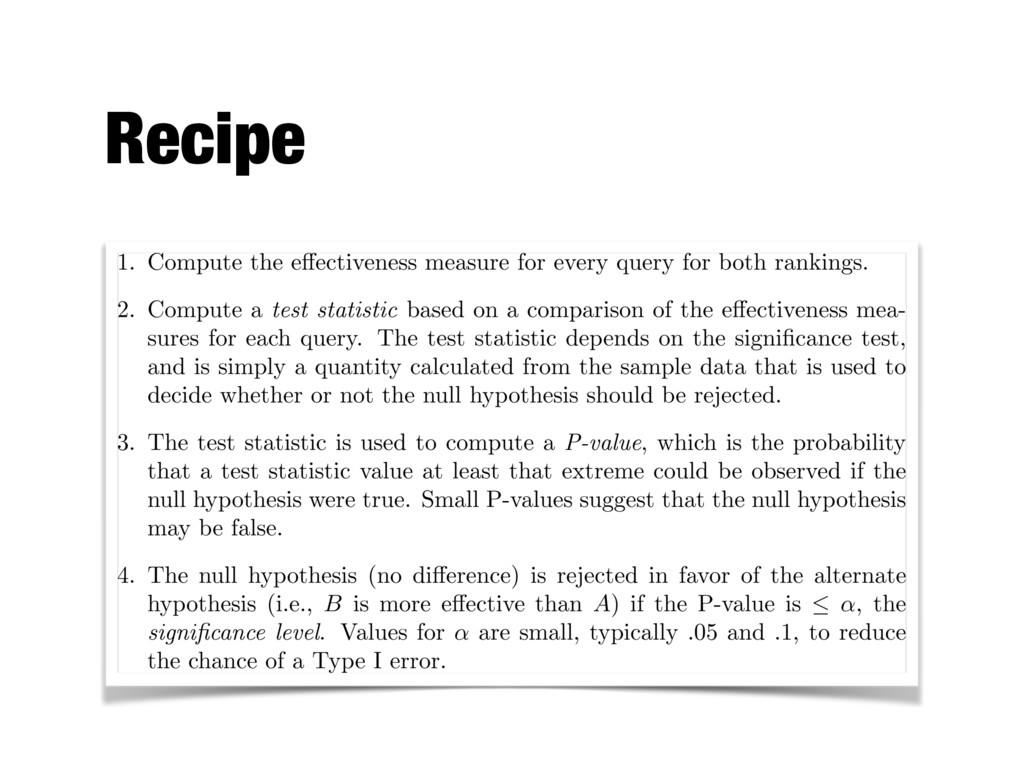
queries, how can we conclude that ranking algorithm A is better than algorithm B? - A significance test enables us to reject the null hypothesis (no difference) in favor of the alternative hypothesis (B is better than A) - The power of a test is the probability that the test will reject the null hypothesis correctly - Increasing the number of queries in the experiment also increases power of test
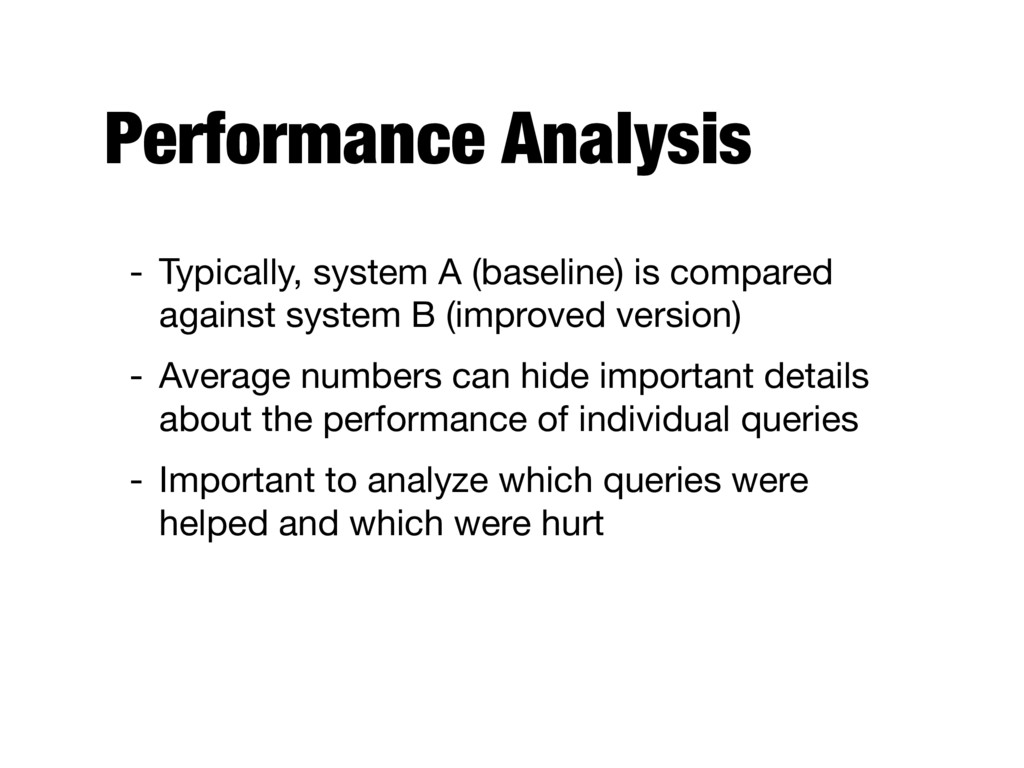
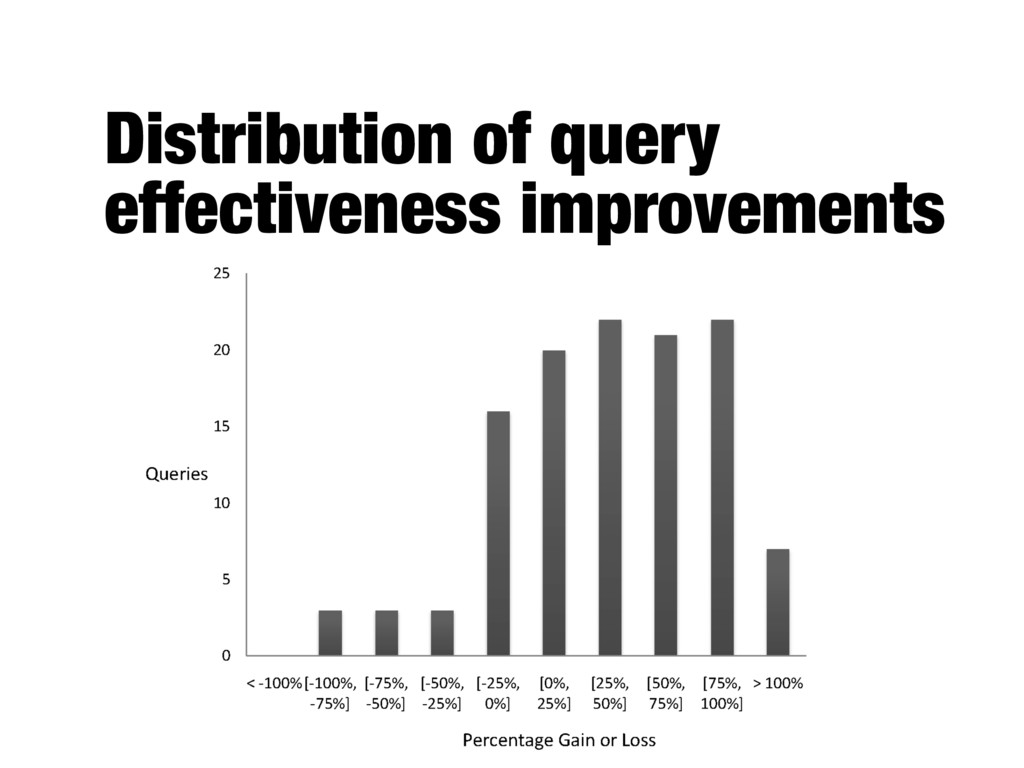
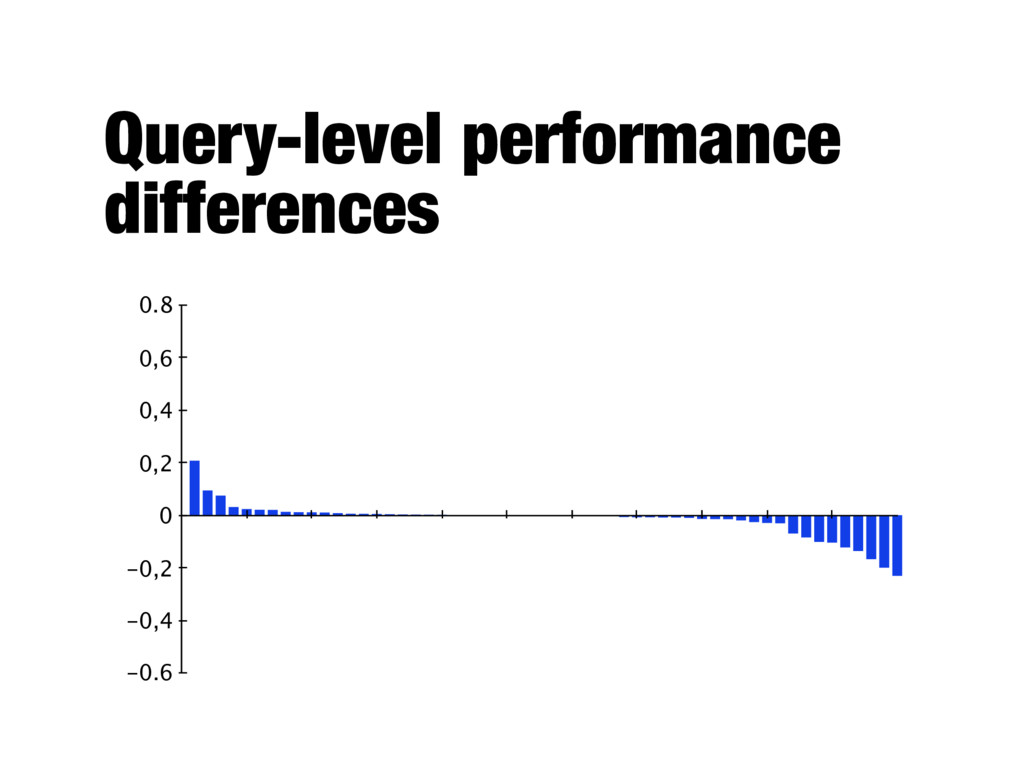
system B (improved version) - Average numbers can hide important details about the performance of individual queries - Important to analyze which queries were helped and which were hurt
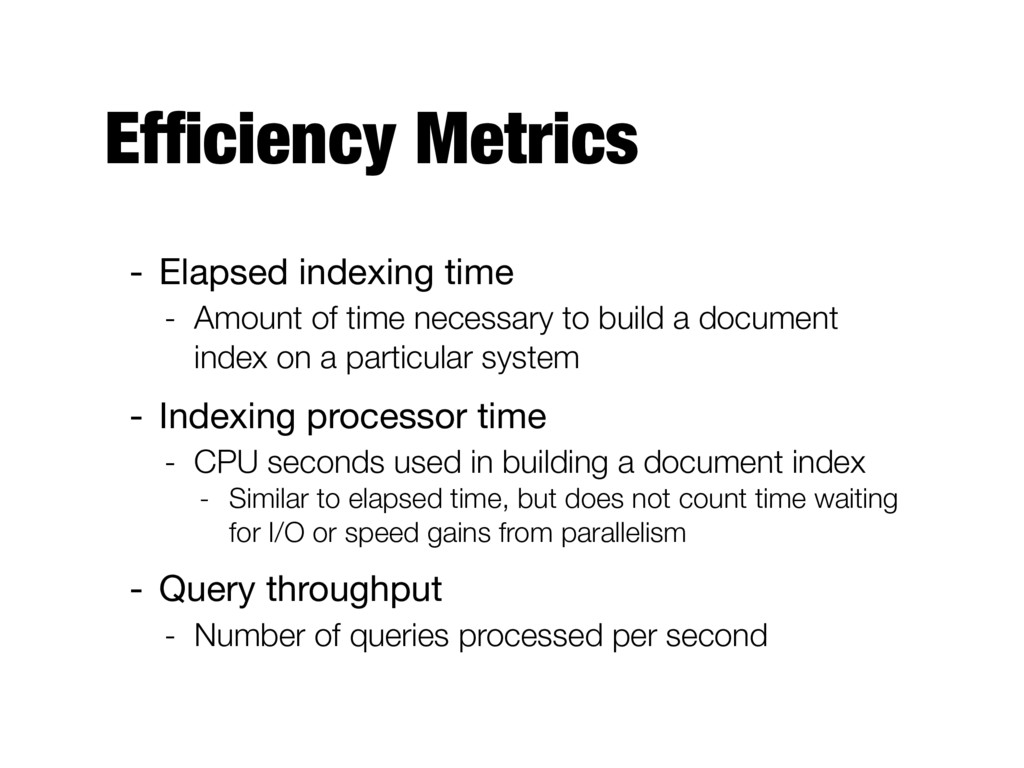
necessary to build a document index on a particular system - Indexing processor time - CPU seconds used in building a document index - Similar to elapsed time, but does not count time waiting for I/O or speed gains from parallelism - Query throughput - Number of queries processed per second
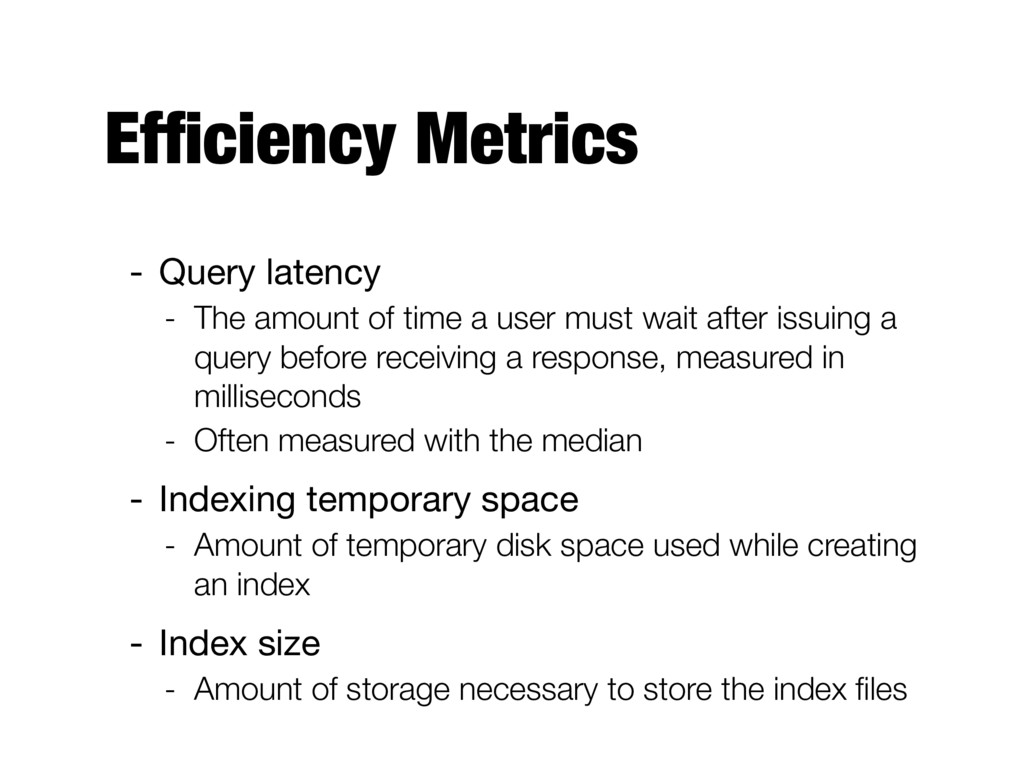
a user must wait after issuing a query before receiving a response, measured in milliseconds - Often measured with the median - Indexing temporary space - Amount of temporary disk space used while creating an index - Index size - Amount of storage necessary to store the index files
any application - Choose measures appropriate for task - Use a combination - Shows different aspects of the system effectiveness - Use significance tests - Analyze performance of individual queries