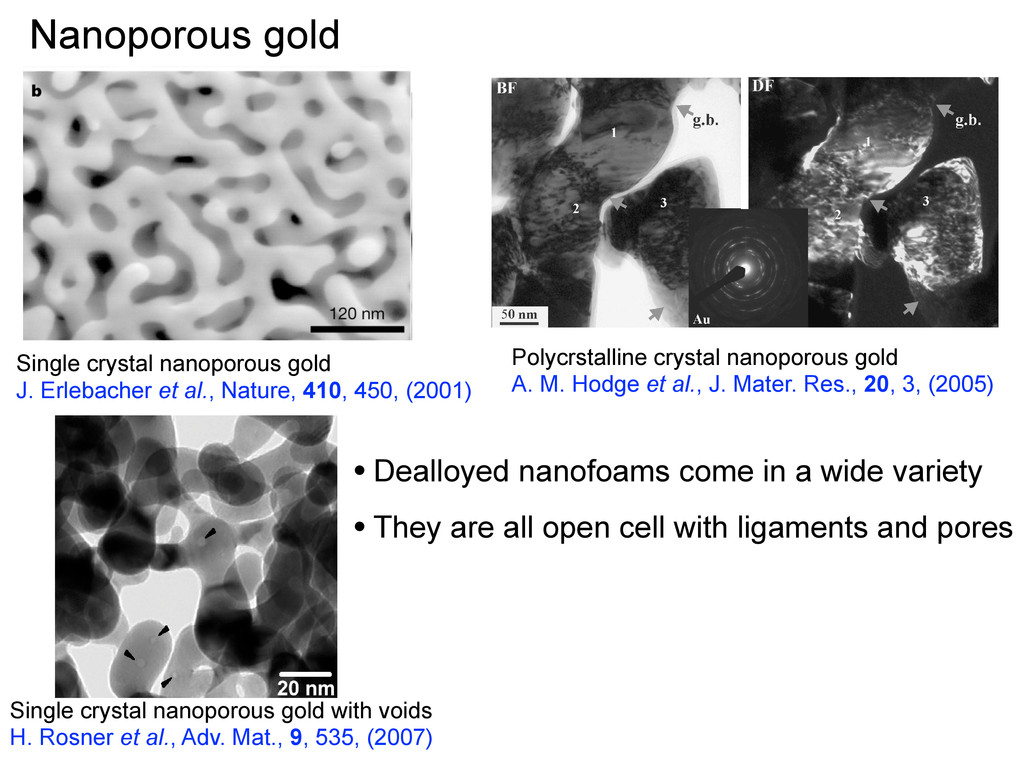
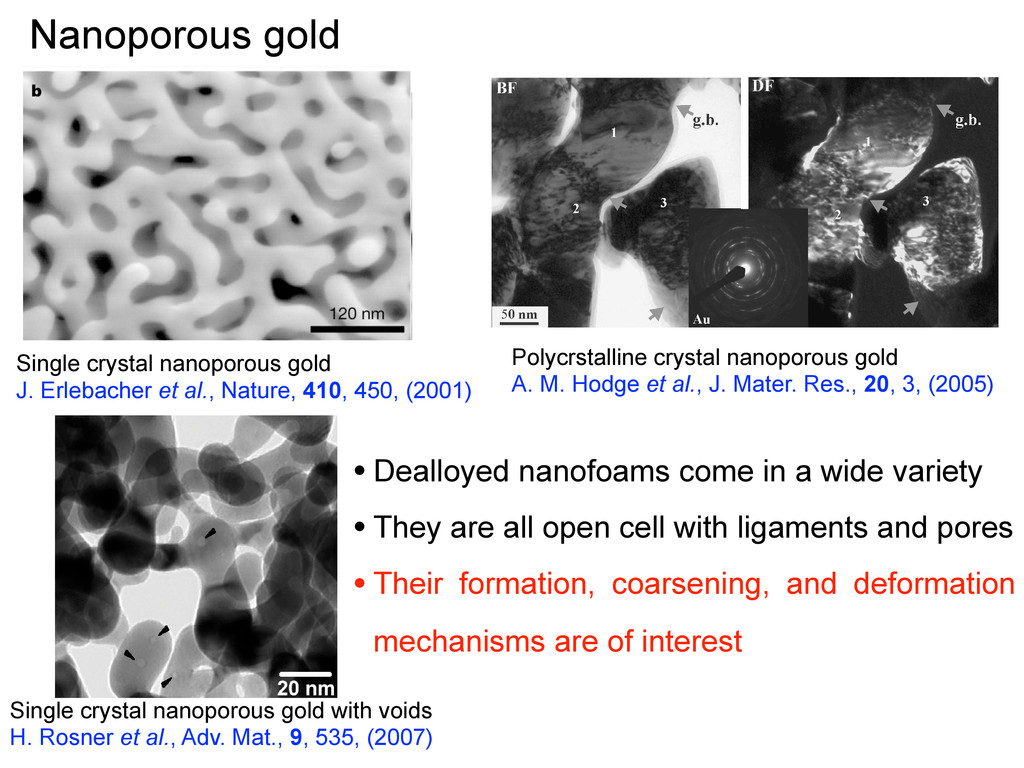
et al., Adv. Mat., 9, 535, (2007) using the program MAVI. MAVI affords a rization of 3-D structures by analysis of their repre- ns as binary and spatially discrete images, using the ms described in reference [22]. Electron Microscopy entional TEM micrographs, such as the bright-field aphs of Figure 1, are 2-D projections which reveal ion about the average density along the beam direc- re, the micrographs illustrate the typical microstruc- nanoporous gold, which is composed of nanometer ments and pores. Energy dispersive analysis of X-ray ence of the sample volume shown in Figure 1(a) indi- t the average composition is Au96 Ag4 . Details of indi- old ligaments are shown in Figure 1(b). ected area electron diffraction (SAED) pattern (the corresponds to a circular area of about 800 nm in ) from the same volume as shown in Figure 1(a) (see veals a preferred <100> out-of-plane orientation, con- (b) connected network structure composed of single-crystalline gold ligaments nsity of gold ligaments due to the overlap in the 2-D projection. The corre- t indicates a preferred <100> out-of-plane orientation with considerable Single crystal nanoporous gold J. Erlebacher et al., Nature, 410, 450, (2001) FIG. 1. SEM micrograph obtained from (a) synthesized Au porous samples and (b) dark-field and bright-field TEM micro showing four distinct grains <50 nm. The corresponding selected area diffraction pattern is shown in the inset. J. Mater. Res., Vol. 20, No. 3, Mar 2005 Polycrstalline crystal nanoporous gold A. M. Hodge et al., J. Mater. Res., 20, 3, (2005) • Dealloyed nanofoams come in a wide variety • They are all open cell with ligaments and pores • Their formation, coarsening, and deformation mechanisms are of interest