Kedarnath Kolluri, and M. J. Demkowicz Financial Support: Center for Materials at Irradiation and Mechanical Extremes (CMIME) at LANL, an Energy Frontier Research Center (EFRC) funded by U.S. Department of Energy, Office of Science, Office of Basic Energy Sciences Acknowledgments: R. G. Hoagland, J. P. Hirth, B. Uberuaga, A. Kashinath, A. Vattré, X.-Y. Liu, A. Misra, and A. Caro
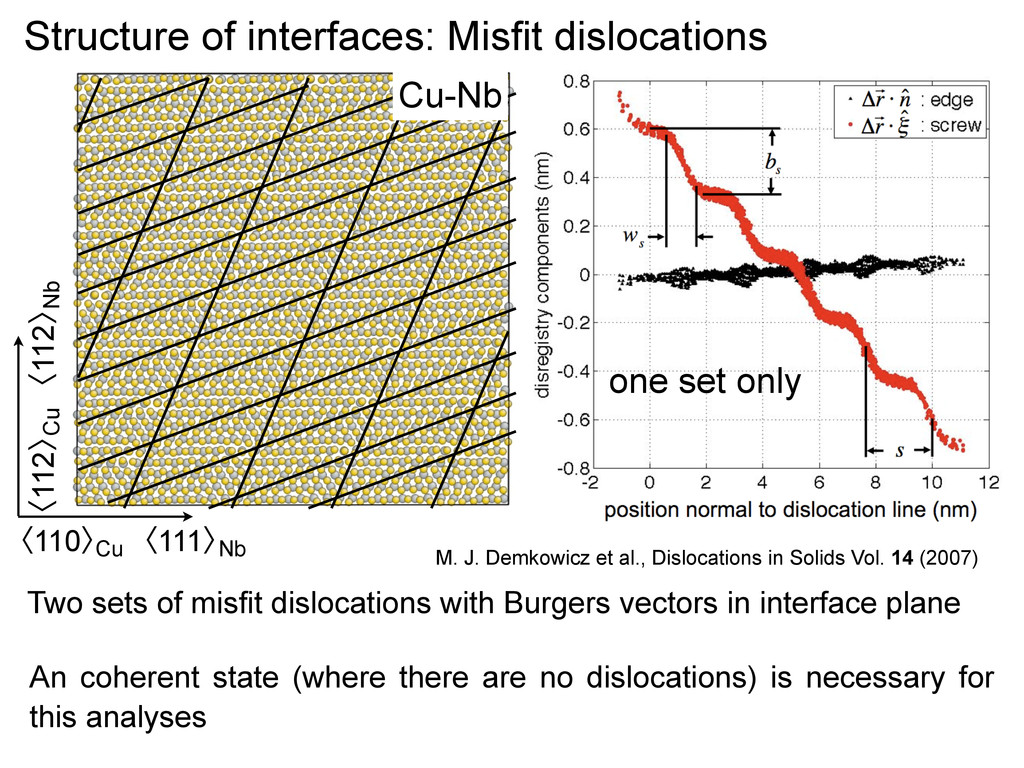
J. Demkowicz et al., Dislocations in Solids Vol. 14 (2007) one set only Two sets of misfit dislocations with Burgers vectors in interface plane Structure of interfaces: Misfit dislocations An coherent state (where there are no dislocations) is necessary for this analyses
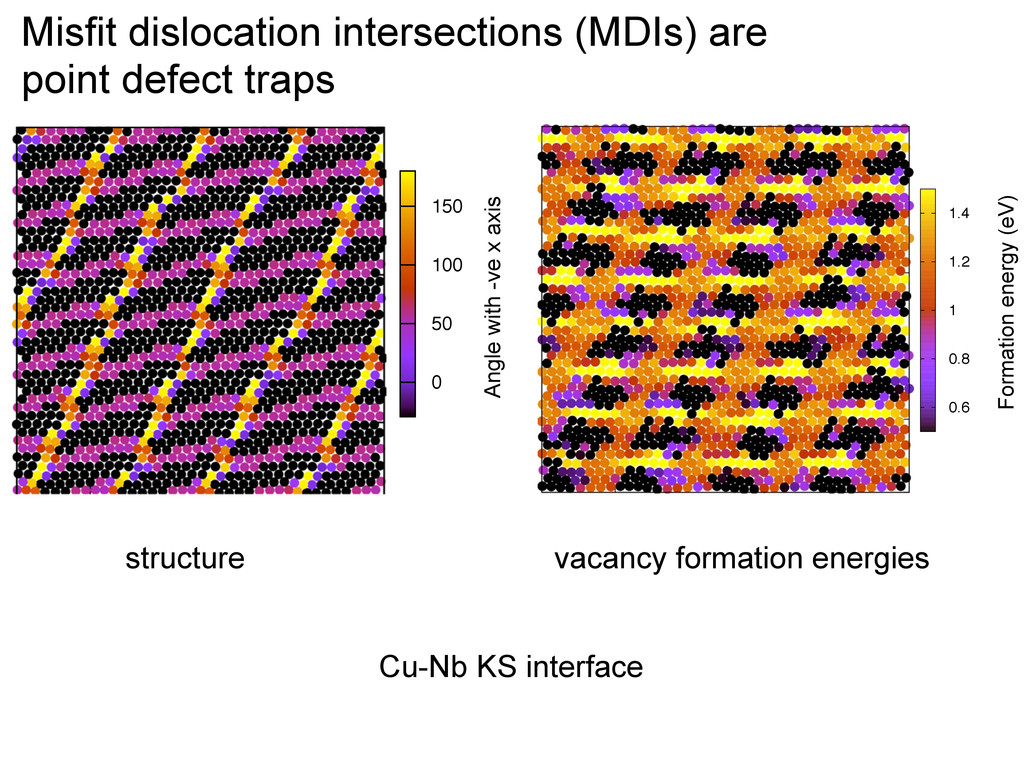
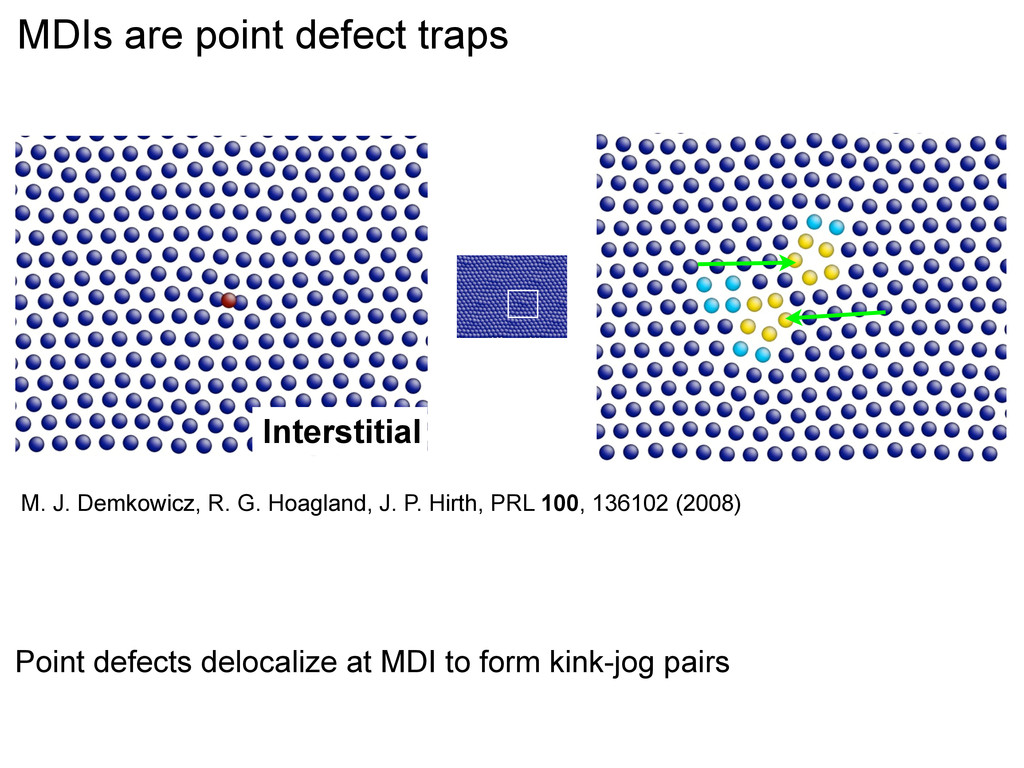
!1 a1 a2 L Misfit dislocation intersections (MDIs) are point defect traps M. J. Demkowicz, R. G. Hoagland, J. P. Hirth, PRL 100, 136102 (2008) Vacancy Point defects delocalize at MDI to form kink-jog pairs
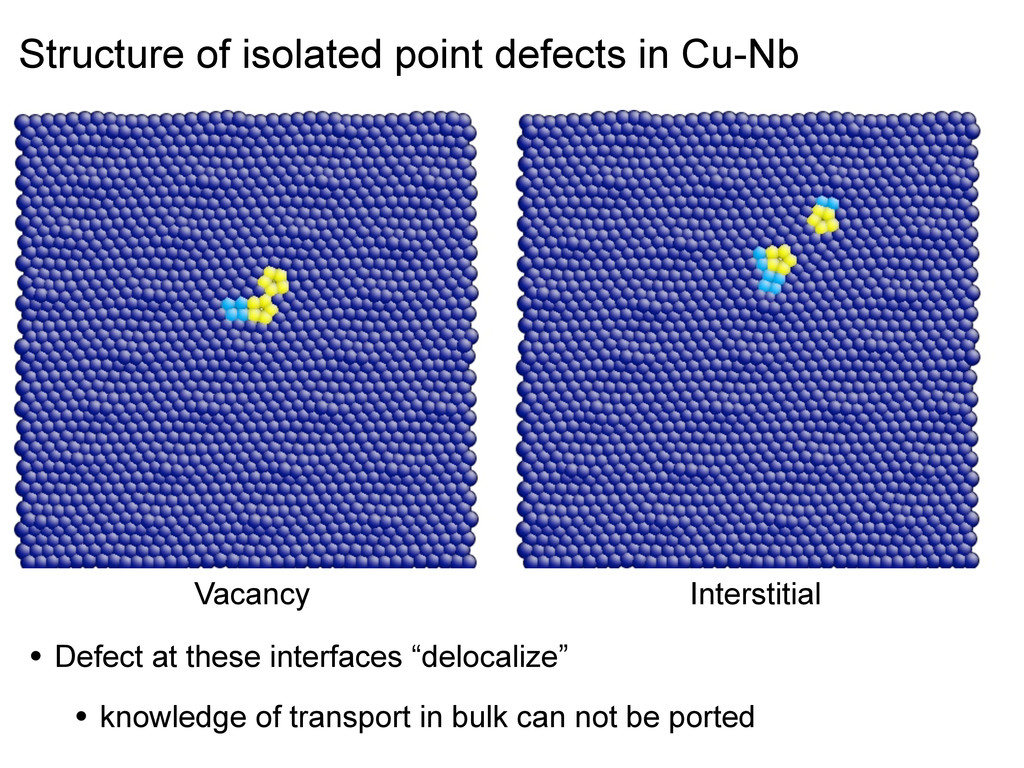
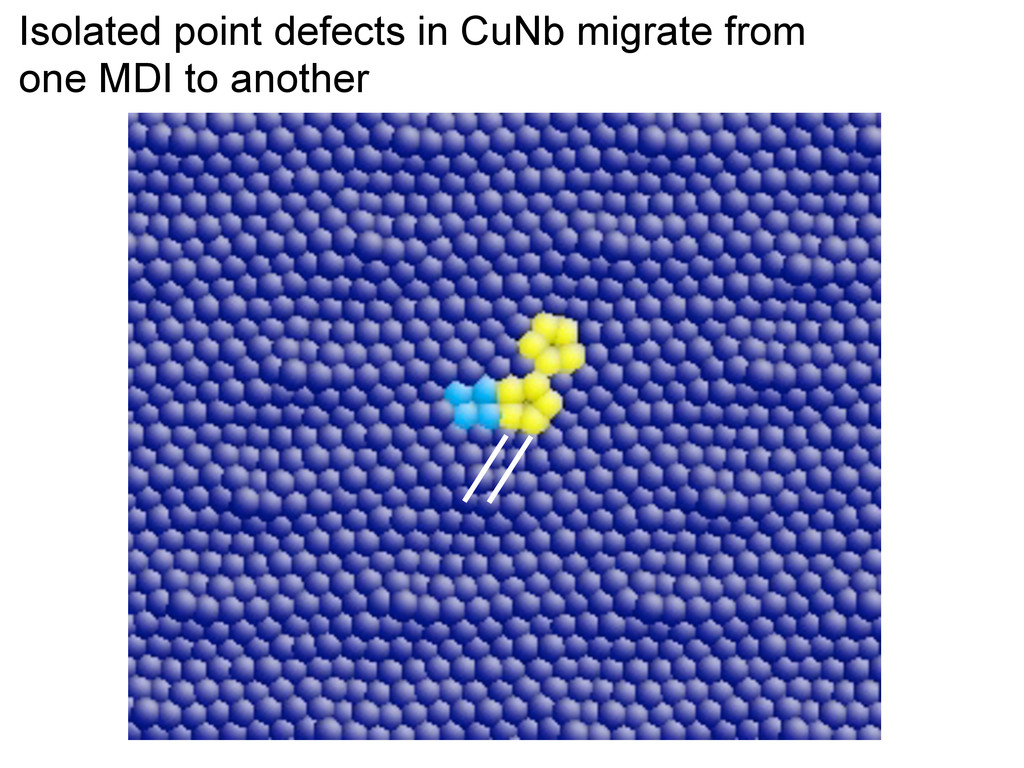
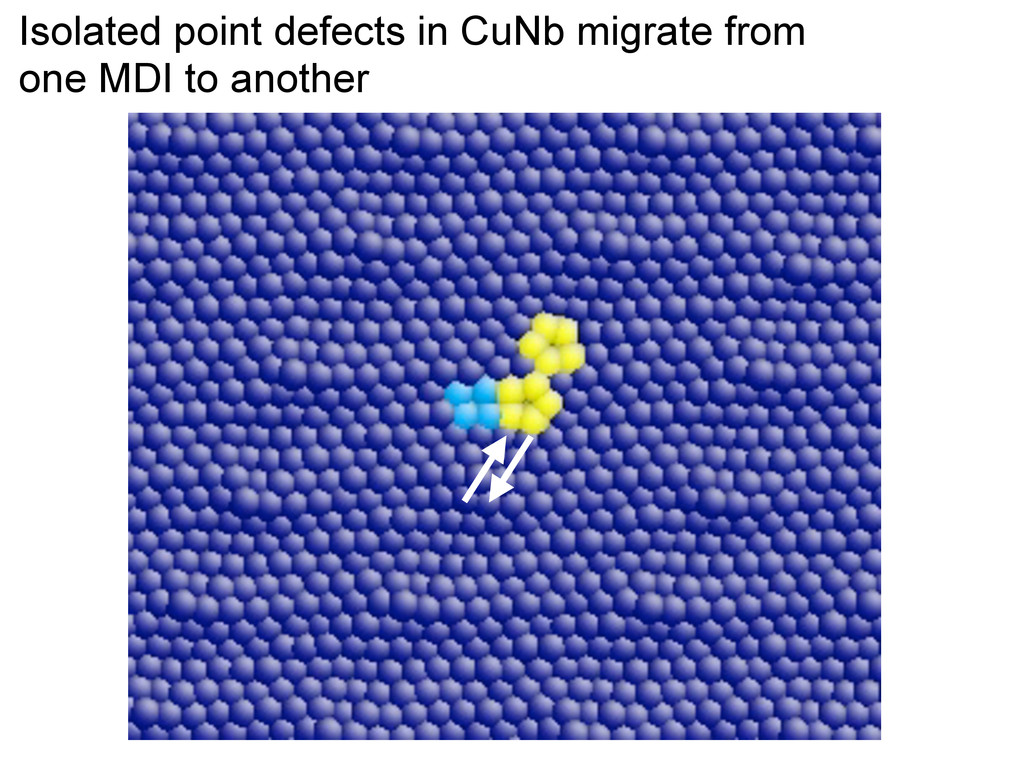
screw • In the intermediate step, the point defect is delocalized on two MDI Vacancy Interstitial Point defects migrate from one MDI to another in CuNb
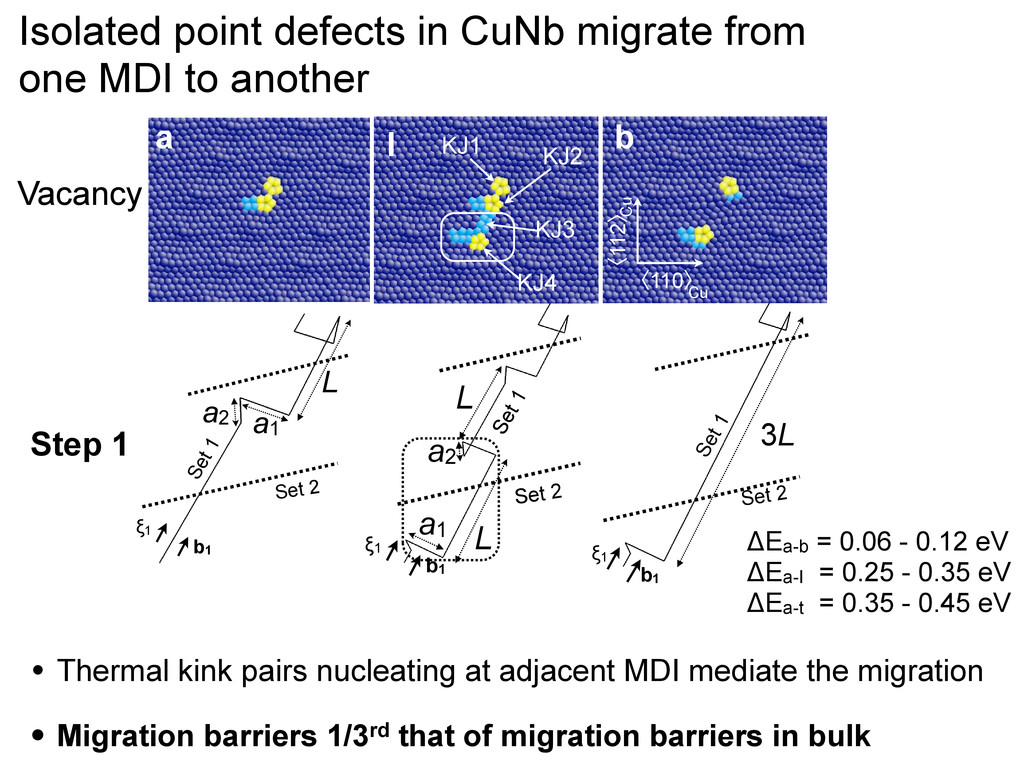
1 Set 2 a1 a2 L L b1 !1 b1 !1 Set 1 Set 2 3L • Thermal kink pairs nucleating at adjacent MDI mediate the migration • Migration barriers 1/3rd that of migration barriers in bulk KJ1 KJ3´ KJ4 Cu ʪ112ʫ ʪ110ʫ Cu KJ2´ KJ4 KJ3 KJ2 KJ1 Cu ʪ112ʫ ʪ110ʫ Cu a b I Vacancy Step 1 ! (reaction coordinate) t a I t t b " E (eV) 0 0.05 0.1 0.15 0.2 0.25 0.3 0.35 0.4 0.45 0 0.1 0.2 0.3 0.4 0.5 0.6 0.7 0.8 0. t I t b t "Ea-b = 0.06 - 0.12 eV "Ea-I = 0.25 - 0.35 eV "Ea-t = 0.35 - 0.45 eV Vacancy Interstitial Isolated point defects in CuNb migrate from one MDI to another
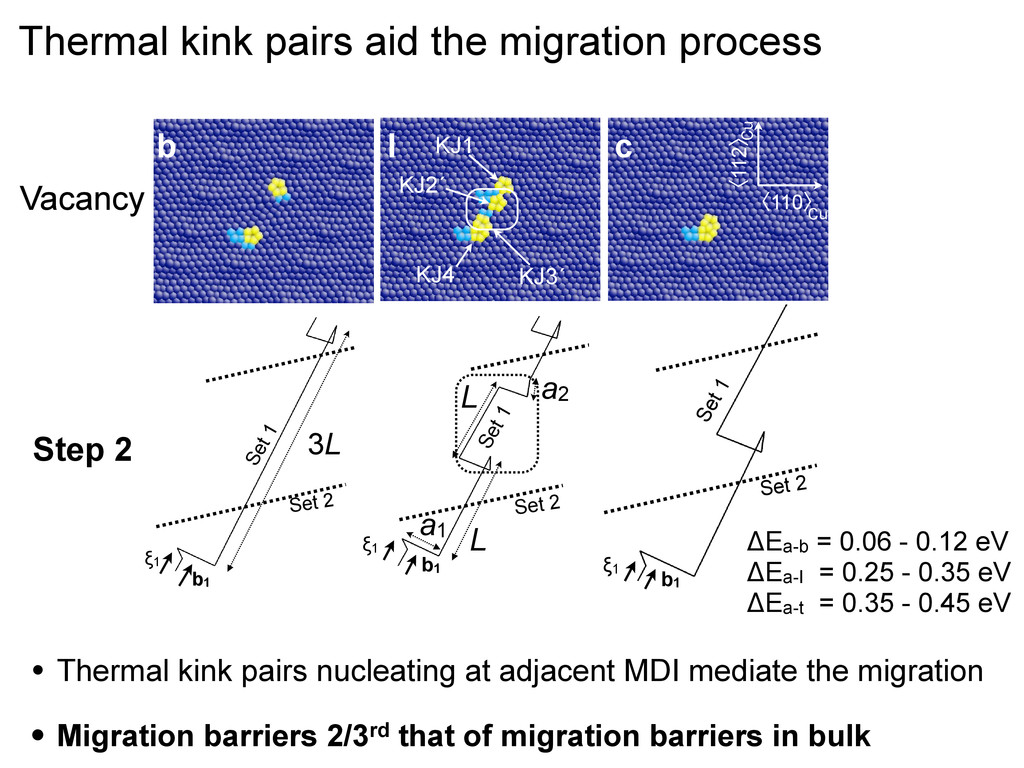
1 Set 2 a1 a2 L L b1 !1 b1 !1 Set 1 Set 2 3L KJ1 KJ3´ KJ4 Cu ʪ112ʫ ʪ110ʫ Cu KJ2´ KJ4 KJ3 KJ2 KJ1 Cu ʪ112ʫ ʪ110ʫ Cu a b I Vacancy Step 1 ! (reaction coordinate) t a I t t b " E (eV) 0 0.05 0.1 0.15 0.2 0.25 0.3 0.35 0.4 0.45 0 0.1 0.2 0.3 0.4 0.5 0.6 0.7 0.8 0. t I t b t "Ea-b = 0.06 - 0.12 eV "Ea-I = 0.25 - 0.35 eV "Ea-t = 0.35 - 0.45 eV Vacancy Interstitial Isolated point defects in CuNb migrate from one MDI to another • Thermal kink pairs nucleating at adjacent MDI mediate the migration • Migration barriers 1/3rd that of migration barriers in bulk
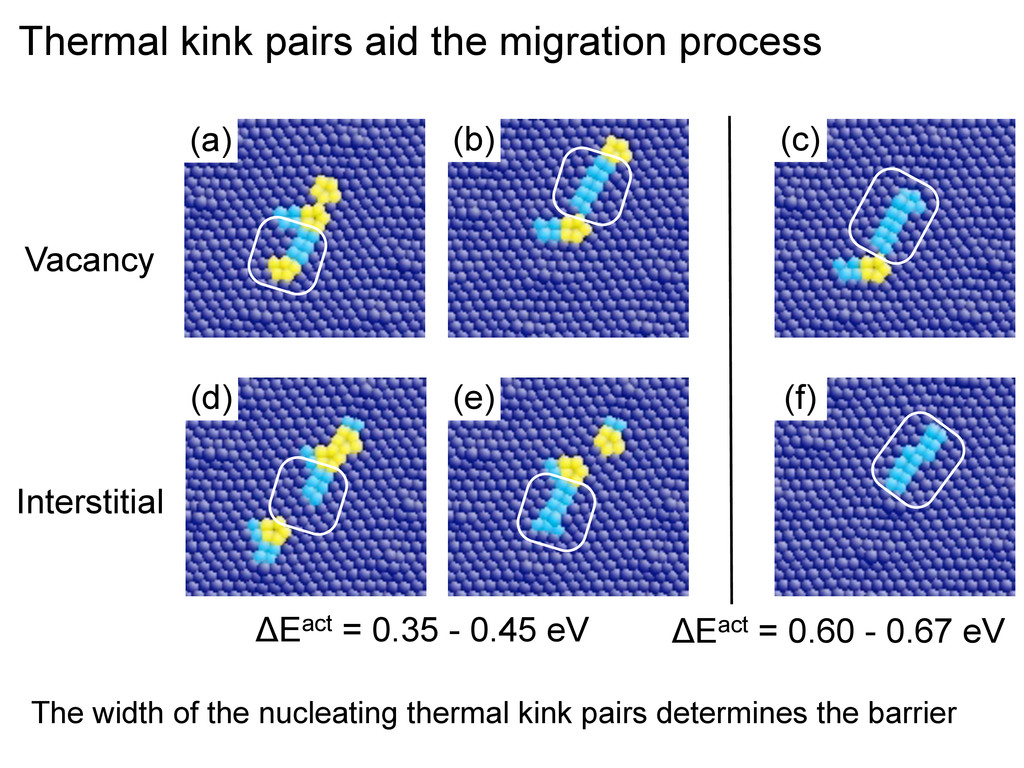
b1 !1 Set 1 Set 2 b1 !1 Set 1 Set 2 3L KJ1 KJ3´ KJ4 KJ2´ Cu ʪ112ʫ ʪ110ʫ Cu c b I Vacancy Step 2 ! (reaction coordinate) t a I t t b " E (eV) 0 0.05 0.1 0.15 0.2 0.25 0.3 0.35 0.4 0.45 0 0.1 0.2 0.3 0.4 0.5 0.6 0.7 0.8 0. t I t b t "Ea-b = 0.06 - 0.12 eV "Ea-I = 0.25 - 0.35 eV "Ea-t = 0.35 - 0.45 eV Vacancy Interstitial Thermal kink pairs aid the migration process • Thermal kink pairs nucleating at adjacent MDI mediate the migration • Migration barriers 2/3rd that of migration barriers in bulk
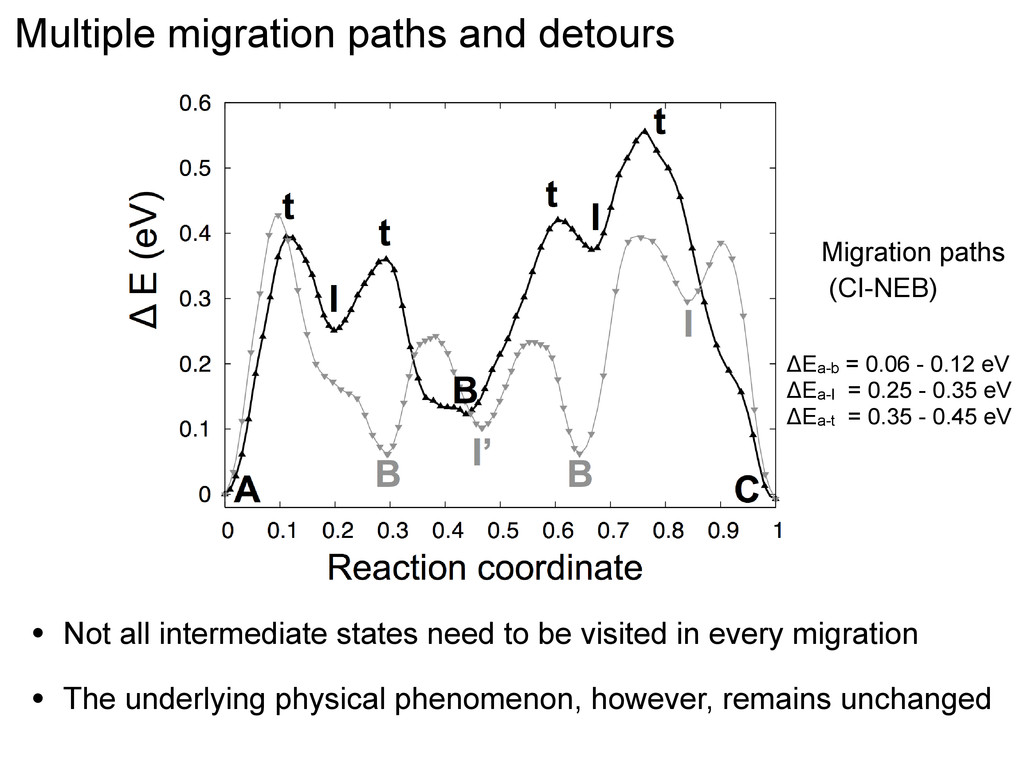
all intermediate states need to be visited in every migration • The underlying physical phenomenon, however, remains unchanged ! (reaction coordinate) t a I t t b " E (eV) 0 0.05 0.1 0.15 0.2 0.25 0.3 0.35 0.4 0.45 0 0.1 0.2 0.3 0.4 0.5 0.6 0.7 0.8 0. t I t b t "Ea-b = 0.06 - 0.12 eV "Ea-I = 0.25 - 0.35 eV "Ea-t = 0.35 - 0.45 eV Vacancy Interstitial
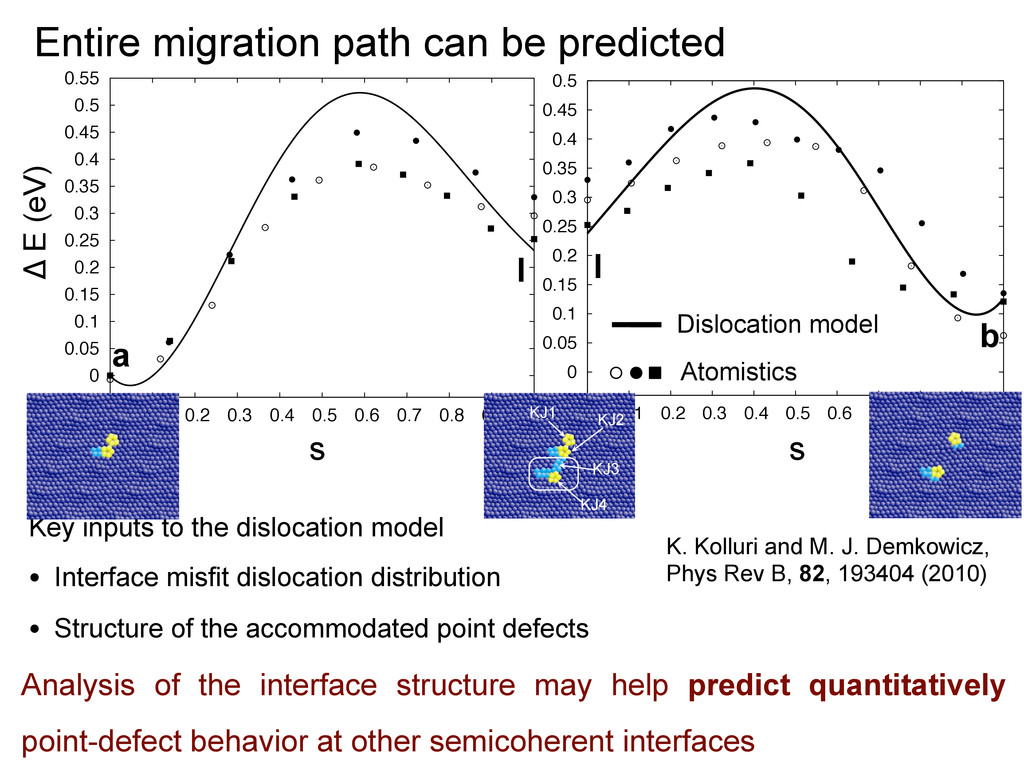
dislocation model • Interface misfit dislocation distribution • Structure of the accommodated point defects Analysis of the interface structure may help predict quantitatively point-defect behavior at other semicoherent interfaces Δ E (eV) s s 0 0.05 0.1 0.15 0.2 0.25 0.3 0.35 0.4 0.45 0.5 0.55 0 0.1 0.2 0.3 0.4 0.5 0.6 0.7 0.8 0.9 1 I a 0 0.05 0.1 0.15 0.2 0.25 0.3 0.35 0.4 0.45 0.5 0 0.1 0.2 0.3 0.4 0.5 0.6 0.7 0.8 0.9 1 b I Dislocation model Atomistics K. Kolluri and M. J. Demkowicz, Phys Rev B, 82, 193404 (2010) KJ1 KJ3´ KJ4 Cu ʪ112ʫ ʪ110ʫ Cu KJ2´ KJ4 KJ3 KJ2 KJ1
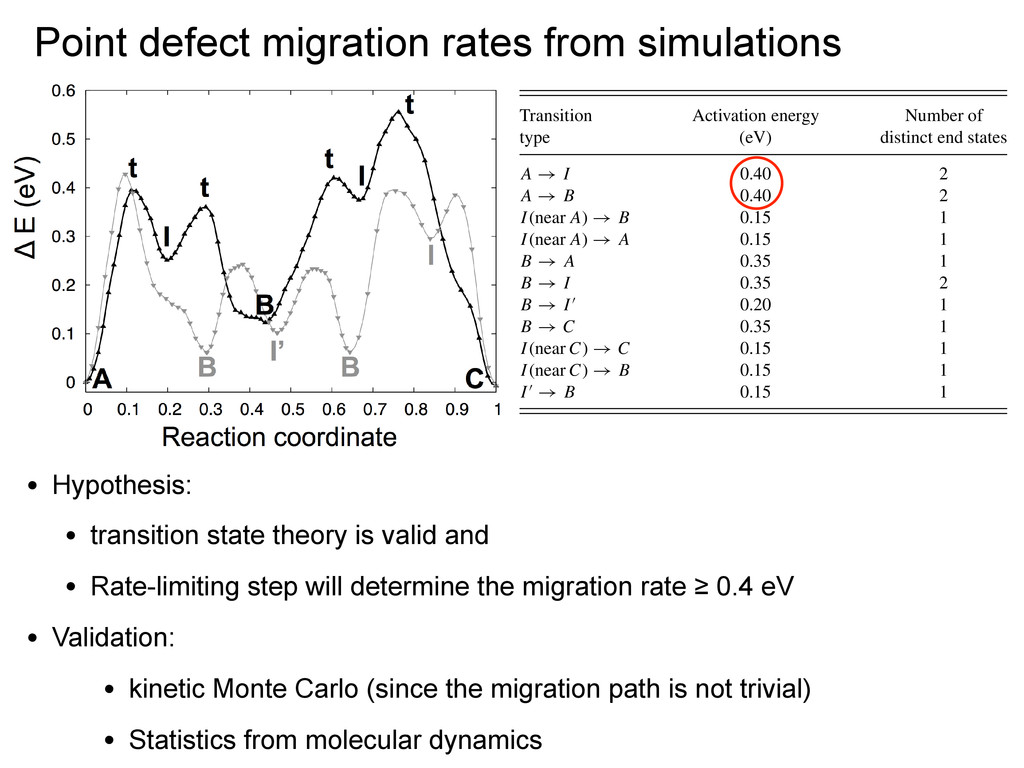
constant for all states in our dislocation model [and therefore does not appear in Eq. (1)], actually varies along the direct migration path. To estimate the core energy of the kink-jog, we summed differences in atomic energies between the core atoms and corresponding atoms in a defect- free interface. The kink-jog core is taken to consist of 19 atoms: the 5-atom ring in the Cu terminal plane and the 7 neighboring Cu and Nb atoms from each of the two planes adjacent to the Cu terminal plane. Core volumes were computed in an analogous way. The core energies of the migrating jog are plotted as filled triangles in Fig. 15(a) and are in good semiquantitative agreement with the overall energy changes occurring along the direct migration path. Core volumes are plotted as filled circles. Figure 15(b) shows the Cu and Nb interface planes with a point defect in the extended state B. Arrows mark the locations of the two kink-jogs and red lines mark the nominal locations of set 2 misfit dislocation cores. The numbers are TABLE I. Transitions occurring during migration of individual point defects that were considered in kMC simulations, their corresponding activation energy barriers, and number of distinct end states for a given start state. Transition Activation energy Number of type (eV) distinct end states A → I 0.40 2 A → B 0.40 2 I(near A) → B 0.15 1 I(near A) → A 0.15 1 B → A 0.35 1 B → I 0.35 2 B → I 0.20 1 B → C 0.35 1 I(near C) → C 0.15 1 I(near C) → B 0.15 1 I → B 0.15 1 205416-9 • Hypothesis: • transition state theory is valid and • Rate-limiting step will determine the migration rate ≥ 0.4 eV • Validation: • kinetic Monte Carlo (since the migration path is not trivial) • Statistics from molecular dynamics
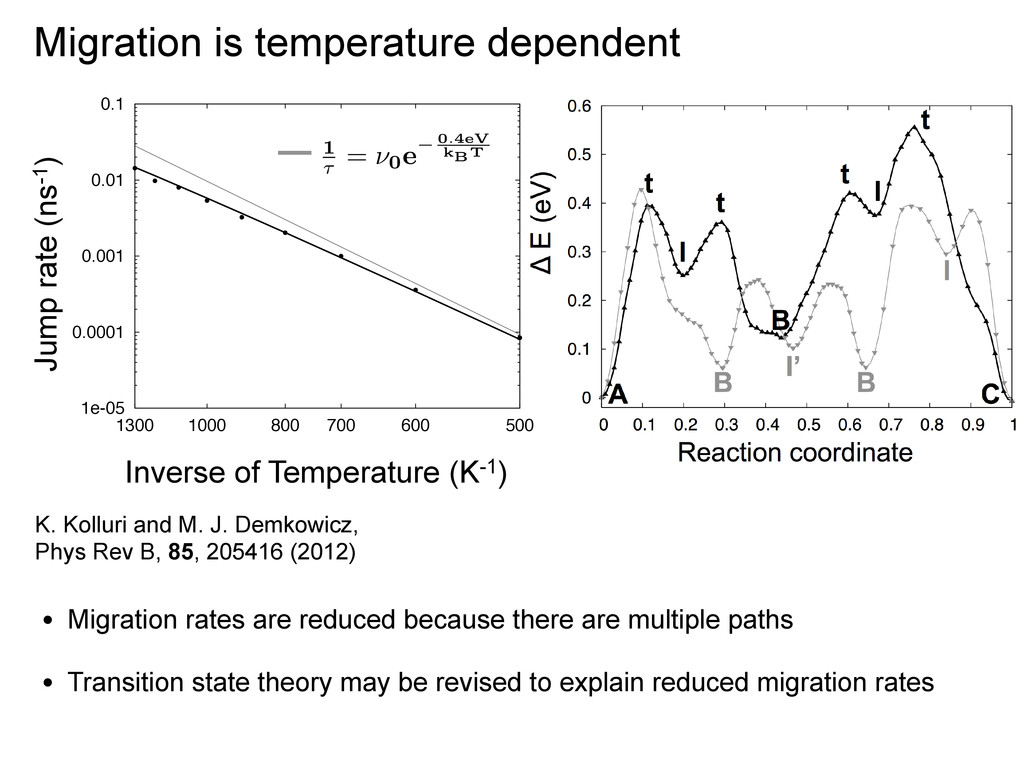
0.0001 0.001 0.01 0.1 1300 1000 800 700 600 500 Inverse of Temperature (K-1) • Migration rates are reduced because there are multiple paths • Transition state theory may be revised to explain reduced migration rates Migration is temperature dependent K. Kolluri and M. J. Demkowicz, Phys Rev B, 85, 205416 (2012)
800 700 600 500 Inverse of Temperature (K-1) Migration is temperature dependent 1 = 0 e 0.4eV kBT • Migration rates are reduced because there are multiple paths • Transition state theory may be revised to explain reduced migration rates K. Kolluri and M. J. Demkowicz, Phys Rev B, 85, 205416 (2012)
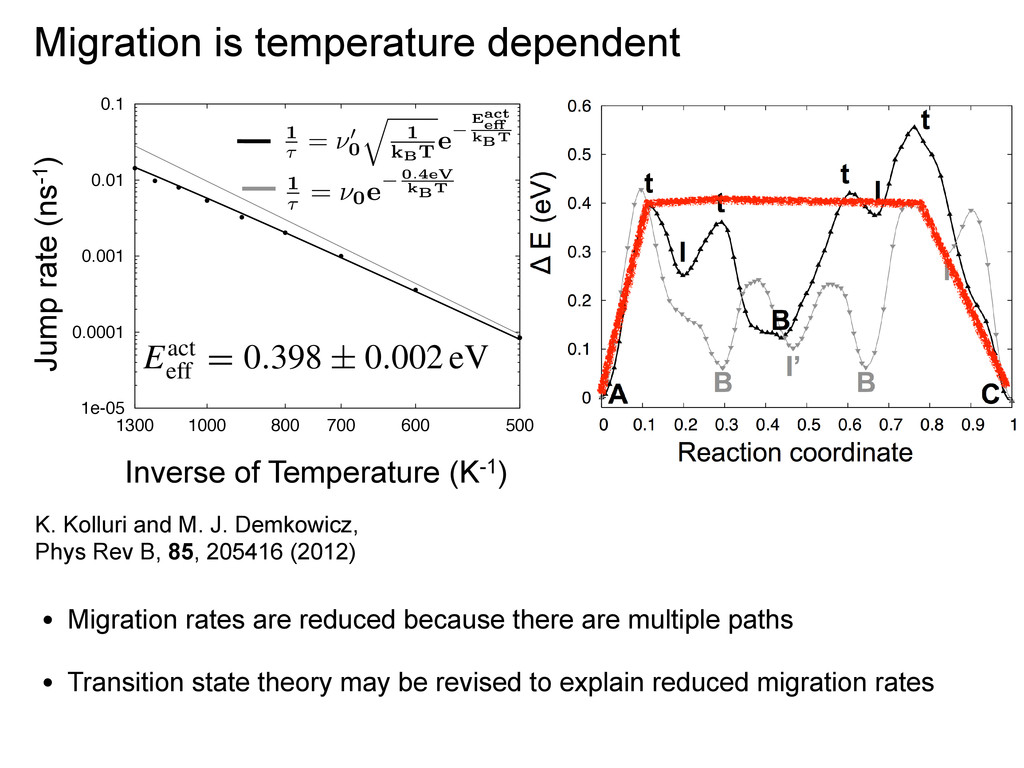
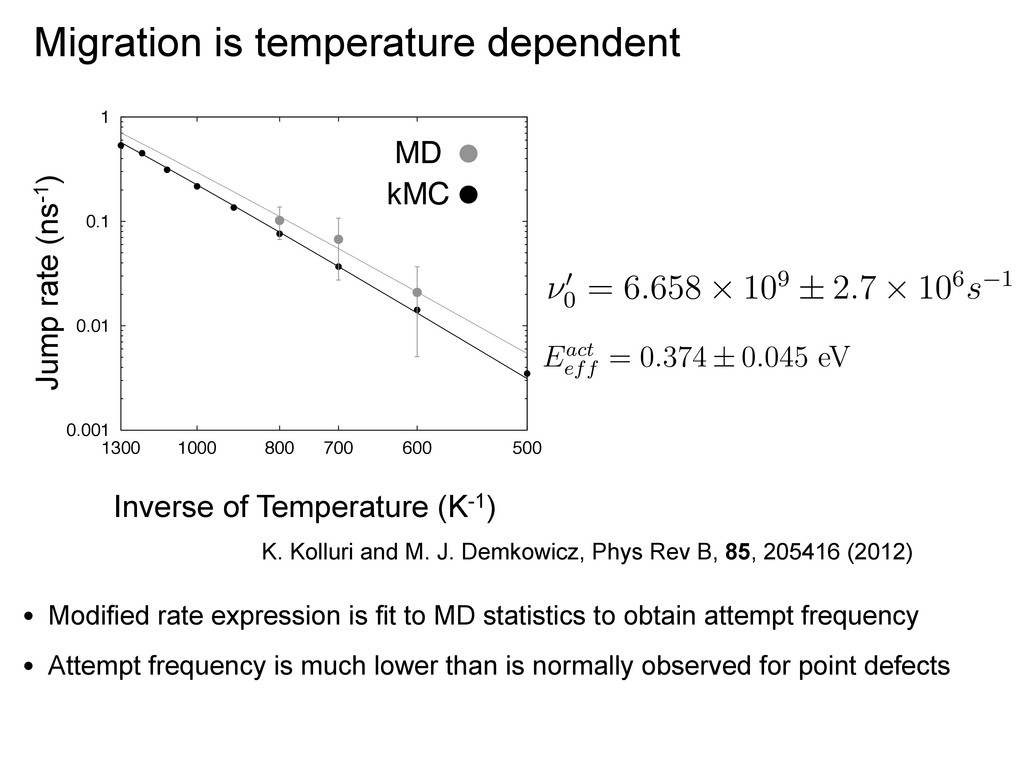
Eact e kBT 1 = 0 e 0.4eV kBT 1e-05 0.0001 0.001 0.01 0.1 1300 1000 800 700 600 500 Inverse of Temperature (K-1) Migration is temperature dependent ln[(s!)p(t/τ,s)] = s ln(t/τ) − t/τ. (10) s are obtained for all three temperatures, confirming tion that point defect migration follows a Poisson ig. 17). The jump rates for each temperature, y fitting, are plotted in Fig. 16(b) as filled gray h uncertainties corresponding to the error in the es fit. The gray line is the least-squares fit of Eq. (8) obtained from MD. The activation energy obtained MC model (Eact eff = 0.398 ± 0.002 eV) is well within nty of the activation energy found by fitting the MD y, Eact eff = 0.374 ± 0.045 eV. ctive attempt frequency for defect migration ob- fitting the MD data is ν0 = 6.658 × 10⁹ ± 2.7 × is value is several orders of magnitude lower than mpt frequencies for point defect migration in fcc , 1012−1014 s−1.72–74 A mechanistic interpretation ow migration attempt frequency is not immediately g. One possible explanation is that it arises from number of atoms participating in the migration • Migration rates are reduced because there are multiple paths • Transition state theory may be revised to explain reduced migration rates K. Kolluri and M. J. Demkowicz, Phys Rev B, 85, 205416 (2012)
600 500 Jump rate (ns-1) Inverse of Temperature (K-1) Migration is temperature dependent • Modified rate expression is fit to MD statistics to obtain attempt frequency • Attempt frequency is much lower than is normally observed for point defects model( Eact eff = 0 . 398±0 . 002 eV) is w by fitting the MD data, namely Ea e ⌫ 0 0 = 6 . 658 ⇥ 109 ± 2 . 7 ⇥ 106 s 1 tained by fitting the MD data is ⌫ 0 0 of magnitude lower than typical at namely 1012 1014 s 1 69–71. A mec frequency is not immediately forth the large number of atoms particip for migration of compact point defe frequency because it involves the m model( Eact eff = 0 . 398±0 . 002 eV) is well wi by fitting the MD data, namely Eact eff = 0 Eact eff = 0 . 374 ± 0 . 045 eV ⌫ 0 0 = 6 . 658 ⇥ for defect migration obtained by fitting t value is several orders of magnitude lowe migration in fcc Cu, namely 1012 1014 low migration attempt frequency is not im is that it arises from the large number of attempt frequency for migration of compa der of the Einstein frequency because it i K. Kolluri and M. J. Demkowicz, Phys Rev B, 85, 205416 (2012)
sites depends on interface structure • Point defects migrate from trap to trap –migration is multi-step and involves concerted motion of atoms –migration can be analytically represented