Features Kanta Kaneda1, Yuiga Wada1, Tsumugi Iida1, Naoto Nishizuka2, Yûki Kubo2, Komei Sugiura1 1 Keio University, Japan 2 National Institute of Information and Communications Technology, Japan
- Solar Flares:Explosion occurring near sunspots on the solar surface ⇒ Monitored and forecasted by national agencies (USA : NOAA) If solar flare can be predicted in advance, damage can be minimized Disasters caused by Solar Flares 1989 Massive blackout at Quebec 2003 Damaged spacecraft HAYABUSA 2022 Damaged SpaceX’s satellites NASA, https://svs.gsfc.nasa.gov/4491 Estimated damage $160 billion at North America
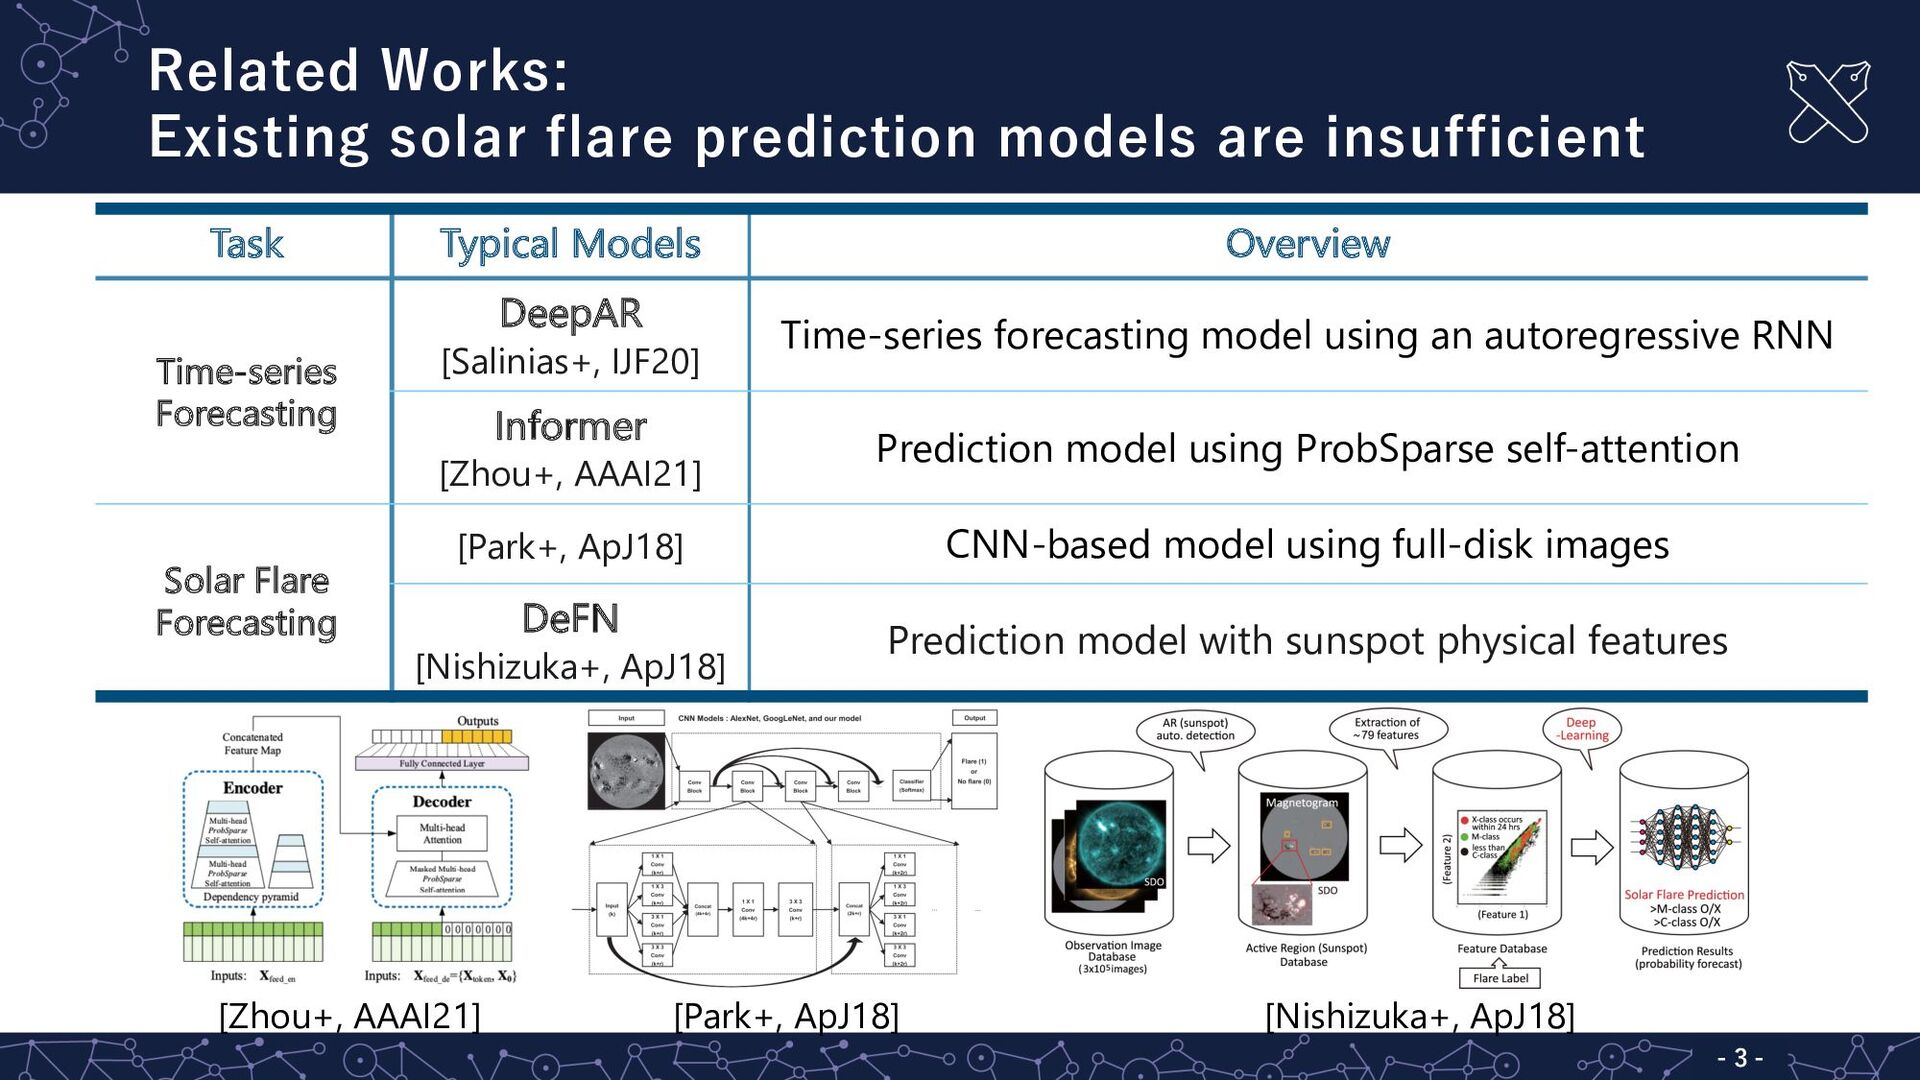
3 - Task Typical Models Overview Time-series Forecasting DeepAR [Salinias+, IJF20] Time-series forecasting model using an autoregressive RNN Informer [Zhou+, AAAI21] Prediction model using ProbSparse self-attention Solar Flare Forecasting [Park+, ApJ18] CNN-based model using full-disk images DeFN [Nishizuka+, ApJ18] Prediction model with sunspot physical features [Zhou+, AAAI21] [Park+, ApJ18] [Nishizuka+, ApJ18]
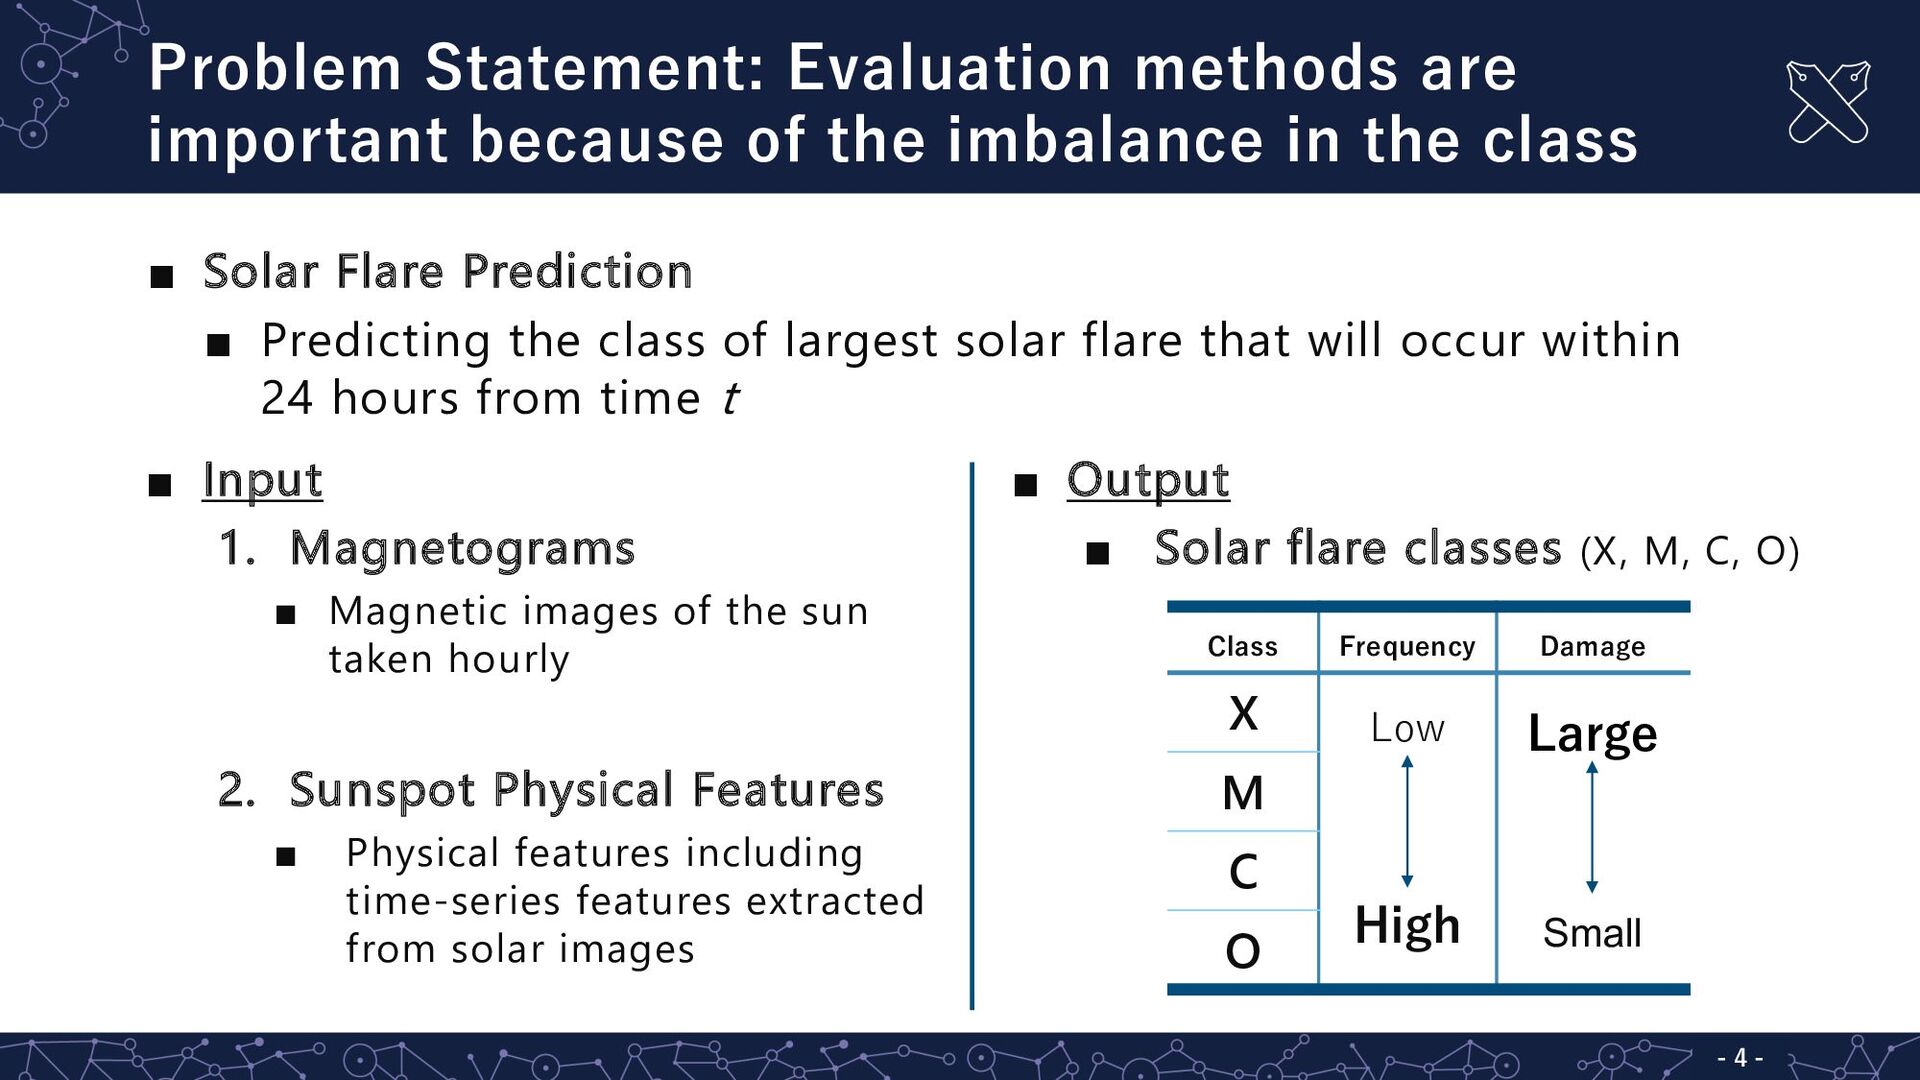
in the class - 4 - ▪ Solar Flare Prediction ▪ Predicting the class of largest solar flare that will occur within 24 hours from time t ▪ Input 1. Magnetograms ▪ Magnetic images of the sun taken hourly 2. Sunspot Physical Features ▪ Physical features including time-series features extracted from solar images ▪ Output ▪ Solar flare classes (X, M, C, O) Class Frequency Damage X Low High Large Small M C O
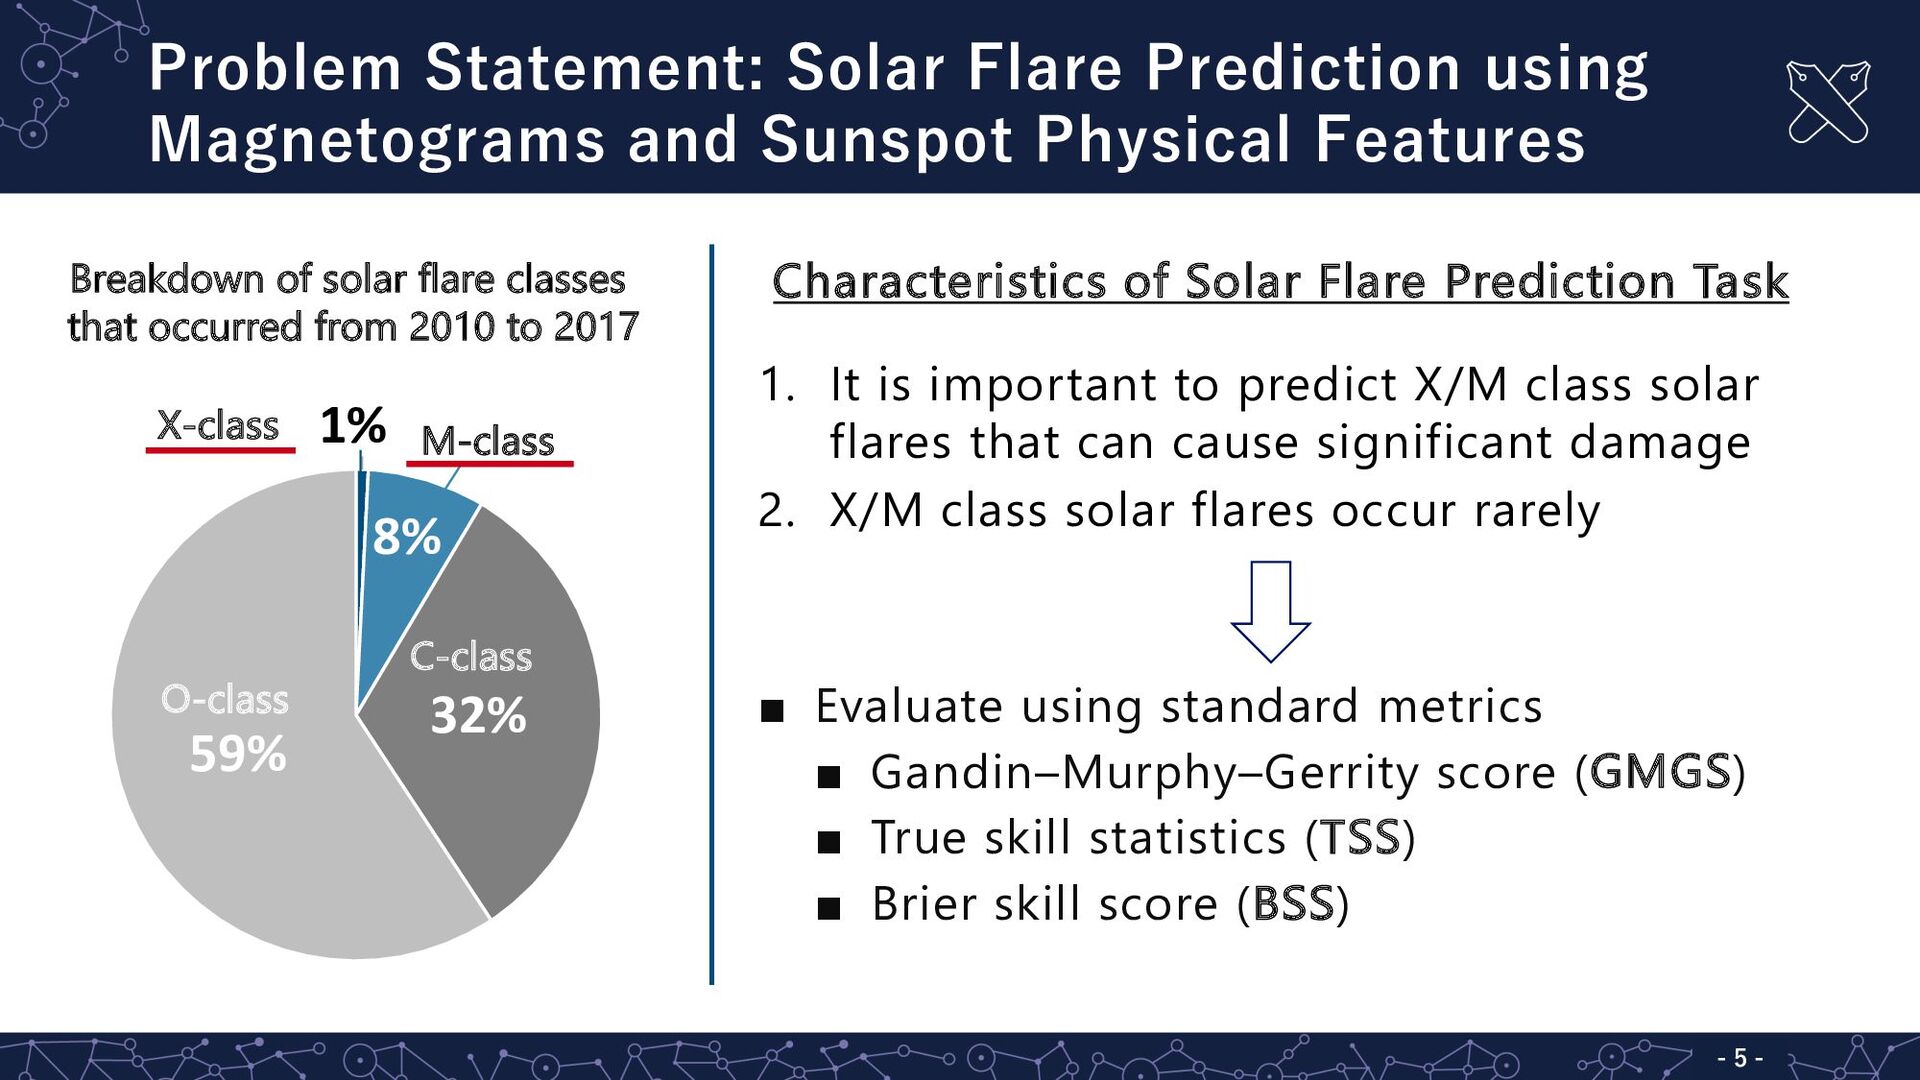
Features - 5 - Characteristics of Solar Flare Prediction Task 1. It is important to predict X/M class solar flares that can cause significant damage 2. X/M class solar flares occur rarely ▪ Evaluate using standard metrics ▪ Gandin–Murphy–Gerrity score (GMGS) ▪ True skill statistics (TSS) ▪ Brier skill score (BSS) 1% 8% 32% 59% X-class M-class C-class O-class Breakdown of solar flare classes that occurred from 2010 to 2017
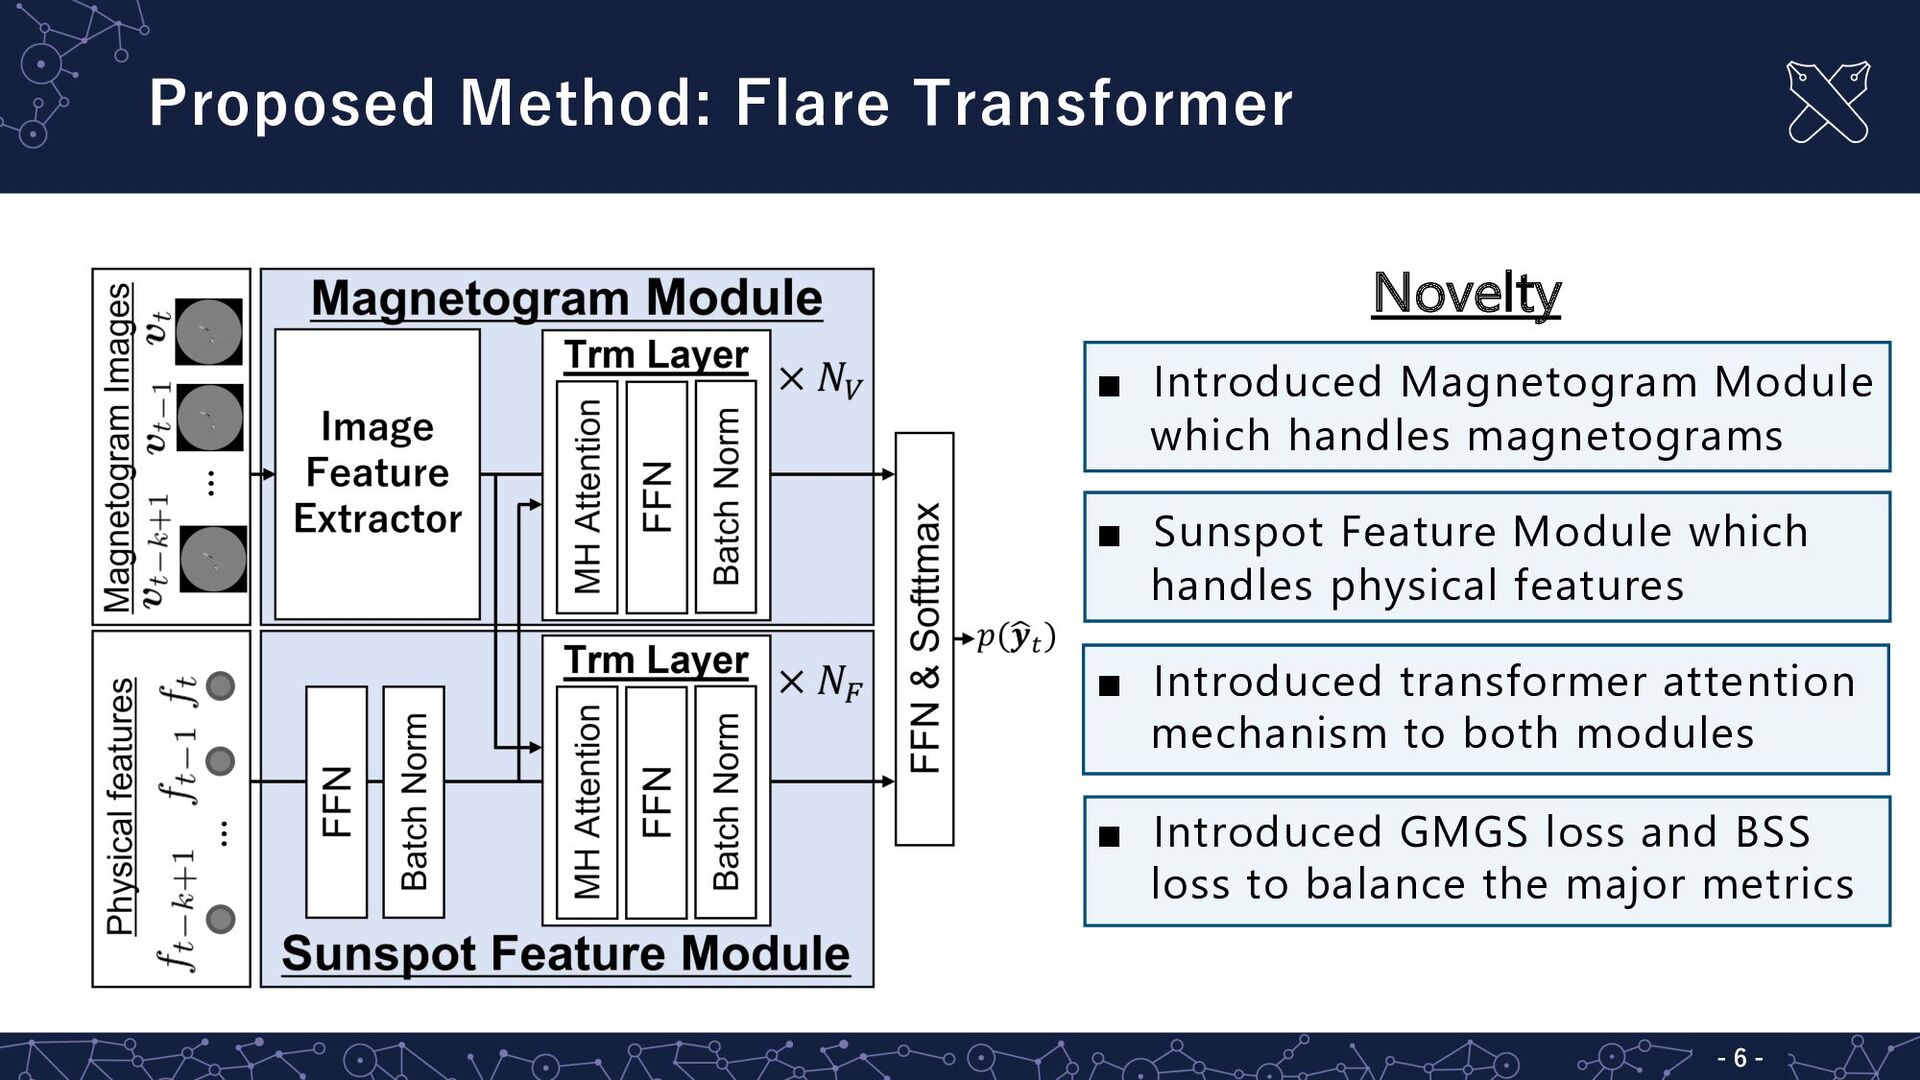
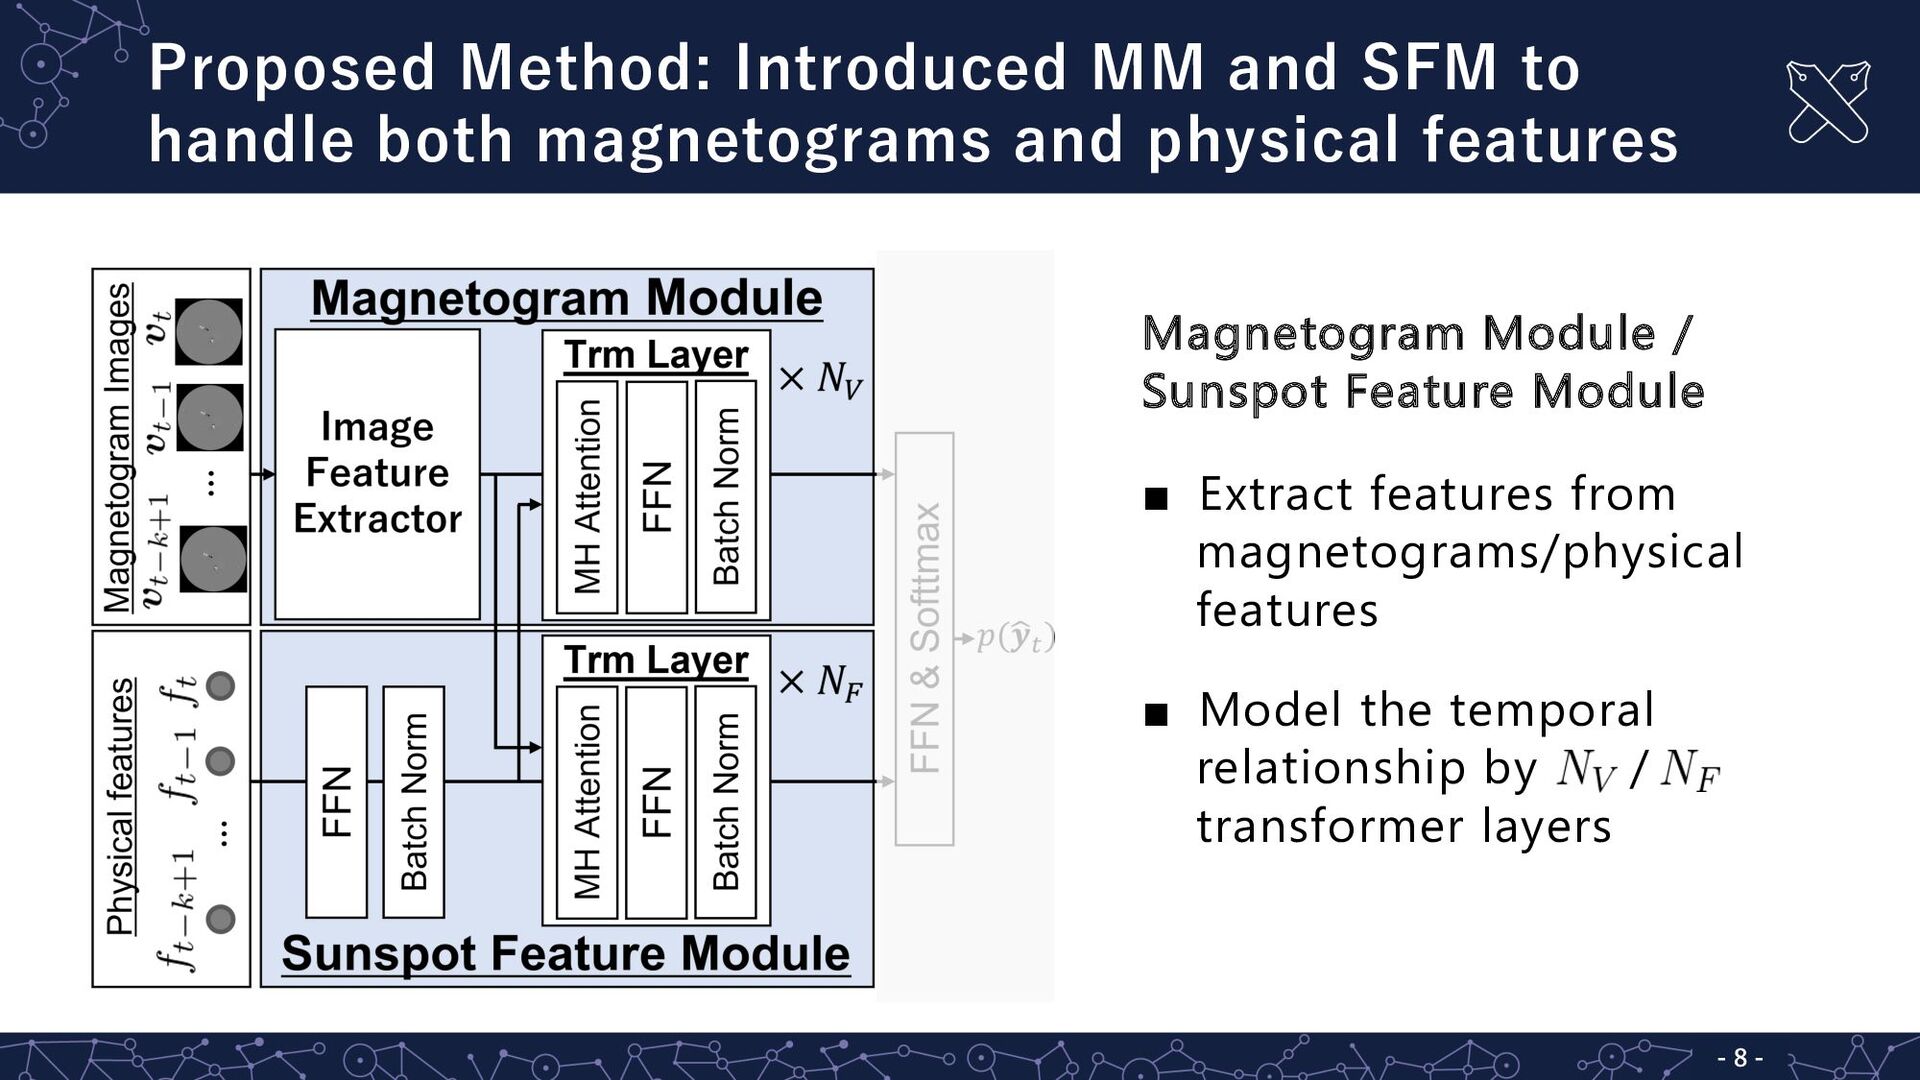
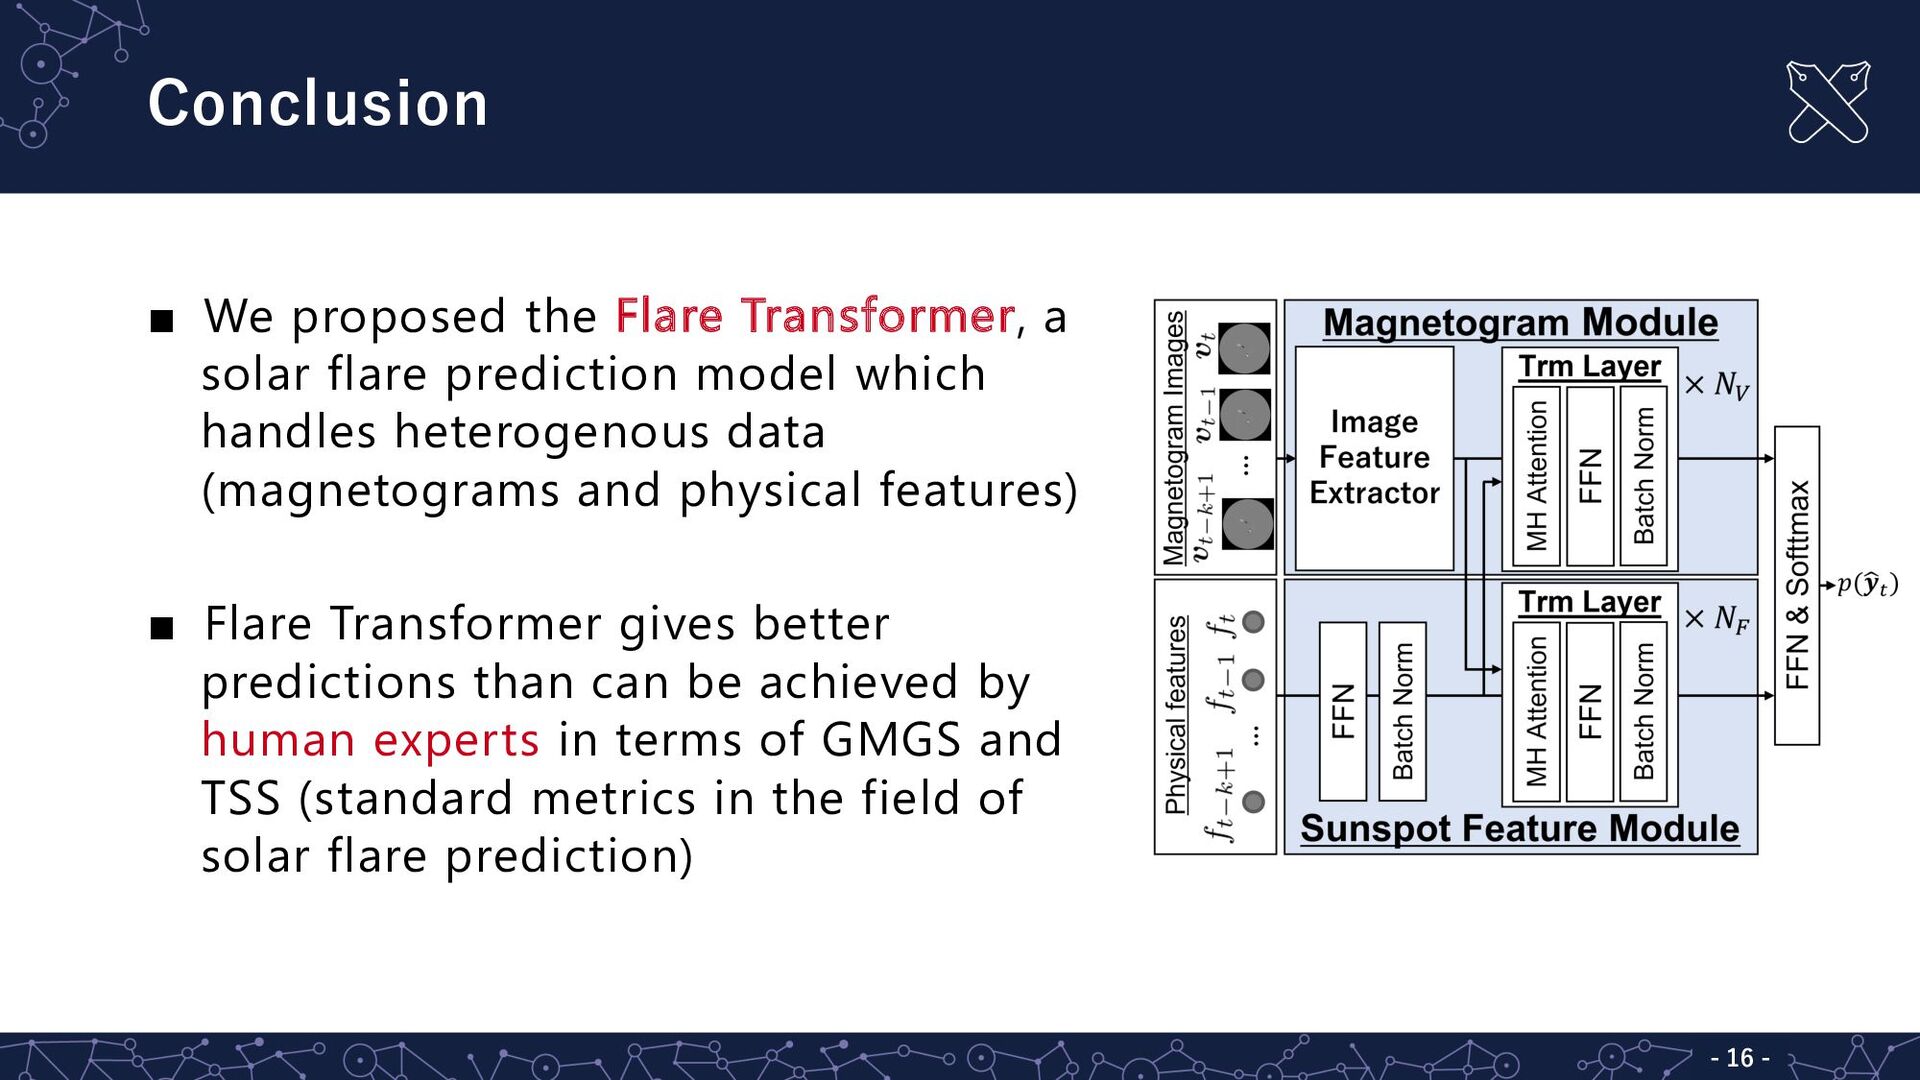
Module which handles magnetograms ▪ Sunspot Feature Module which handles physical features ▪ Introduced transformer attention mechanism to both modules ▪ Introduced GMGS loss and BSS loss to balance the major metrics Novelty
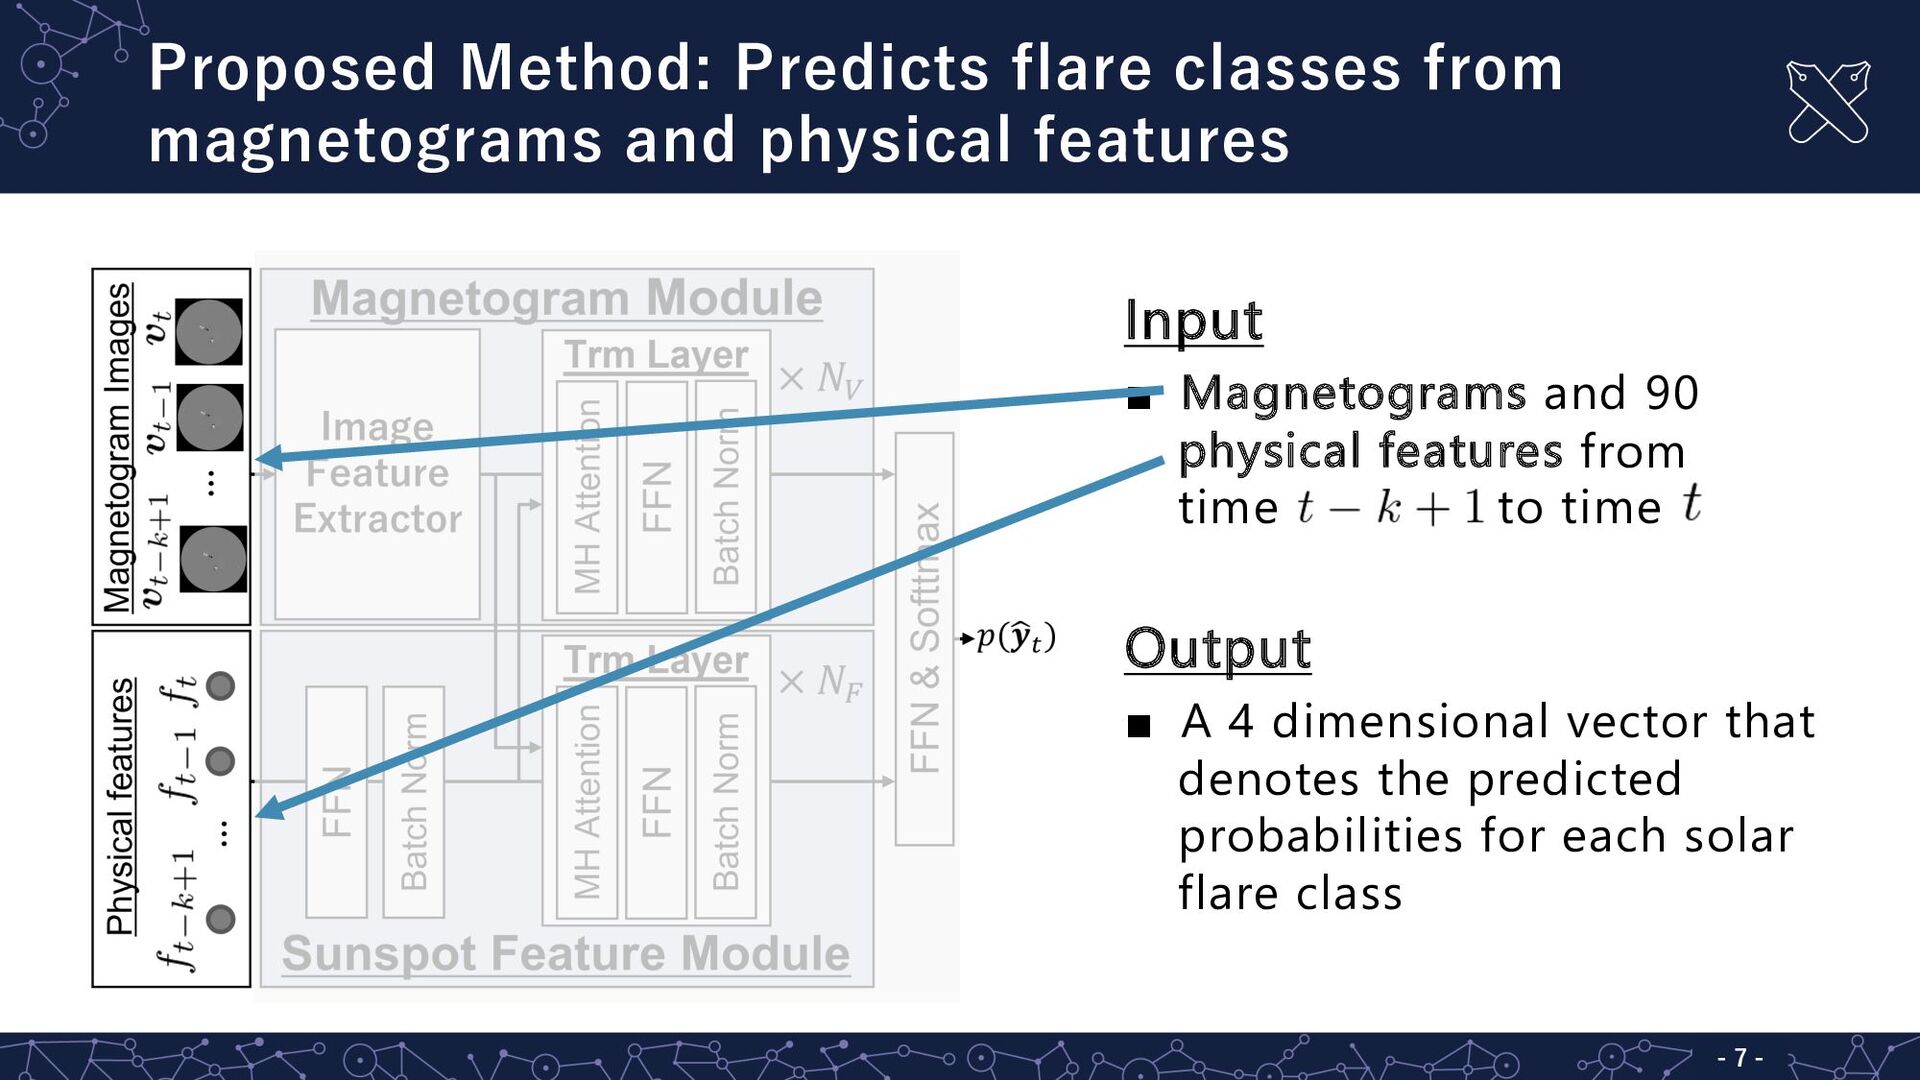
- 7 - Input ▪ Magnetograms and 90 physical features from time to time Output ▪ A 4 dimensional vector that denotes the predicted probabilities for each solar flare class
and physical features - 8 - Magnetogram Module / Sunspot Feature Module ▪ Extract features from magnetograms/physical features ▪ Model the temporal relationship by / transformer layers
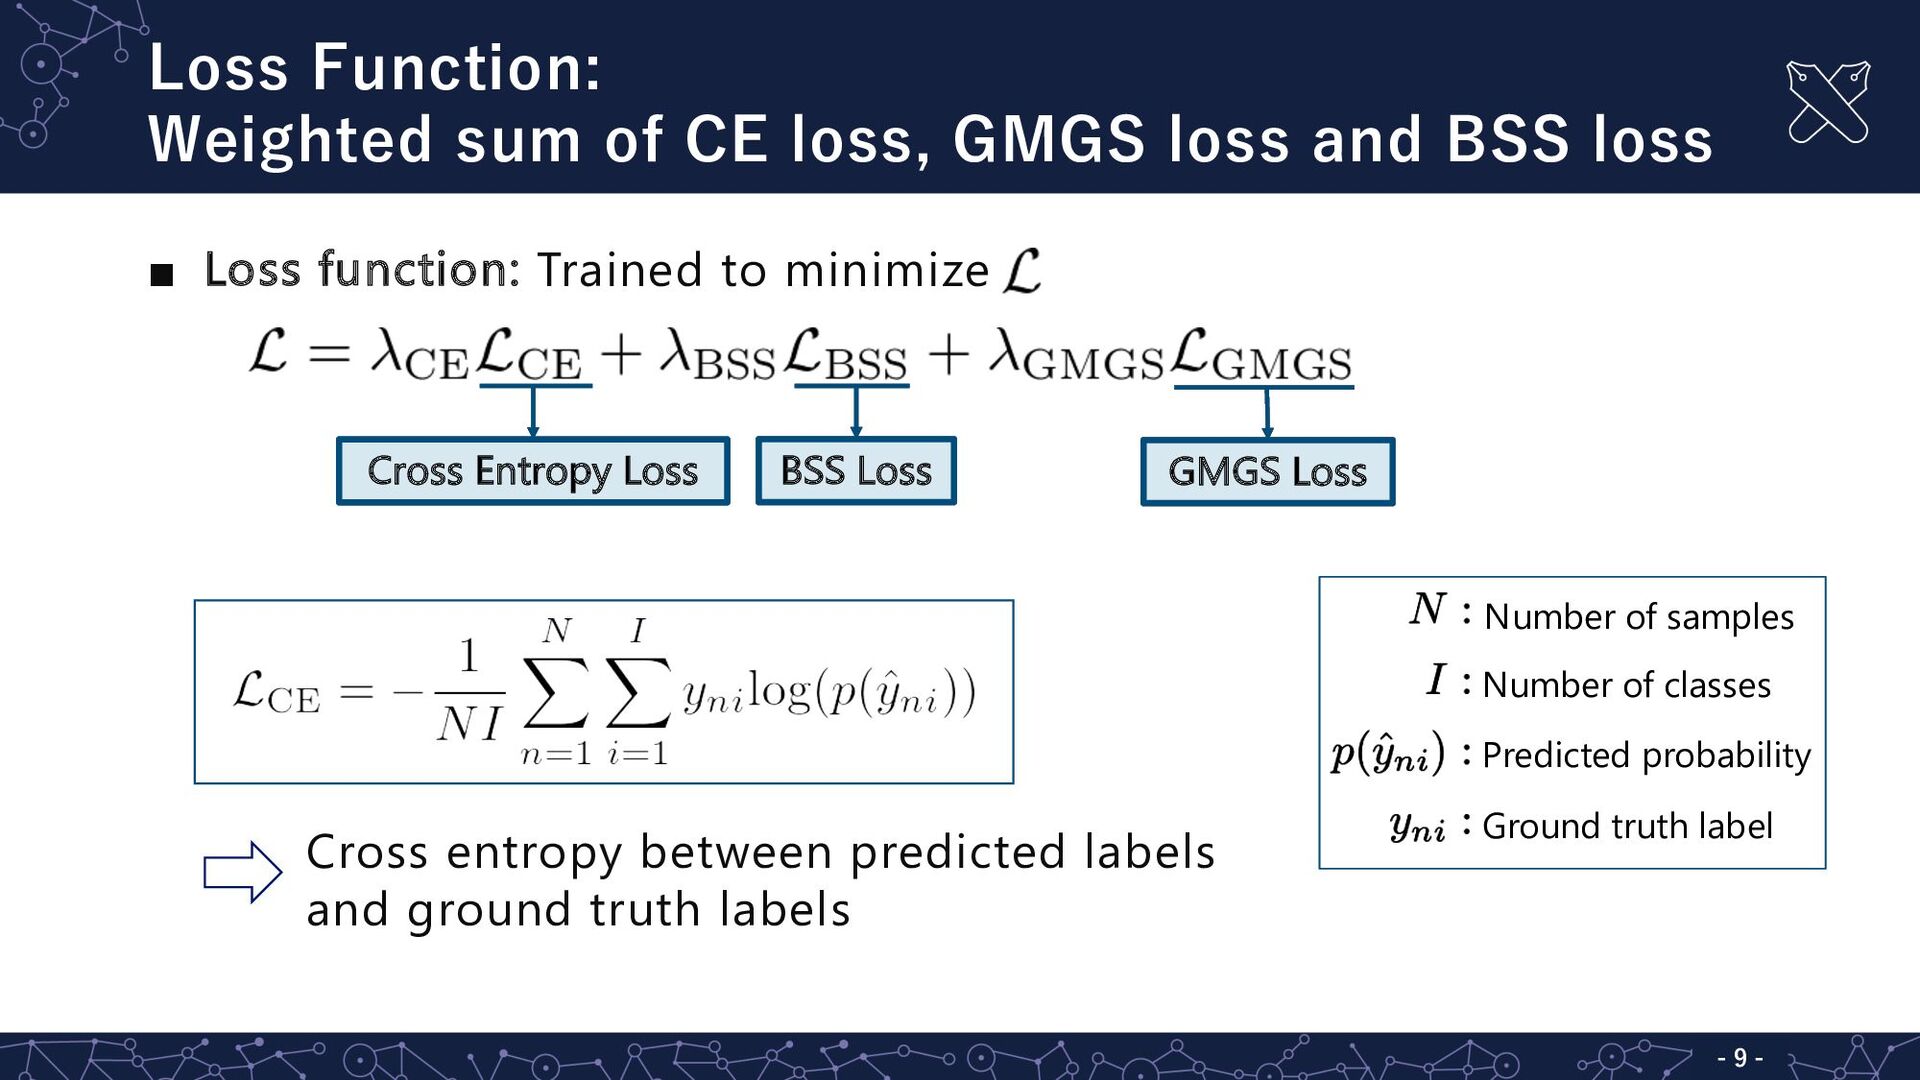
BSS loss - 9 - ▪ Loss function: Trained to minimize Cross Entropy Loss BSS Loss GMGS Loss Cross Entropy Loss BSS Loss GMGS Loss BSS Loss GMGS Loss GMGS Loss Number of samples Number of classes Predicted probability Ground truth label Cross entropy between predicted labels and ground truth labels
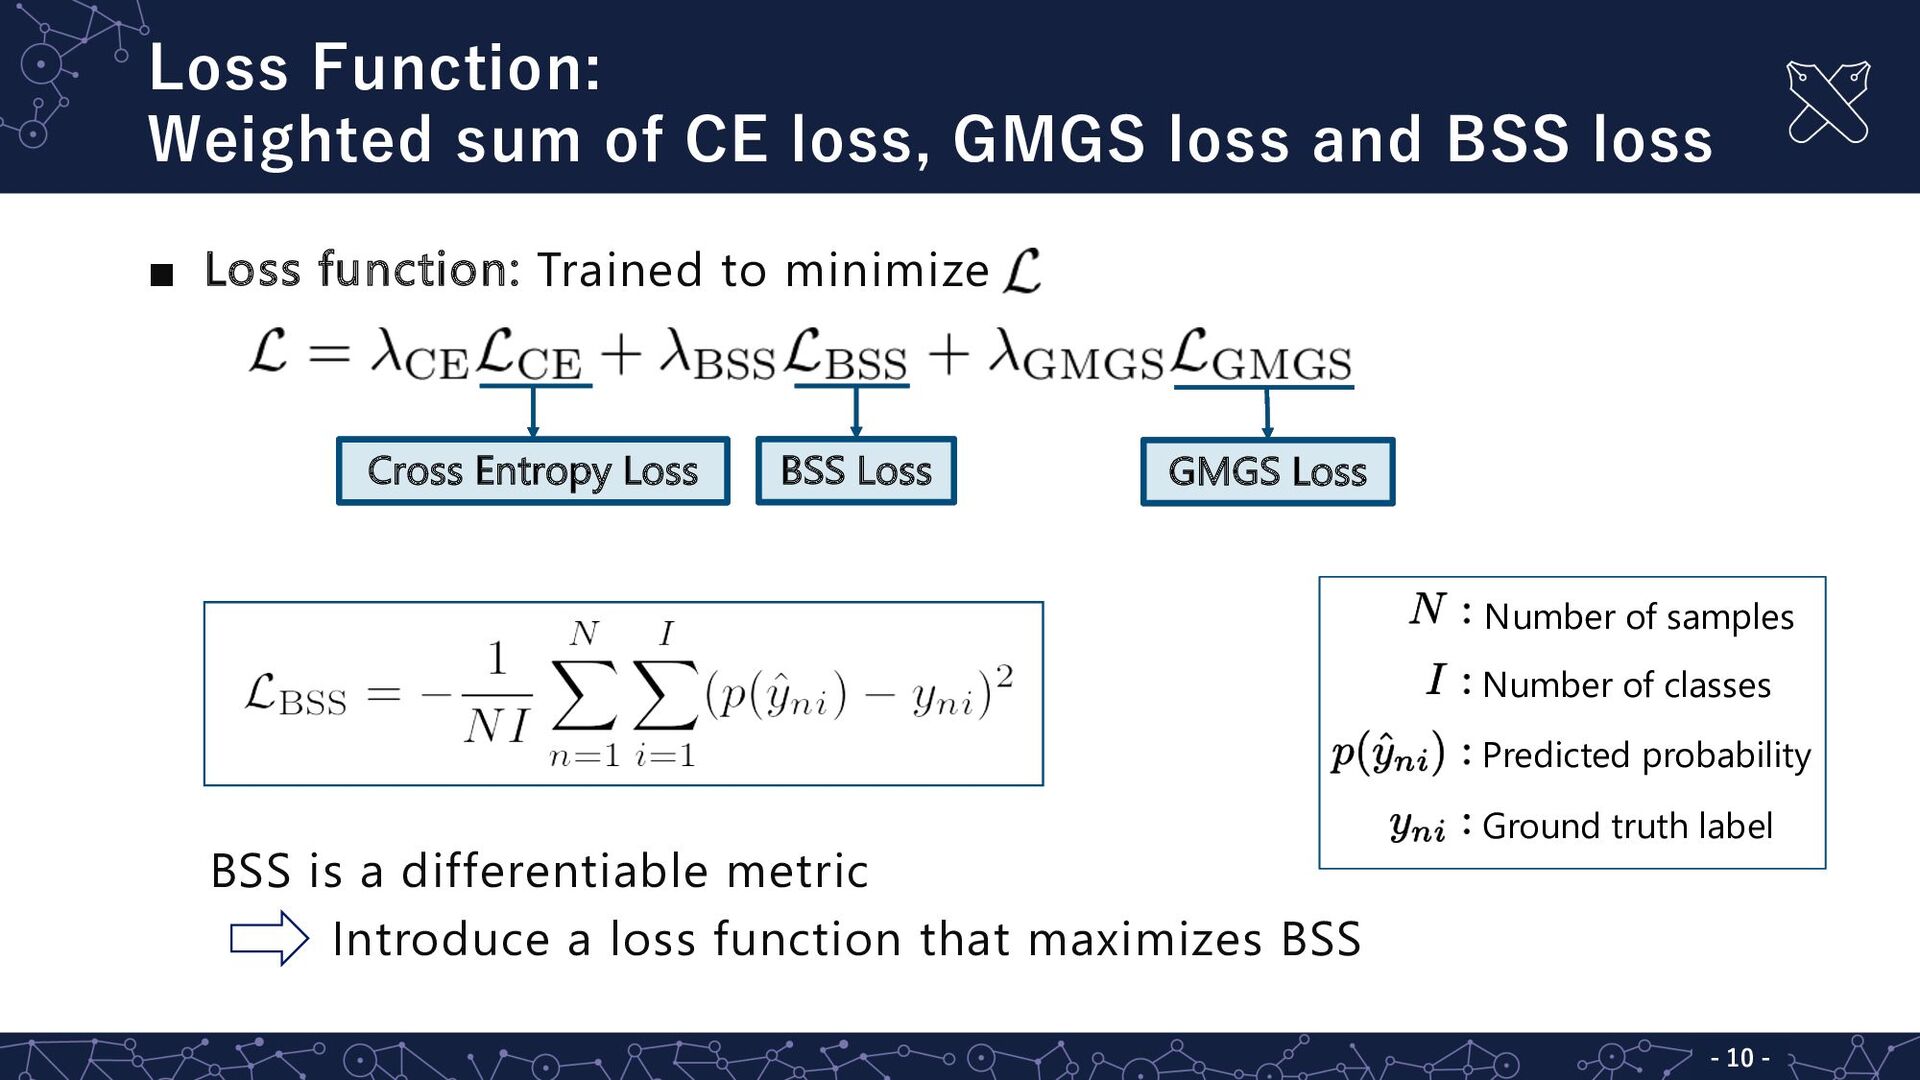
BSS loss - 10 - ▪ Loss function: Trained to minimize Cross Entropy Loss BSS Loss GMGS Loss Cross Entropy Loss BSS Loss GMGS Loss BSS Loss GMGS Loss GMGS Loss Number of samples Number of classes Predicted probability Ground truth label BSS is a differentiable metric Introduce a loss function that maximizes BSS
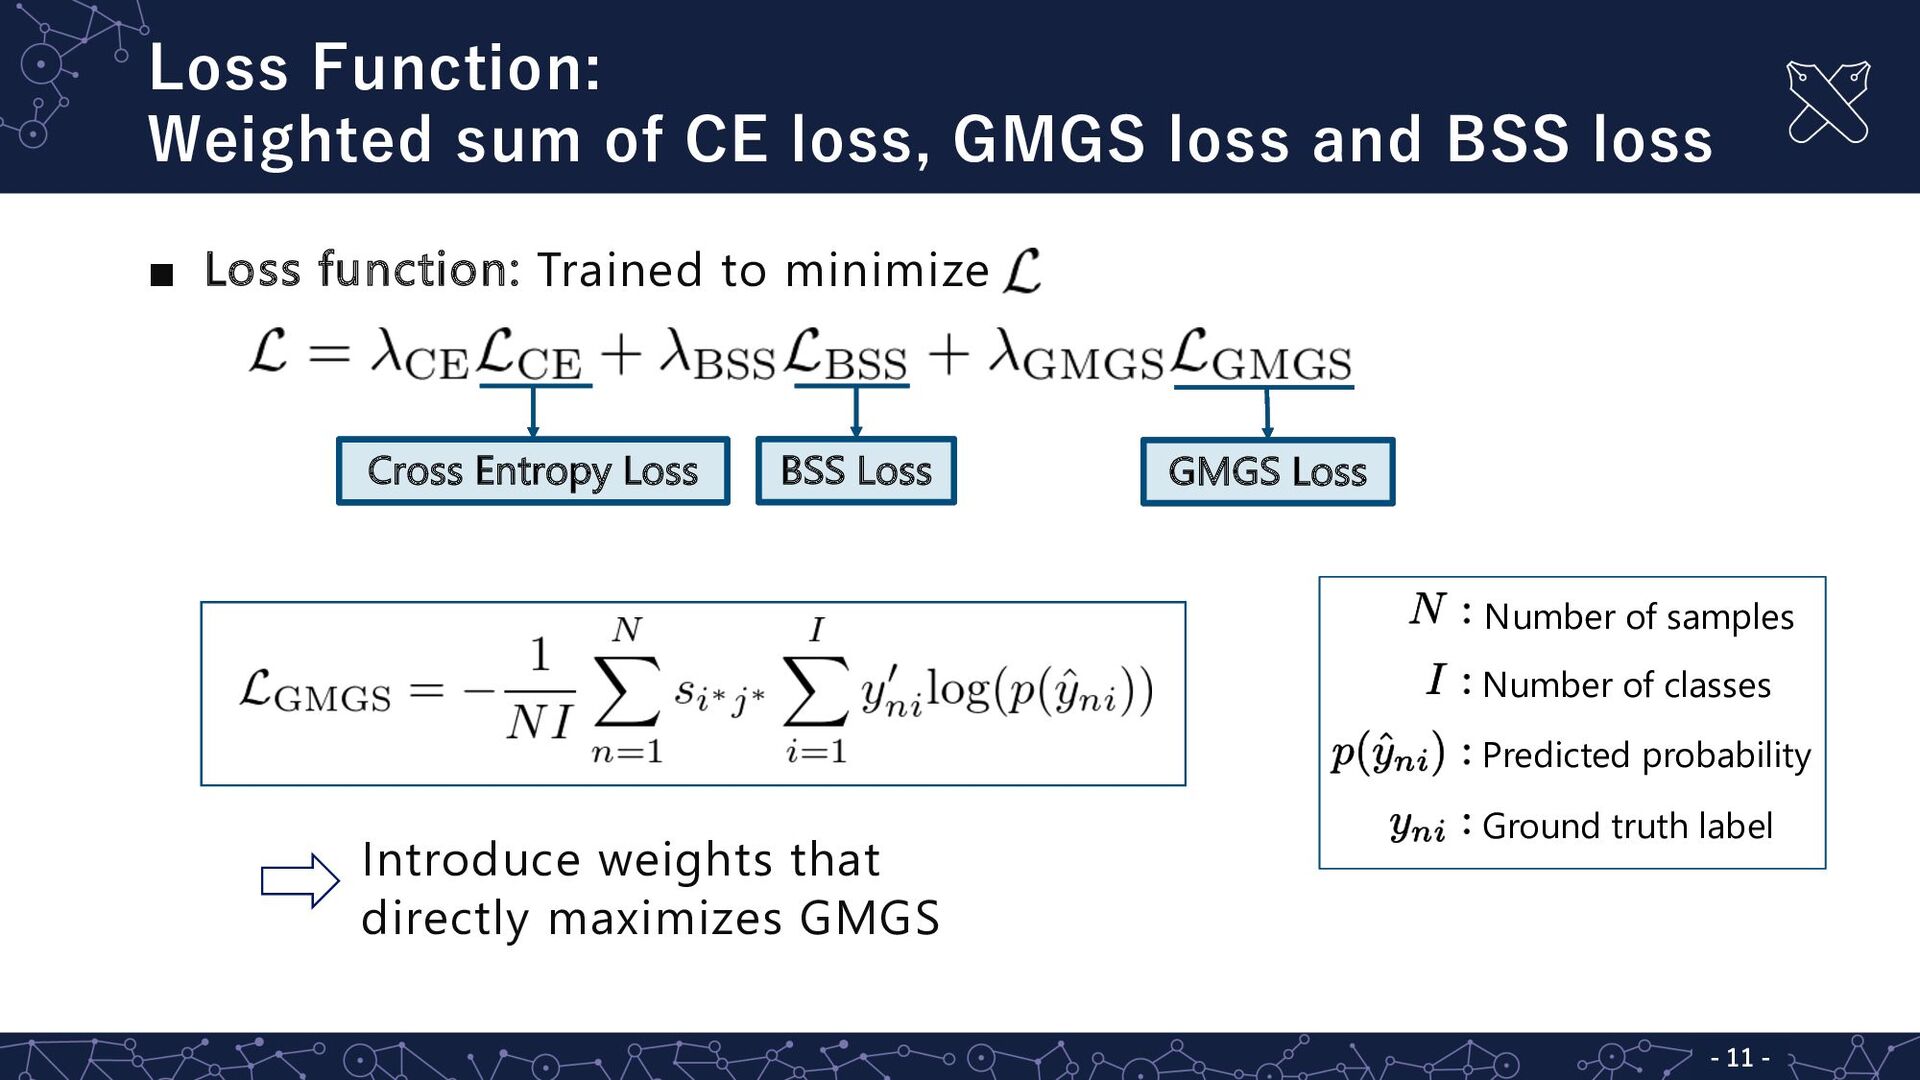
BSS loss - 11 - ▪ Loss function: Trained to minimize Cross Entropy Loss BSS Loss GMGS Loss Cross Entropy Loss BSS Loss GMGS Loss BSS Loss GMGS Loss GMGS Loss Number of samples Number of classes Predicted probability Ground truth label Introduce weights that directly maximizes GMGS
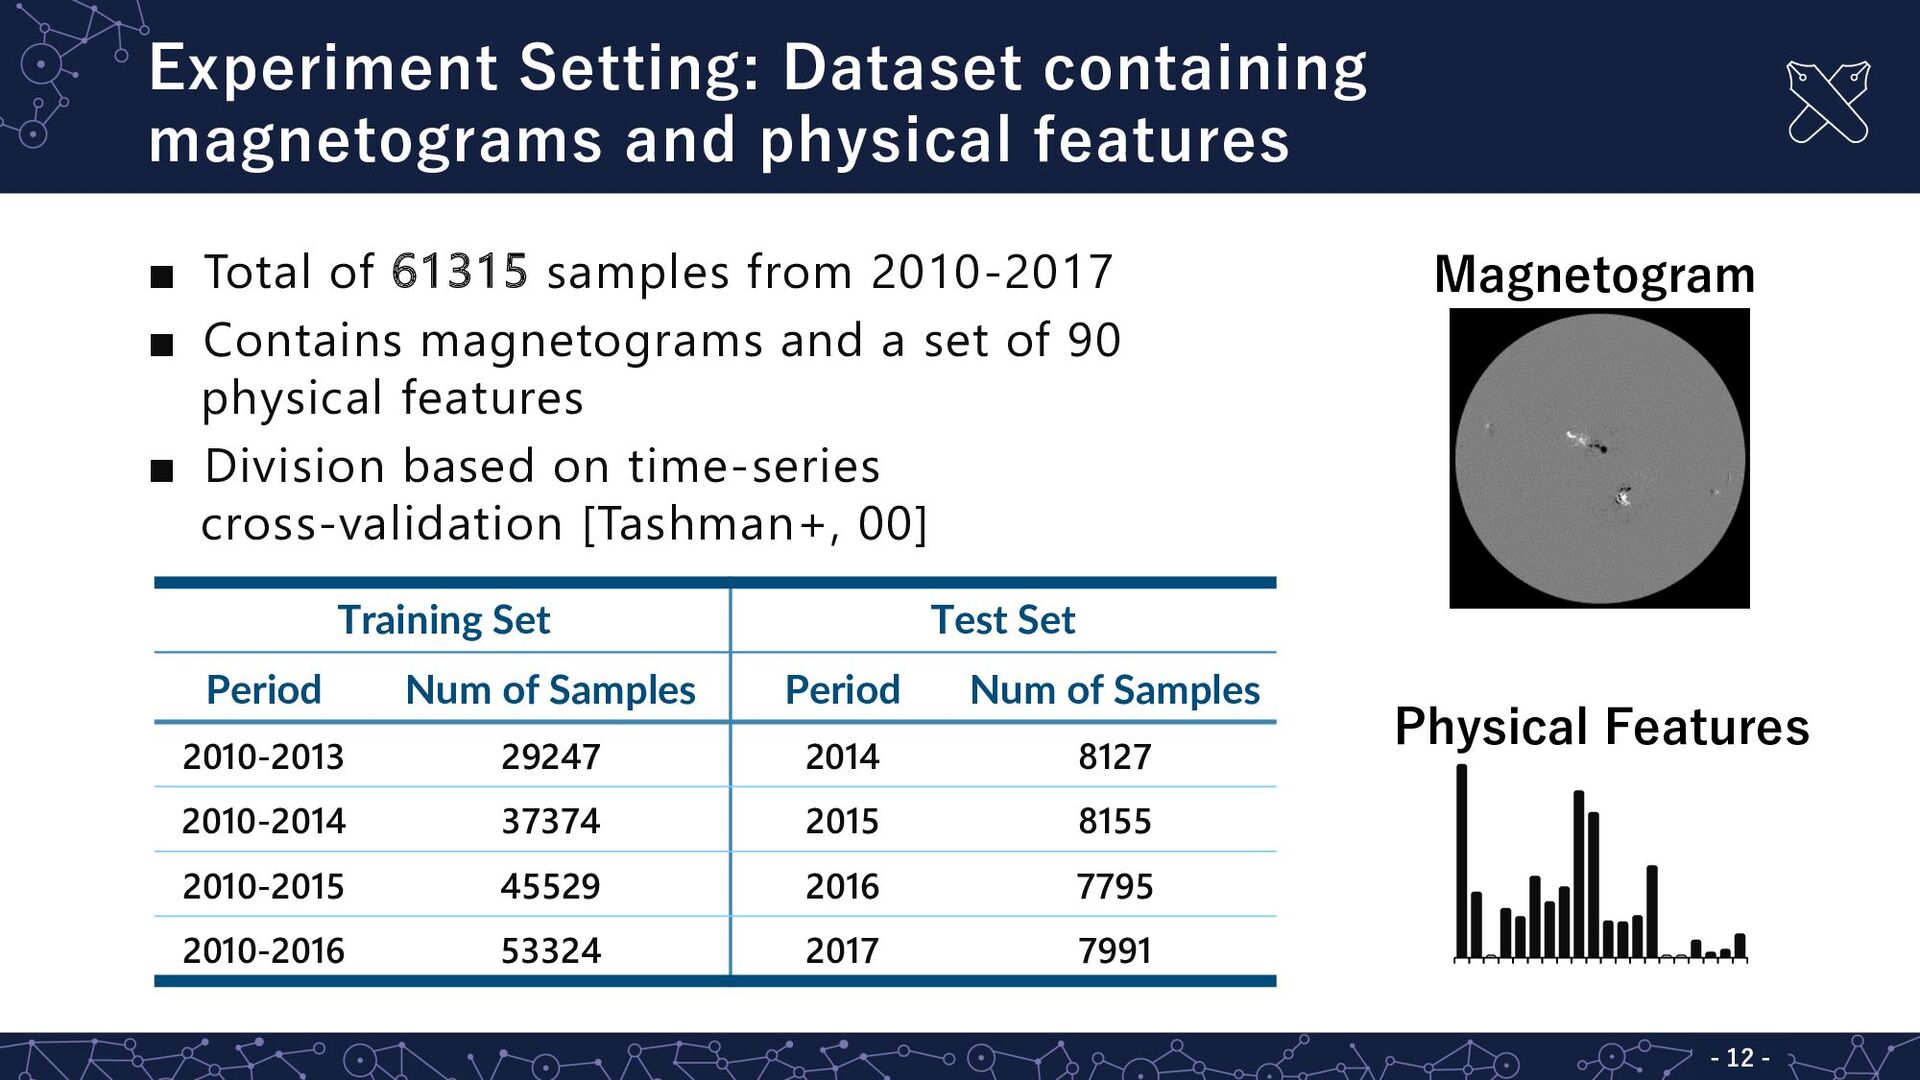
- ▪ Total of 61315 samples from 2010-2017 ▪ Contains magnetograms and a set of 90 physical features ▪ Division based on time-series cross-validation [Tashman+, 00] Magnetogram Physical Features Training Set Test Set Period Num of Samples Period Num of Samples 2010-2013 29247 2014 8127 2010-2014 37374 2015 8155 2010-2015 45529 2016 7795 2010-2016 53324 2017 7991
GMGSInfluence ▪ The main bottleneck is the misprediction of X-class flares for M-class flares Error Analysis: Main bottleneck is the misprediction of X-class flares - 15 - (Observed Class➙Predicted Class) 0 0.02 0.04 0.06 0.08 0.1 0.12 0.14 0.16 X➙M M➙C C➙O M➙O X➙O Element from the confusion matrix Element from the GMGS score matrix
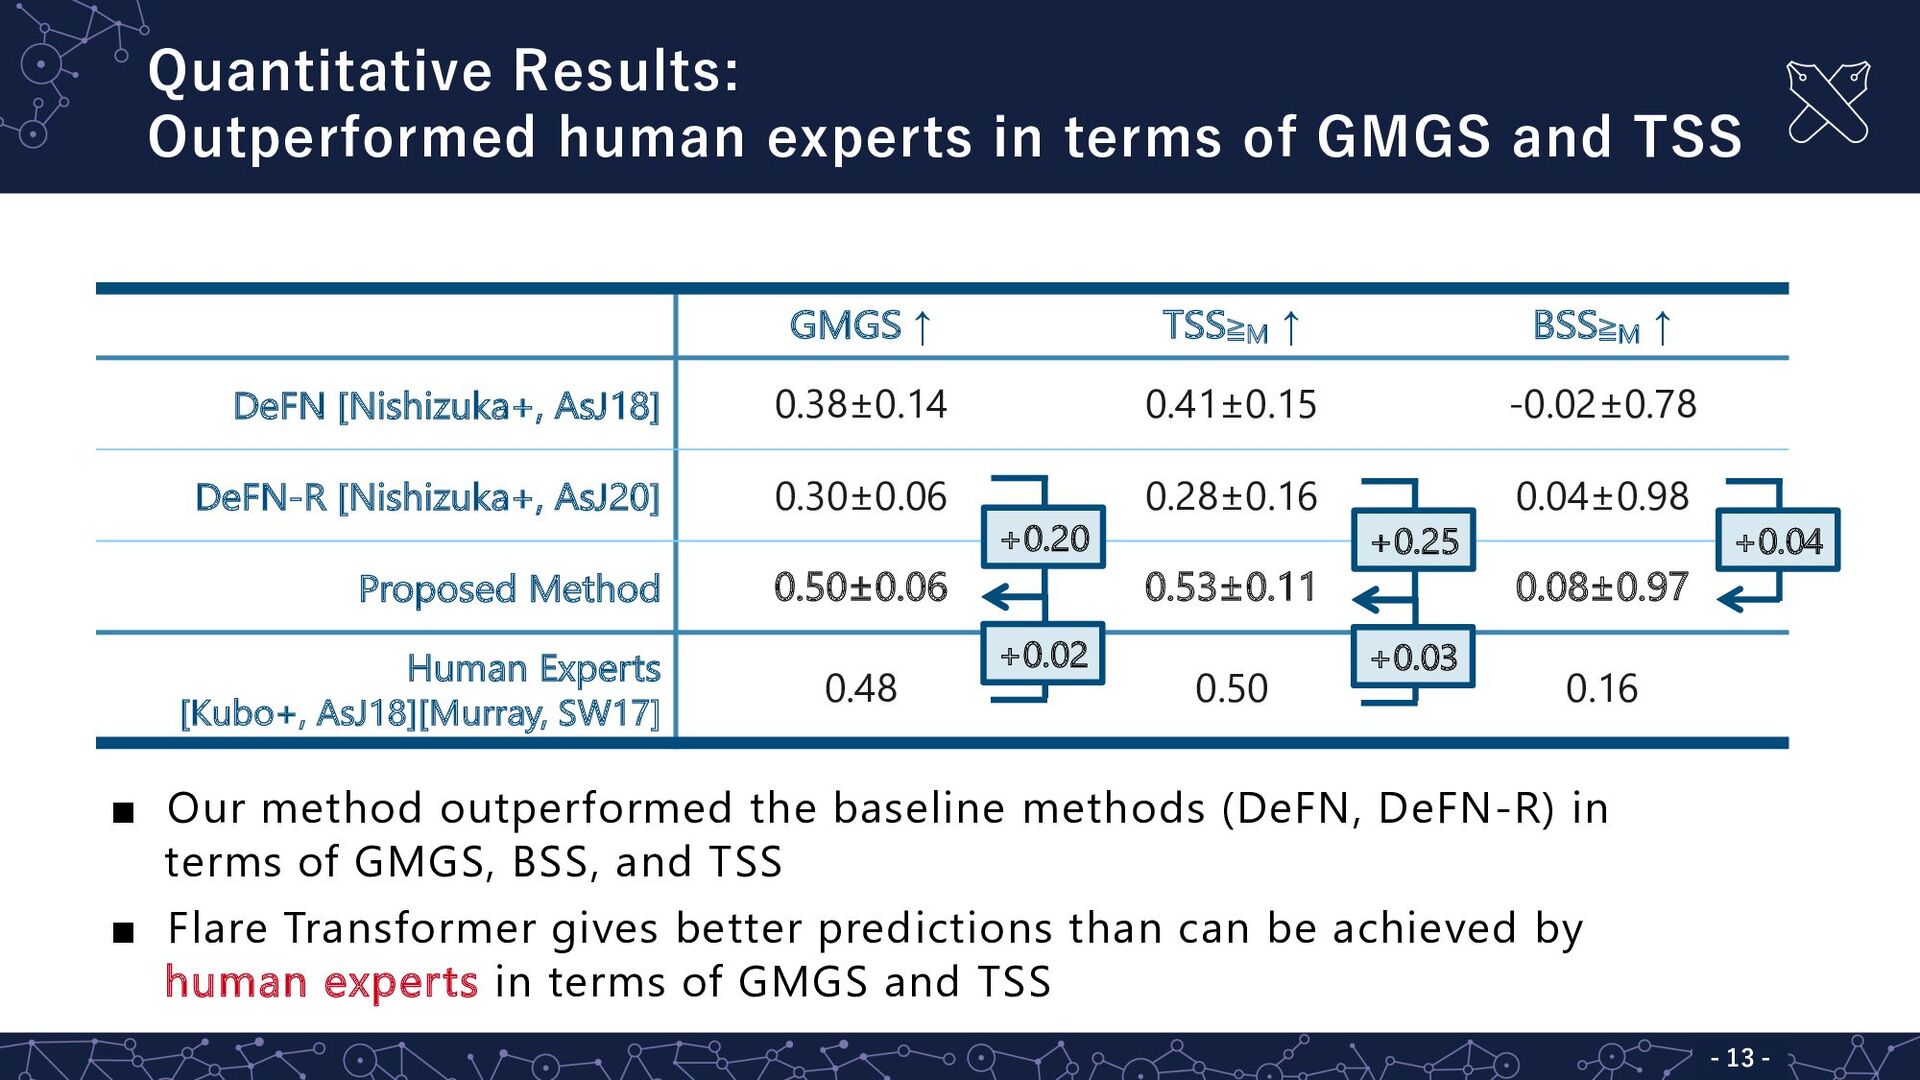
model which handles heterogenous data (magnetograms and physical features) ▪ Flare Transformer gives better predictions than can be achieved by human experts in terms of GMGS and TSS (standard metrics in the field of solar flare prediction) Conclusion - 16 -