Upgrade to Pro — share decks privately, control downloads, hide ads and more …

Concrete and Whole-Picture Type Indices to Measure Redistributive Preference: Analysing Japanese Nationwide Survey Data

Koji Yamamoto
November 28, 2019

Concrete and Whole-Picture Type Indices to Measure Redistributive Preference: Analysing Japanese Nationwide Survey Data

Presentation at TASA Conference, Sydney, Australia, November 28, 2019

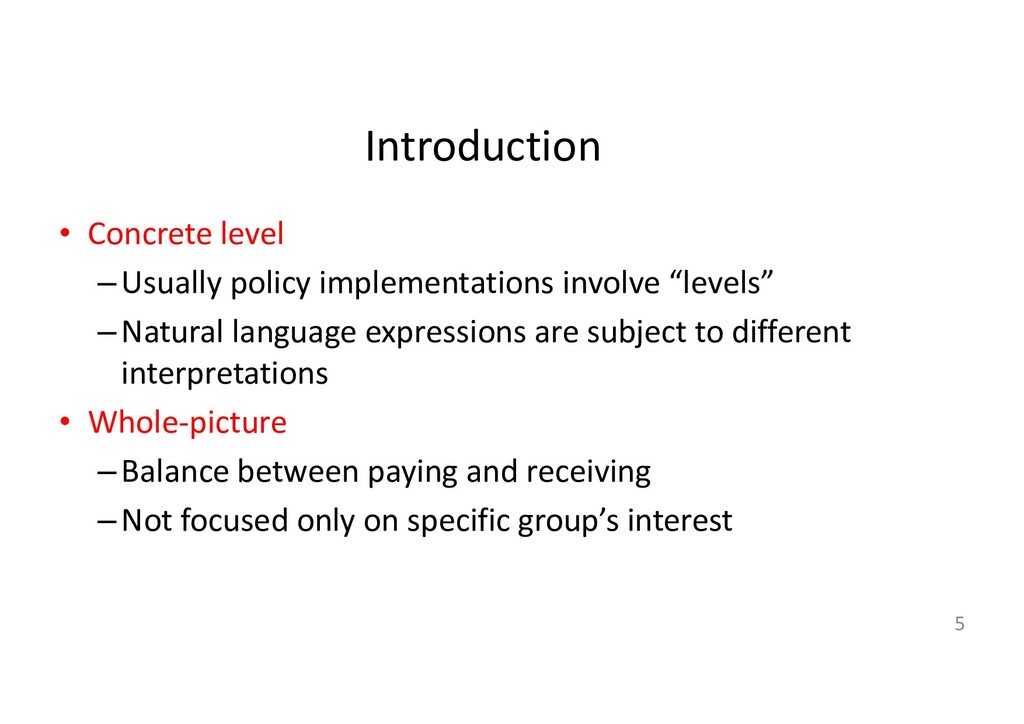
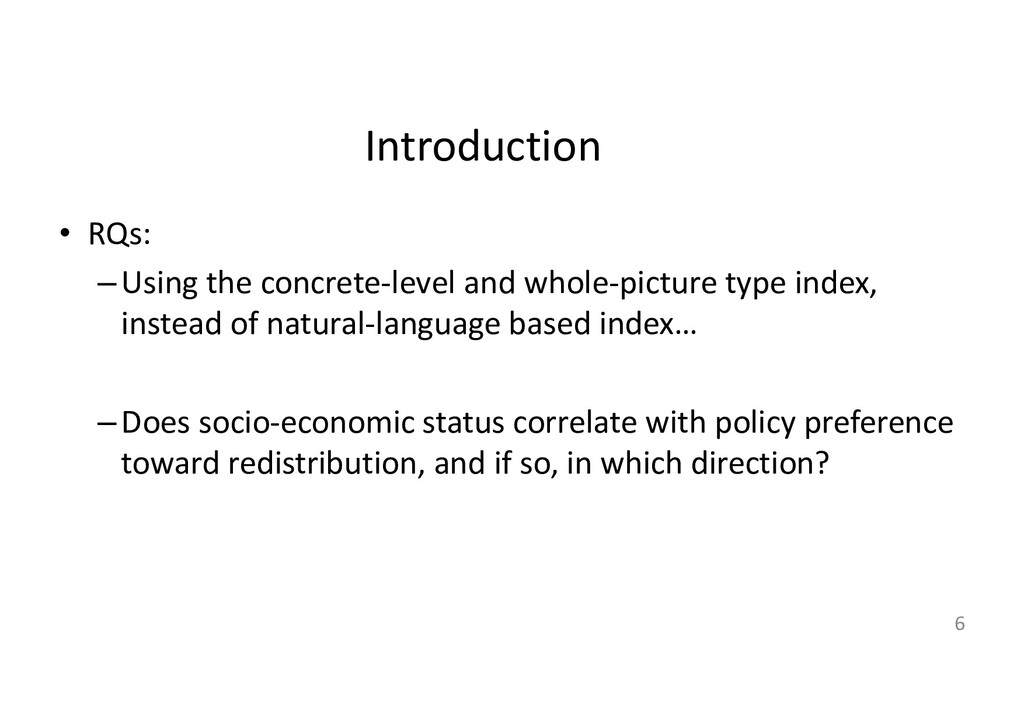
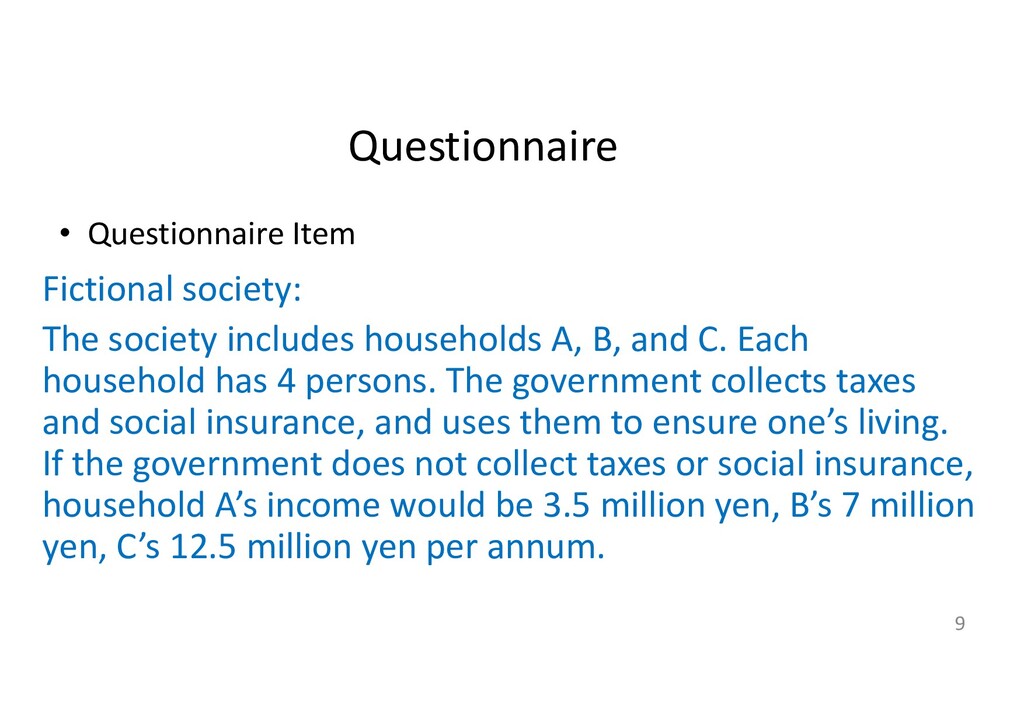
What is the conflict over income redistribution policy like? Empirical studies explaining peoples' redistributive preference, including sociological ones, have repeatedly confirmed those with economically weaker positions tend to support redistribution, which is consistent with self-interest argument. However, most of the studies utilize natural-language based responses in surveys, and also express concern about ambiguity in wording. In the present study we are to analyse concrete and whole-picture type indices instead.
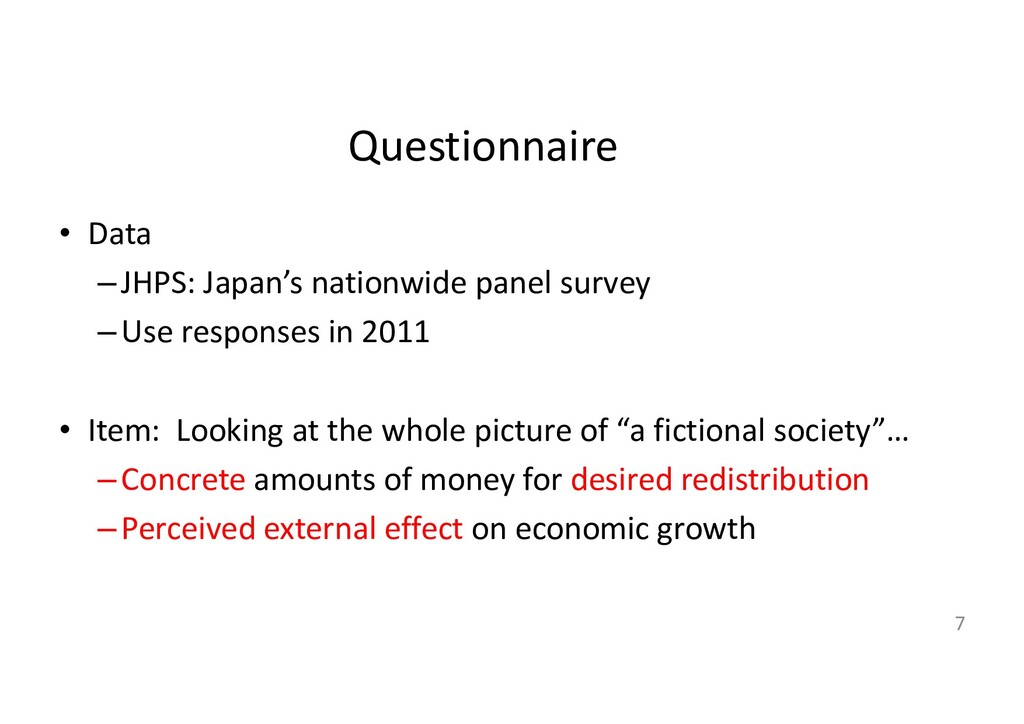
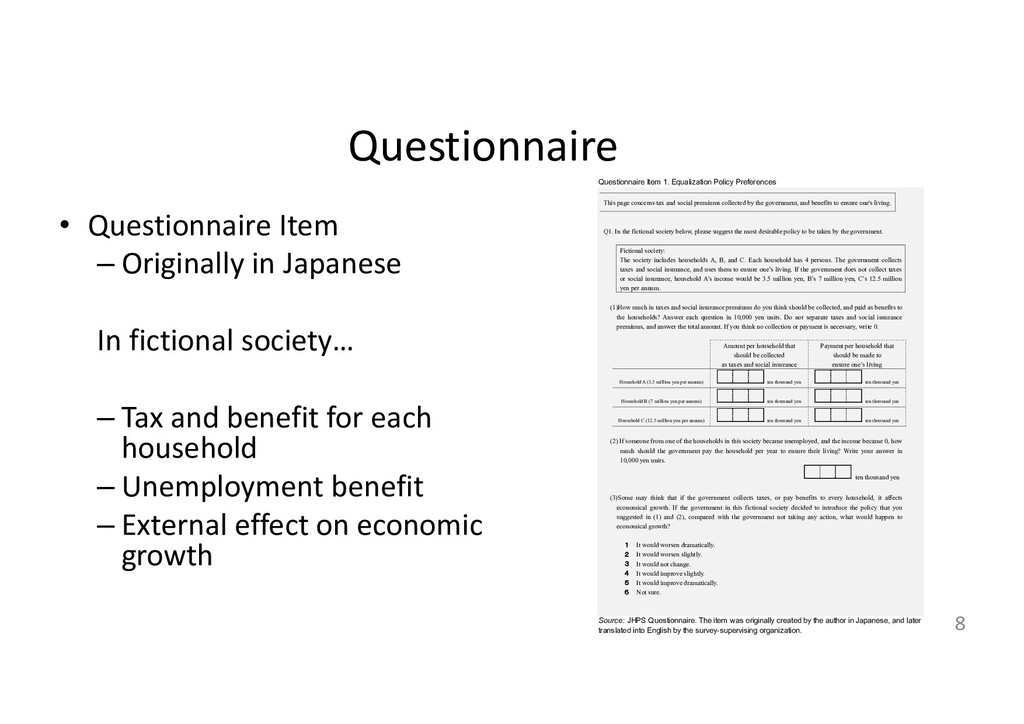
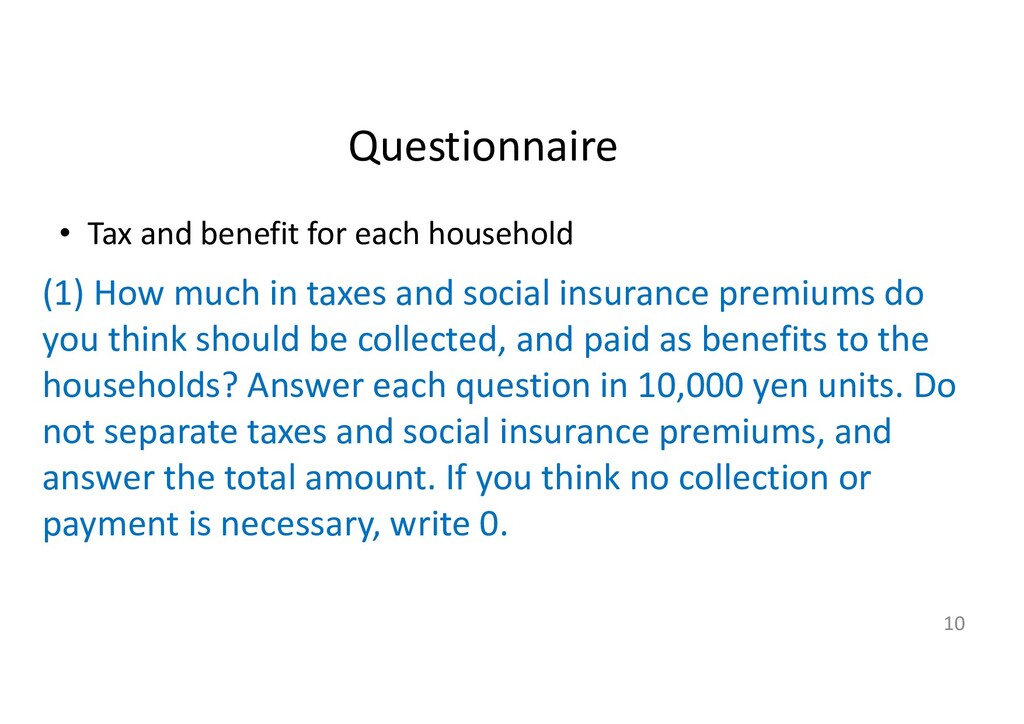
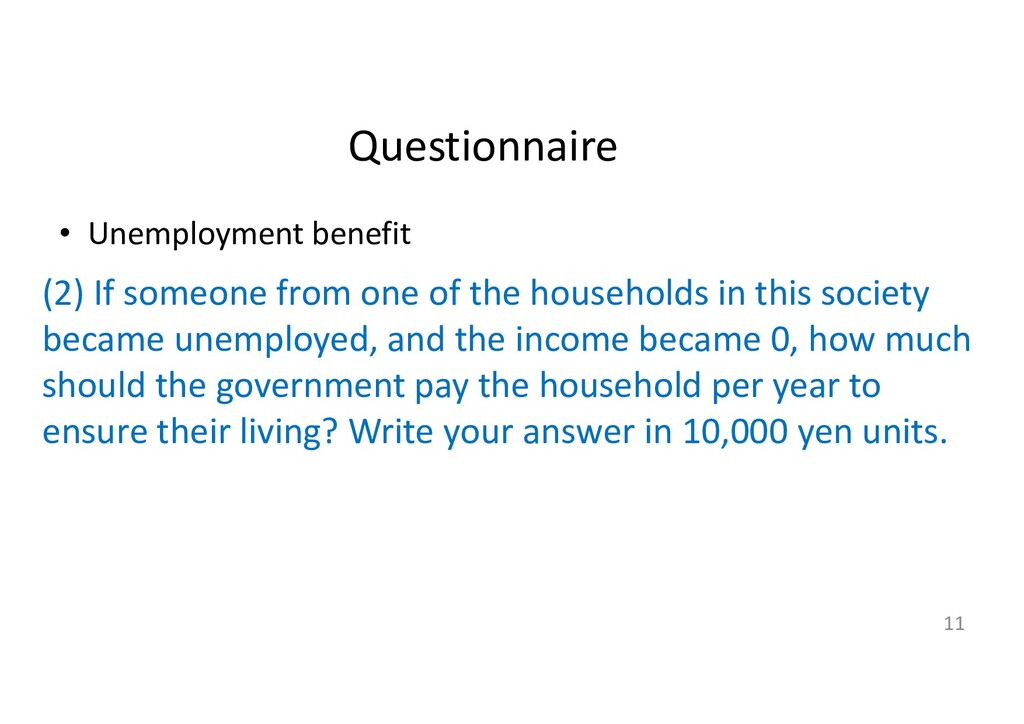
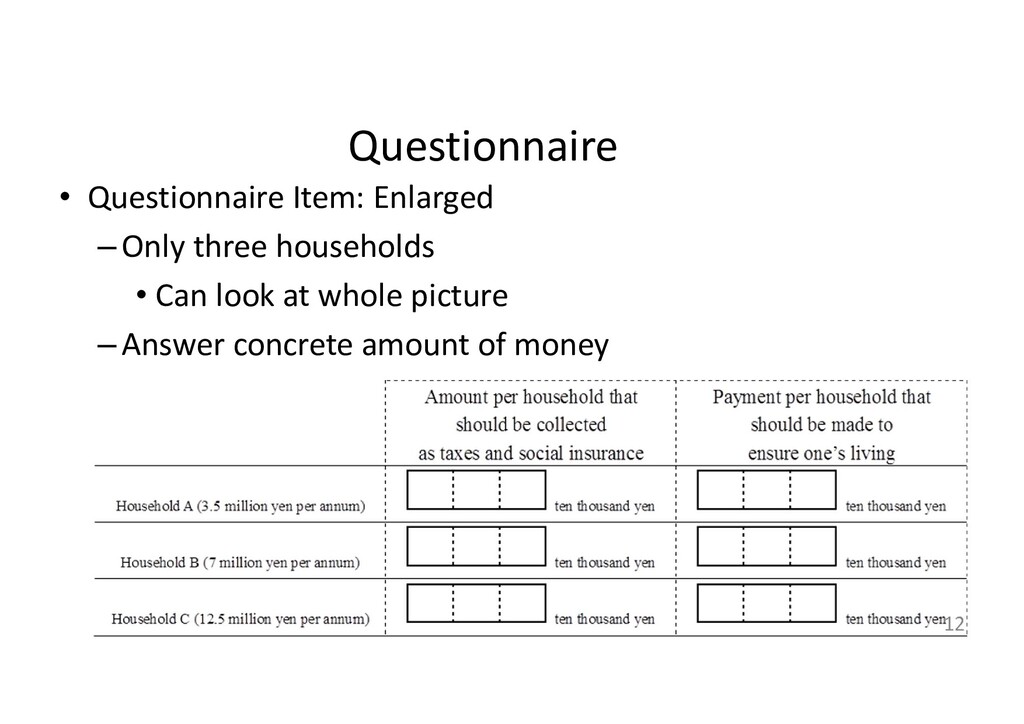
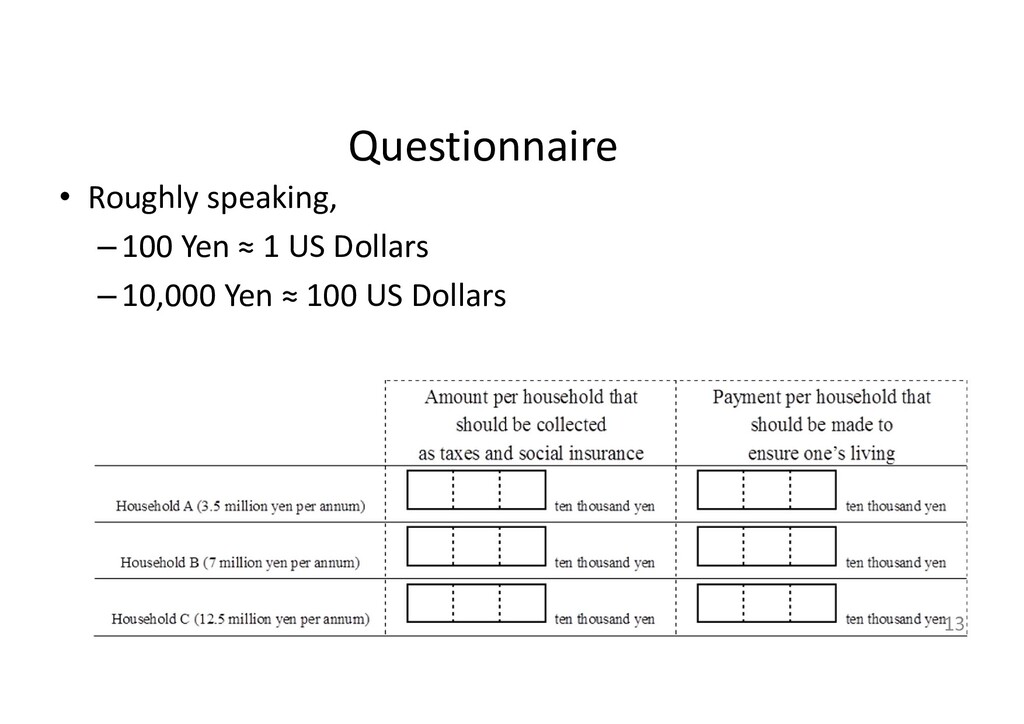
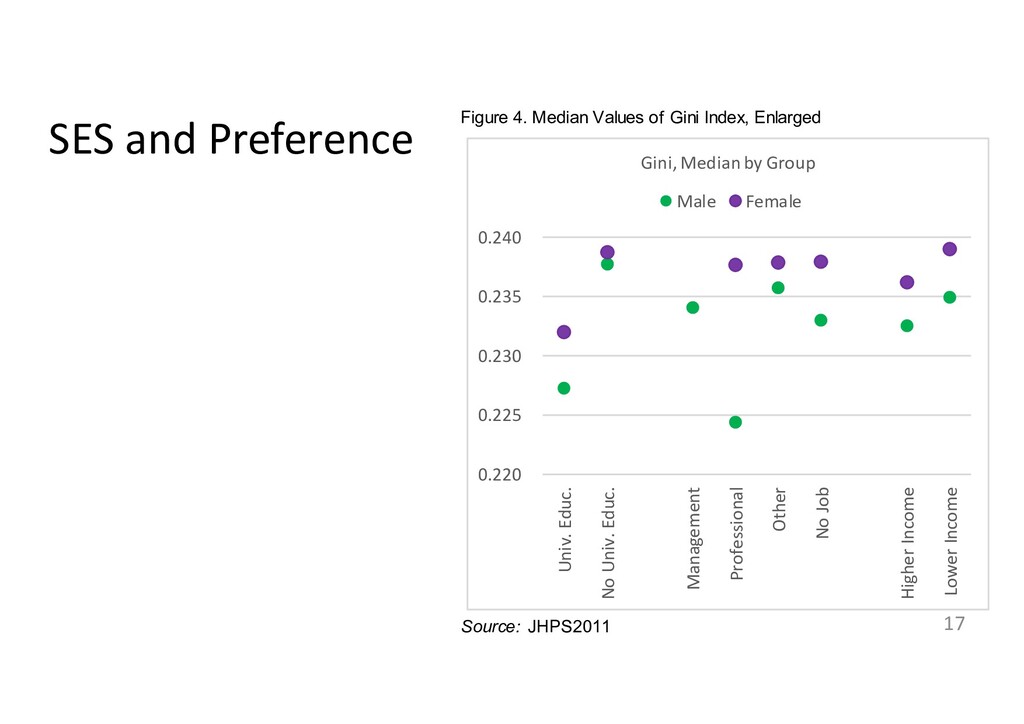
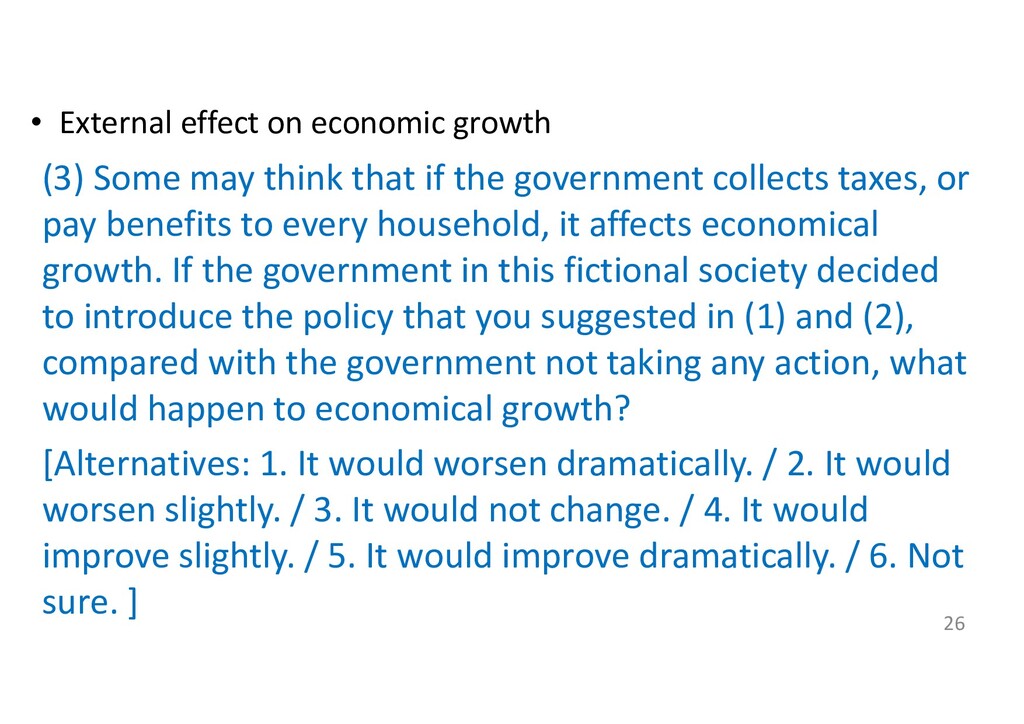
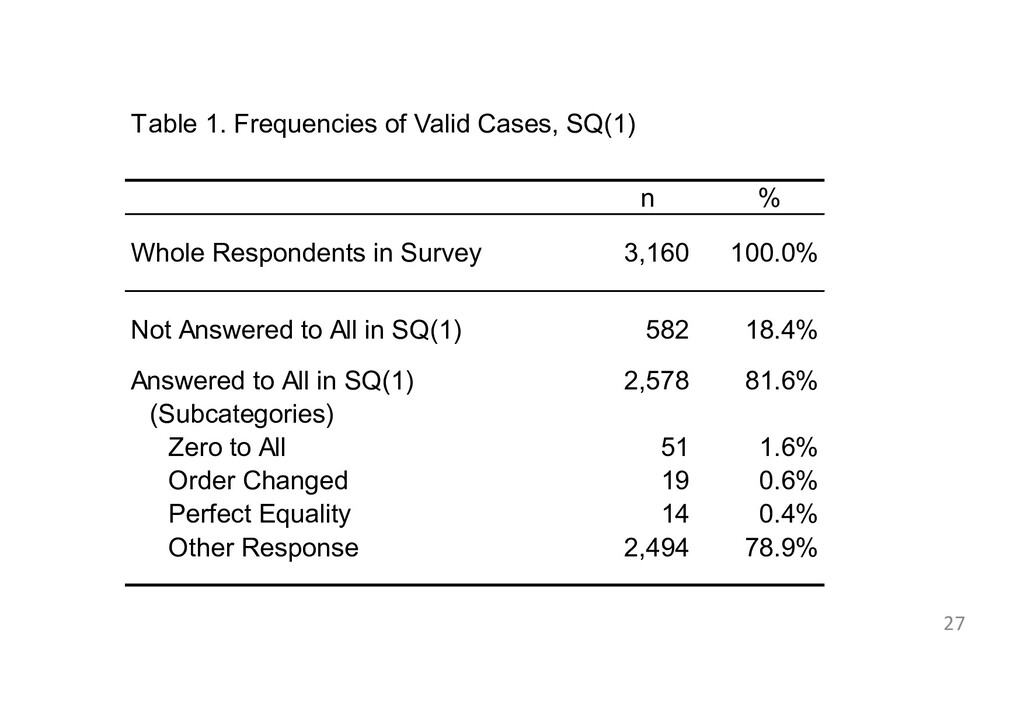
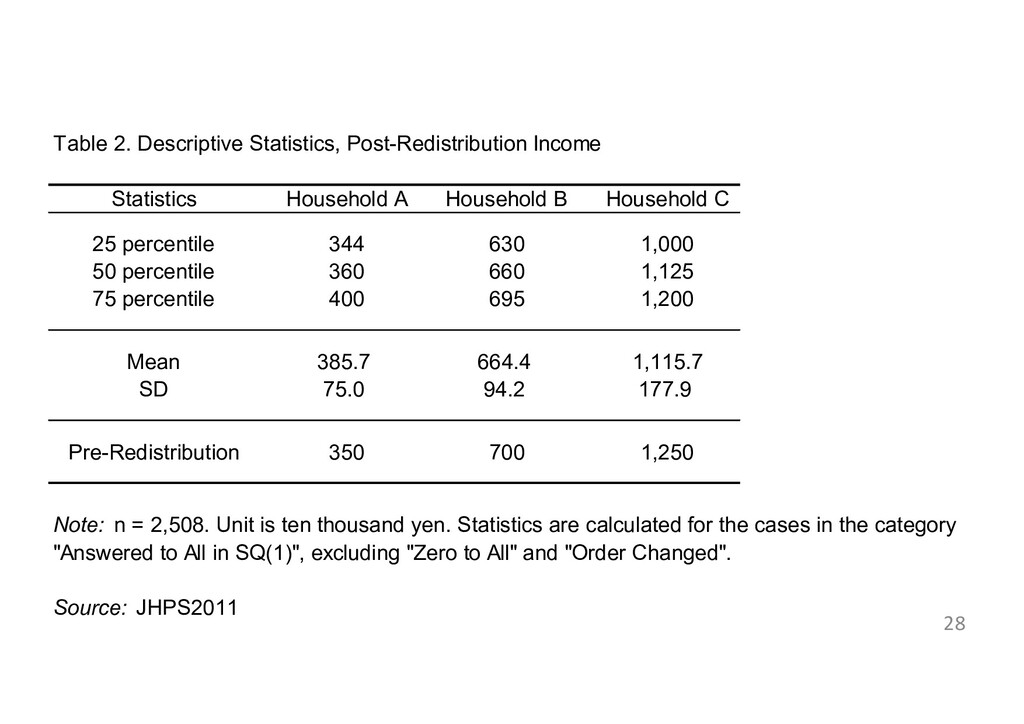
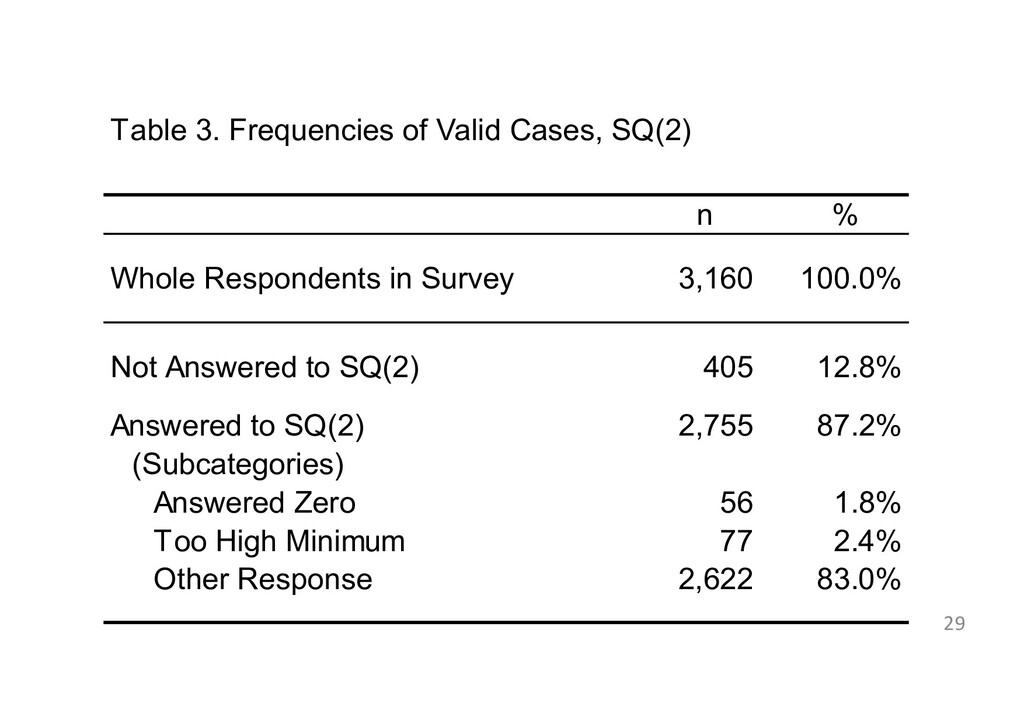
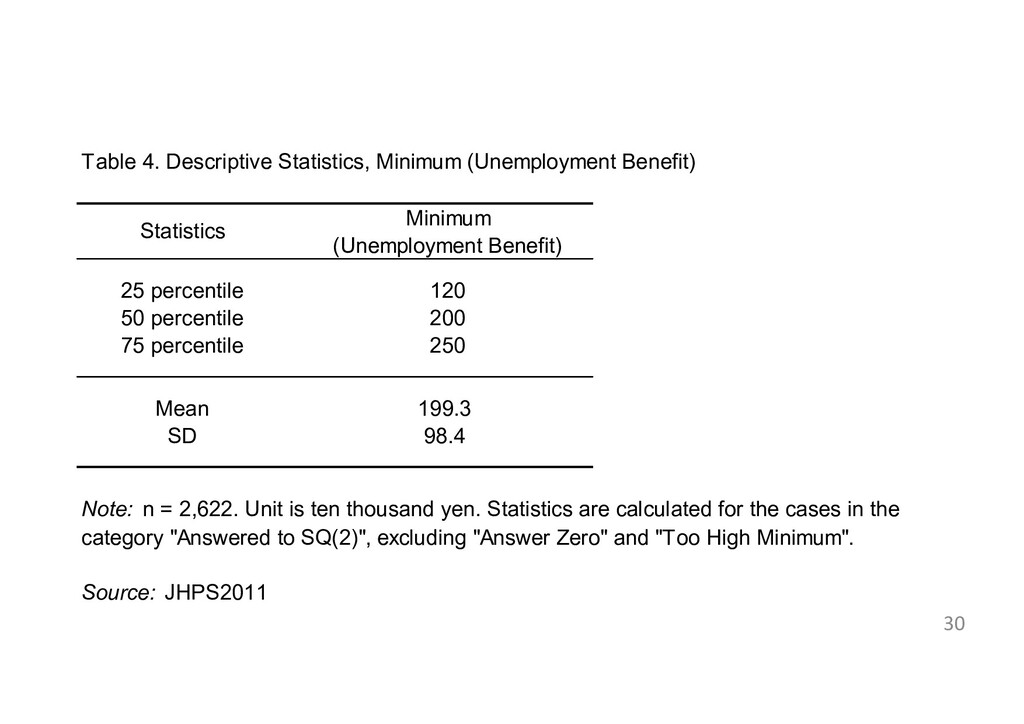
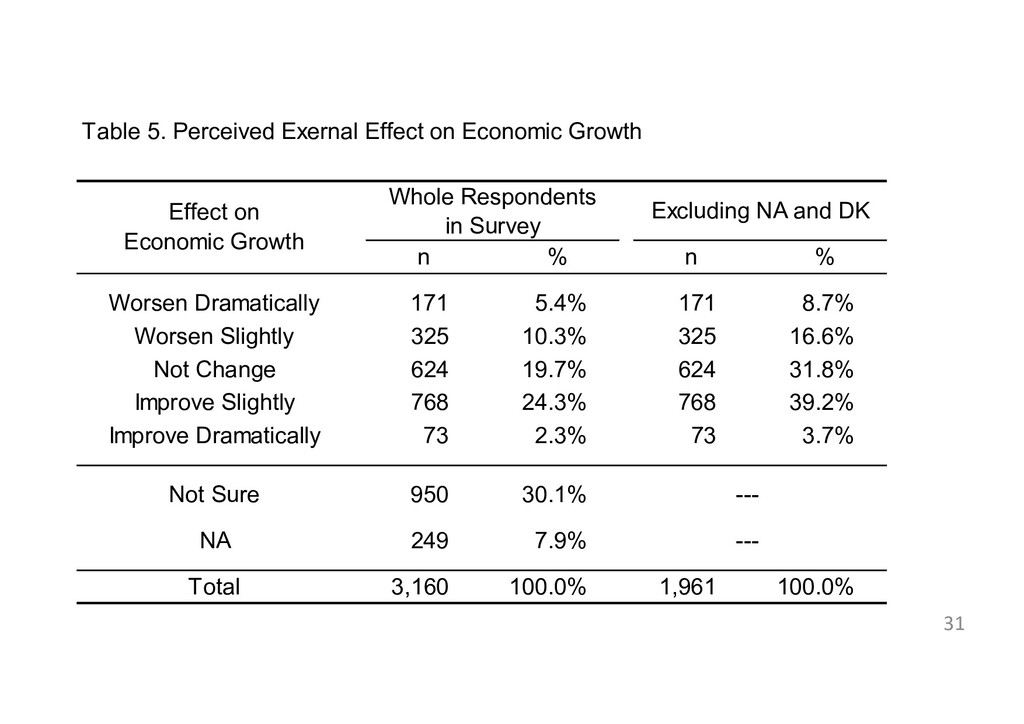
Specifically, we introduce a set of questionnaire items, where respondents answer the desirable concrete amounts of tax and benefit for each household, and also the unemployment benefit, in a fictional society. This battery was adopted in JHPS survey conducted in Japan in 2011 and 2012. Using this, we can know how strong/weak redistribution policy people desire, letting respondents answer looking at the "whole picture" of a society.
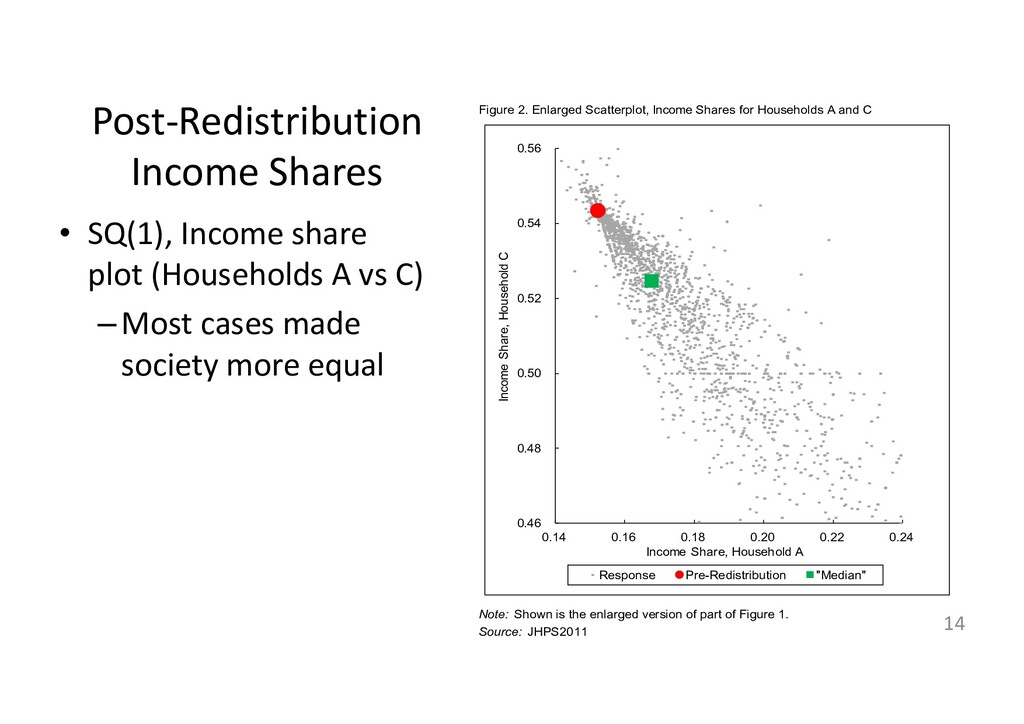
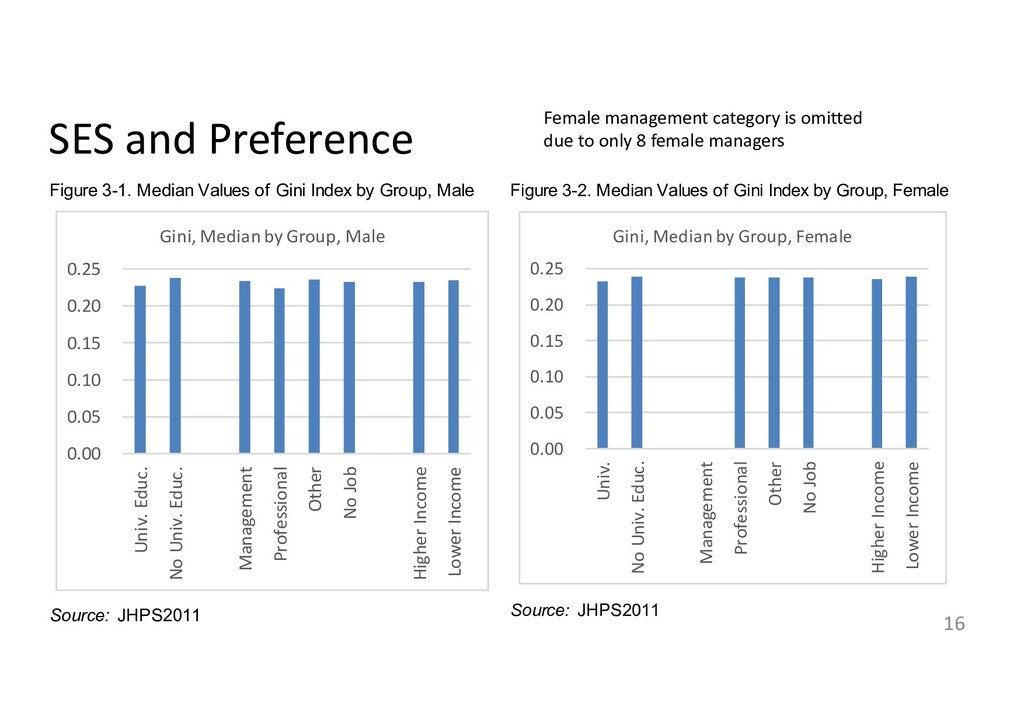
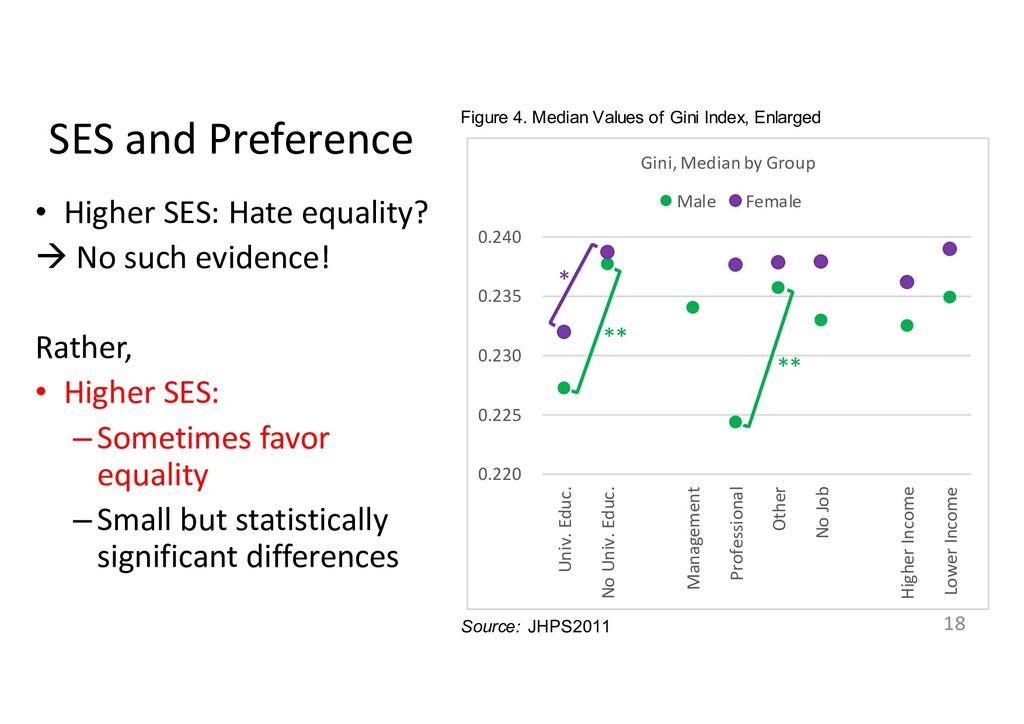
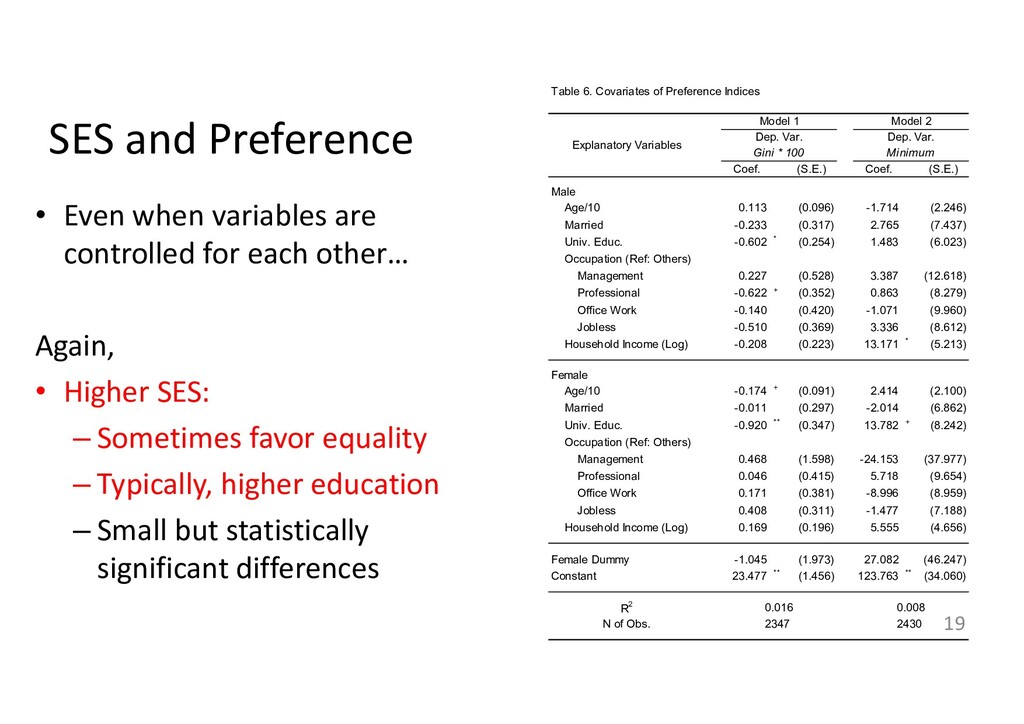
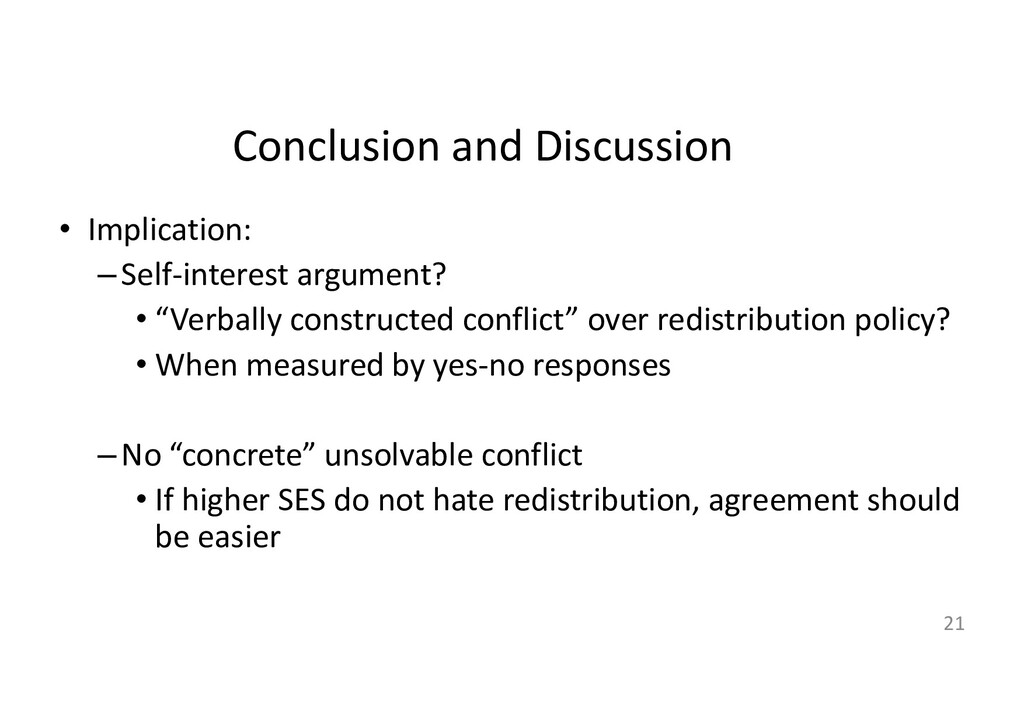
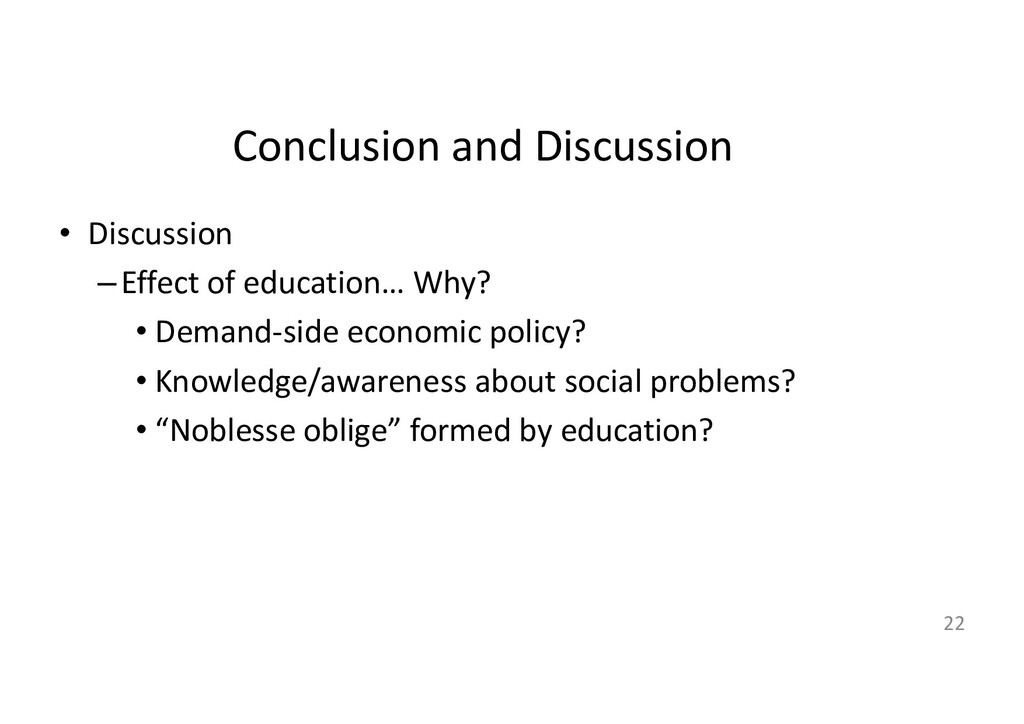
Then we show analysis results from the obtained data. Interestingly, there is no evidence that economically weaker people tend to favour stronger redistribution; on the contrary, we find that the better-educated sometimes tend to prefer stronger redistribution. The results imply the conflict over concrete redistribution levels is not based on economic self-interest.

Koji Yamamoto

November 28, 2019
Tweet

More Decks by Koji Yamamoto

Other Decks in Research

Transcript

  1. Concrete and Whole-Picture Type Indices to Measure Redistributive Preference: Analysing

    Japanese Nationwide Survey Data Koji YAMAMOTO (Hylab LLP and Aichi University) Presentation at TASA Conference, Sydney, Australia, November 28, 2019
  2. Introduction • Background: –How could people come close to agreement,

    instead of conflict, over public policy? • Focus: –Preference for redistribution policy 2
  3. Introduction • Literature: –Self-interest argument • Narrowly-defined self interest –Higher

    SES  Against redistribution –Using natural language based questions – Yes/No response –Often express concern about ambiguity in questions 3
  4. Introduction • What can we improve? –Measurement: • Concrete level

    “How strong redistribution one prefers” Not “How strongly one agrees with redistribution” • Respondents look at “whole picture” of society “Be-the-Government” 4
  5. Introduction • Concrete level –Usually policy implementations involve “levels” –Natural

    language expressions are subject to different interpretations • Whole-picture –Balance between paying and receiving –Not focused only on specific group’s interest 5
  6. Introduction • RQs: –Using the concrete-level and whole-picture type index,

    instead of natural-language based index… –Does socio-economic status correlate with policy preference toward redistribution, and if so, in which direction? 6
  7. Questionnaire • Data –JHPS: Japan’s nationwide panel survey –Use responses

    in 2011 • Item: Looking at the whole picture of “a fictional society”… –Concrete amounts of money for desired redistribution –Perceived external effect on economic growth 7
  8. Questionnaire • Questionnaire Item – Originally in Japanese In fictional

    society… – Tax and benefit for each household – Unemployment benefit – External effect on economic growth 8 Questionnaire Item 1. Equalization Policy Preferences Source: JHPS Questionnaire. The item was originally created by the author in Japanese, and later translated into English by the survey-supervising organization. This page concerns tax and social premiums collected by the government, and benefits to ensure one's living. Q1. In the fictional society below, please suggest the most desirable policy to be taken by the government. Fictional society: The society includes households A, B, and C. Each household has 4 persons. The government collects taxes and social insurance, and uses them to ensure one’s living. If the government does not collect taxes or social insurance, household A’s income would be 3.5 million yen, B’s 7 million yen, C’s 12.5 million yen per annum. (1)How much in taxes and social insurance premiums do you think should be collected, and paid as benefits to the households? Answer each question in 10,000 yen units. Do not separate taxes and social insurance premiums, and answer the total amount. If you think no collection or payment is necessary, write 0. Amount per household that should be collected as taxes and social insurance Payment per household that should be made to ensure one’s living Household A (3.5 million yen per annum) ten thousand yen ten thousand yen Household B (7 million yen per annum) ten thousand yen ten thousand yen Household C (12.5 million yen per annum) ten thousand yen ten thousand yen (2) If someone from one of the households in this society became unemployed, and the income became 0, how much should the government pay the household per year to ensure their living? Write your answer in 10,000 yen units. ten thousand yen (3)Some may think that if the government collects taxes, or pay benefits to every household, it affects economical growth. If the government in this fictional society decided to introduce the policy that you suggested in (1) and (2), compared with the government not taking any action, what would happen to economical growth? 1 It would worsen dramatically. 2 It would worsen slightly. 3 It would not change. 4 It would improve slightly. 5 It would improve dramatically. 6 Not sure.
  9. Questionnaire • Questionnaire Item 9 Fictional society: The society includes

    households A, B, and C. Each household has 4 persons. The government collects taxes and social insurance, and uses them to ensure one’s living. If the government does not collect taxes or social insurance, household A’s income would be 3.5 million yen, B’s 7 million yen, C’s 12.5 million yen per annum.
  10. Questionnaire • Tax and benefit for each household 10 (1)

    How much in taxes and social insurance premiums do you think should be collected, and paid as benefits to the households? Answer each question in 10,000 yen units. Do not separate taxes and social insurance premiums, and answer the total amount. If you think no collection or payment is necessary, write 0.
  11. Questionnaire • Unemployment benefit 11 (2) If someone from one

    of the households in this society became unemployed, and the income became 0, how much should the government pay the household per year to ensure their living? Write your answer in 10,000 yen units.
  12. Questionnaire • Questionnaire Item: Enlarged –Only three households • Can

    look at whole picture –Answer concrete amount of money 12
  13. Post-Redistribution Income Shares • SQ(1), Income share plot (Households A

    vs C) –Most cases made society more equal 14 Figure 2. Enlarged Scatterplot, Income Shares for Households A and C Source: JHPS2011 Note: Shown is the enlarged version of part of Figure 1. 0.46 0.48 0.50 0.52 0.54 0.56 0.14 0.16 0.18 0.20 0.22 0.24 Income Share, Household C Income Share, Household A Response Pre-Redistribution "Median"
  14. Preference Indices • Gini: –Gini coefficient calculated over answered amounts

    of post- redistribution income values for 3 households –Tolerance for inequality • Minimum: –Answered amount of unemployment benefit 15
  15. SES and Preference 16 Figure 3-1. Median Values of Gini

    Index by Group, Male Source: JHPS2011 0.00 0.05 0.10 0.15 0.20 0.25 Univ. Educ. No Univ. Educ. Management Professional Other No Job Higher Income Lower Income Gini, Median by Group, Male Figure 3-2. Median Values of Gini Index by Group, Female Source: JHPS2011 0.00 0.05 0.10 0.15 0.20 0.25 Univ. No Univ. Educ. Management Professional Other No Job Higher Income Lower Income Gini, Median by Group, Female Female management category is omitted due to only 8 female managers
  16. SES and Preference 17 Figure 4. Median Values of Gini

    Index, Enlarged Source: JHPS2011 0.220 0.225 0.230 0.235 0.240 Univ. Educ. No Univ. Educ. Management Professional Other No Job Higher Income Lower Income Gini, Median by Group Male Female
  17. Figure 4. Median Values of Gini Index, Enlarged Source: JHPS2011

    0.220 0.225 0.230 0.235 0.240 Univ. Educ. No Univ. Educ. Management Professional Other No Job Higher Income Lower Income Gini, Median by Group Male Female * ** ** SES and Preference 18 • Higher SES: Hate equality?  No such evidence! Rather, • Higher SES: –Sometimes favor equality –Small but statistically significant differences
  18. SES and Preference 19 • Even when variables are controlled

    for each other… Again, • Higher SES: – Sometimes favor equality – Typically, higher education – Small but statistically significant differences Table 6. Covariates of Preference Indices Coef. (S.E.) Coef. (S.E.) Male Age/10 0.113 (0.096) -1.714 (2.246) Married -0.233 (0.317) 2.765 (7.437) Univ. Educ. -0.602 * (0.254) 1.483 (6.023) Occupation (Ref: Others) Management 0.227 (0.528) 3.387 (12.618) Professional -0.622 + (0.352) 0.863 (8.279) Office Work -0.140 (0.420) -1.071 (9.960) Jobless -0.510 (0.369) 3.336 (8.612) Household Income (Log) -0.208 (0.223) 13.171 * (5.213) Female Age/10 -0.174 + (0.091) 2.414 (2.100) Married -0.011 (0.297) -2.014 (6.862) Univ. Educ. -0.920 ** (0.347) 13.782 + (8.242) Occupation (Ref: Others) Management 0.468 (1.598) -24.153 (37.977) Professional 0.046 (0.415) 5.718 (9.654) Office Work 0.171 (0.381) -8.996 (8.959) Jobless 0.408 (0.311) -1.477 (7.188) Household Income (Log) 0.169 (0.196) 5.555 (4.656) Female Dummy -1.045 (1.973) 27.082 (46.247) Constant 23.477 ** (1.456) 123.763 ** (34.060) N of Obs. 2347 2430 Minimum R2 0.016 0.008 Explanatory Variables Model 1 Model 2 Dep. Var. Dep. Var. Gini * 100
  19. Conclusion and Discussion • Answers to RQ: –People with higher

    SES never prefer less redistribution (!) –People with higher education prefer stronger redistribution • Use of concrete-level and whole-picture type index –Greatly different from natural-language based index 20
  20. Conclusion and Discussion • Implication: –Self-interest argument? • “Verbally constructed

    conflict” over redistribution policy? • When measured by yes-no responses –No “concrete” unsolvable conflict • If higher SES do not hate redistribution, agreement should be easier 21
  21. Conclusion and Discussion • Discussion –Effect of education… Why? •

    Demand-side economic policy? • Knowledge/awareness about social problems? • “Noblesse oblige” formed by education? 22
  22. References • Alesina, Alberto, and Paola Giuliano. 2011. “Preference for

    Redistribution.” Jess Benhabib, Alberto Bisin, and Matthew O. Jackson, eds. Handbook of Social Economics Volume 1A. North Holland: 93-131. • Blekesaune, Morten, and Jill Quadagno. 2003. “Public Attitudes toward Welfare State Policies: A Comparative Analysis of 24 Nations.” European Sociological Review 19 (5): 415-427. • Dallinger, Ursula. 2010. “Public Support for Redistribution: What Explains Cross-national Differences?” Journal of European Social Policy 20 (4): 333-349. • Giger, Nathalie, and Moira Nelson. 2013. “The Welfare State or the Economy? Preferences, Constituencies, and Strategies for Retrenchment.” European Sociological Review 29 (5): 1083-1094. • Huber, Gregory A., and Celia Paris. 2013. “Assessing the Programmatic Equivalence Assumption in Question Wording Experiments: Understanding Why Americans Like Assistance to the Poor More Than Welfare.” Public Opinion Quarterly 77 (1): 385- 397. • Kuziemko, Ilyana, Michael I. Norton, Emmanuel Saez, and Stefanie Stantcheva. 2015. “How Elastic Are Preferences for Redistribution? Evidence from Randomized Survey Experiments.” American Economic Review 105 (4): 1478–1508. • Lara, Bernardo, and Kenneth Shores. 2017. “Identifying Preferences for Equal Educational Opportunity, Income, and Income Equality.” Available at SSRN: https://ssrn.com/abstract=2996575. • Miyauchi, Tamaki. 2013. “Measuring Japanese Constituency Preferences for Income Redistribution Policy and Effects by the Great Earthquake of Eastern Japan in 2011.” Joint Research Center for Panel Studies Discussion Paper Series DP-2012-007. • Ohtake, Fumio, and Jun Tomioka. 2004. “Who Supports Redistribution?” The Japanese Economic Review 55 (4): 333-354. • Svallfors, Stefan. 1997. “Worlds of Welfare and Attitudes to Redistribution: A Comparison of Eight Western Nations.” European Sociological Review 13 (3): 283-304. • Takegawa, Shogo. 2010. “Liberal Preferences and Conservative Policies: The Puzzling Size of Japan’s Welfare State.” Social Science Japan Journal 13 (1): 53-67. • Yamamoto, Koji, and Ryotaro Fukahori. 2011. “Methods to Measure and Model Attitude toward Equalization: Searching for Democratically Justifiable Criteria for Policy Evaluation” (in Japanese). Joint Research Center for Panel Studies Discussion Paper Series DP2011-001. 23
  23. Thank you for your warm attention! Comments are welcome!! E-mail:

    [email protected] 24 Acknowledgement This study has been supported by JSPS KAKENHI Grant Numbers JP18H00033, JP16H00287, JP11J06528, and JP18830018. The data for this analysis, Japan Household Panel Survey (JHPS/KHPS), was provided by the Keio University Panel Data Research Center.
  24. (3) Some may think that if the government collects taxes,

    or pay benefits to every household, it affects economical growth. If the government in this fictional society decided to introduce the policy that you suggested in (1) and (2), compared with the government not taking any action, what would happen to economical growth? [Alternatives: 1. It would worsen dramatically. / 2. It would worsen slightly. / 3. It would not change. / 4. It would improve slightly. / 5. It would improve dramatically. / 6. Not sure. ] 26 • External effect on economic growth
  25. 27 Table 1. Frequencies of Valid Cases, SQ(1) n %

    Whole Respondents in Survey 3,160 100.0% Not Answered to All in SQ(1) 582 18.4% Answered to All in SQ(1) 2,578 81.6% (Subcategories) Zero to All 51 1.6% Order Changed 19 0.6% Perfect Equality 14 0.4% Other Response 2,494 78.9%
  26. 28 Table 2. Descriptive Statistics, Post-Redistribution Income Statistics Household A

    Household B Household C 25 percentile 344 630 1,000 50 percentile 360 660 1,125 75 percentile 400 695 1,200 Mean 385.7 664.4 1,115.7 SD 75.0 94.2 177.9 Pre-Redistribution 350 700 1,250 Source: JHPS2011 Note: n = 2,508. Unit is ten thousand yen. Statistics are calculated for the cases in the category "Answered to All in SQ(1)", excluding "Zero to All" and "Order Changed".
  27. 29 Table 3. Frequencies of Valid Cases, SQ(2) n %

    Whole Respondents in Survey 3,160 100.0% Not Answered to SQ(2) 405 12.8% Answered to SQ(2) 2,755 87.2% (Subcategories) Answered Zero 56 1.8% Too High Minimum 77 2.4% Other Response 2,622 83.0%
  28. 30 Table 4. Descriptive Statistics, Minimum (Unemployment Benefit) Statistics Minimum

    (Unemployment Benefit) 25 percentile 120 50 percentile 200 75 percentile 250 Mean 199.3 SD 98.4 Source: JHPS2011 Note: n = 2,622. Unit is ten thousand yen. Statistics are calculated for the cases in the category "Answered to SQ(2)", excluding "Answer Zero" and "Too High Minimum".
  29. 31 Table 5. Perceived Exernal Effect on Economic Growth Worsen

    Dramatically 171 5.4% 171 8.7% Worsen Slightly 325 10.3% 325 16.6% Not Change 624 19.7% 624 31.8% Improve Slightly 768 24.3% 768 39.2% Improve Dramatically 73 2.3% 73 3.7% Not Sure 950 30.1% NA 249 7.9% Total 3,160 100.0% 1,961 100.0% --- --- Effect on Economic Growth Whole Respondents in Survey Excluding NA and DK n % n %