Search for Collective Preference on Statuses of Society: Aggregating Individual Evaluations based on Equality and Economic Growth
Presentation at the Third Conference of International Consortium for Social Well‐Being Studies, held at Plataran Hotel & Convention Center, Magelang, Indonesia, March 4, 2018
Evaluations based on Equality and Economic Growth Koji YAMAMOTO (Hylab LLP) Presentation at the Third Conference of International Consortium for Social Well‐Being Studies, held at Plataran Hotel & Convention Center, Magelang, Indonesia, March 4, 2018
whole society? • The popular methods to do so are: – (i) To utilize objective indices about a society, such as indices for economic production and equality (e.g. GDP, GNI, Gini) – (ii) To utilize simple aggregated values of subjective evaluations by individuals, who live in the society, of themselves, such as the percentage of those who feel happy • Possible Drawbacks – Method (i) can be criticized for not considering how ordinary people feel. – Method (ii) may also be criticized because there can be people who tend to feel satisfied even in very difficult life situations, and such people can more likely be ignored by policy makers, if they only base their policy on simple subjective indices. 3
an alternative method to measure the well‐being of a society. • The proposed method – Based on objective information about the society. – Conducted in a democratically more legitimate way, considering how ordinary people think. This avoids dogmatic judgments by an only limited number of observers, for example, researchers or policy makers. 4
(1) Estimating Individual Evaluation Function • Based on real data • We estimate the individual evaluation criteria with which each of ordinary people evaluates a society • Obtain the criteria with which an individual "subjectively" evaluates a society using "objective" information. – (2) Aggregating IEF into Collective Preference Order • Aggregate the individual evaluations into a collective preference order with respect to multiple statuses of a society • Conducted with a particular rule, i.e. in a transparent and well‐defined way. In this sense, this aggregation is "objectively" done. 5
of questionnaire items. • We show the results of sample analyses about evaluation based on economic growth and equality. • Related: Better Life Index (BLI) – The website of BLI offers an interactive interface for users to set weights on respective measurements of countries to obtain an overall ranking of countries. – BLI very clearly and explicitly assumes that the individual evaluation criteria on statuses of a society vary among different people. – Conceptually speaking, this idea is similar to that of our present study. • In addition to this idea, we shall also present the attempt to aggregate such various individual evaluations. 6
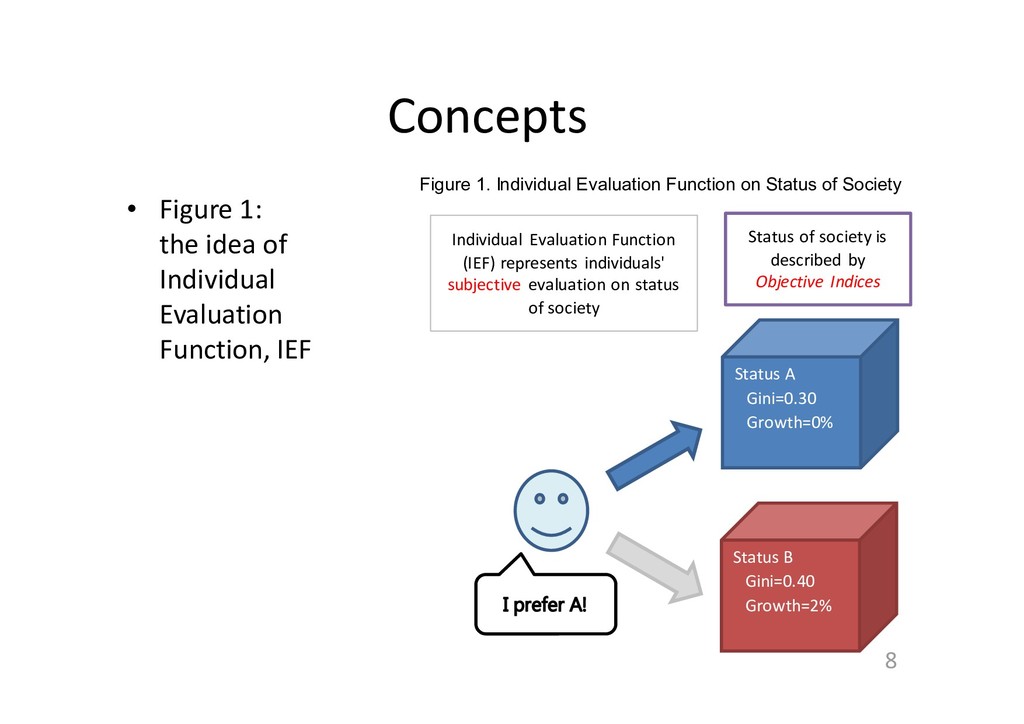
IEF 8 Figure 1. Individual Evaluation Function on Status of Society Status A Gini=0.30 Growth=0% Status B Gini=0.40 Growth=2% Individual Evaluation Function (IEF) represents individuals' subjective evaluation on status of society Status of society is described by Objective Indices
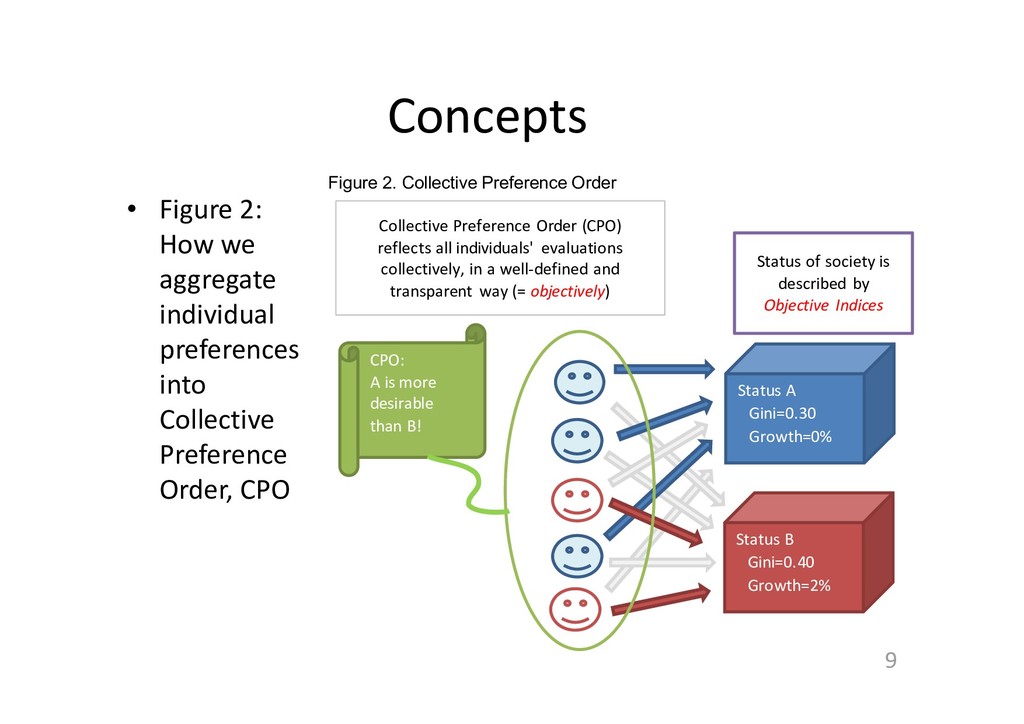
Collective Preference Order, CPO 9 Figure 2. Collective Preference Order Status A Gini=0.30 Growth=0% Status B Gini=0.40 Growth=2% Collective Preference Order (CPO) reflects all individuals' evaluations collectively, in a well‐defined and transparent way (= objectively) CPO: A is more desirable than B! Status of society is described by Objective Indices
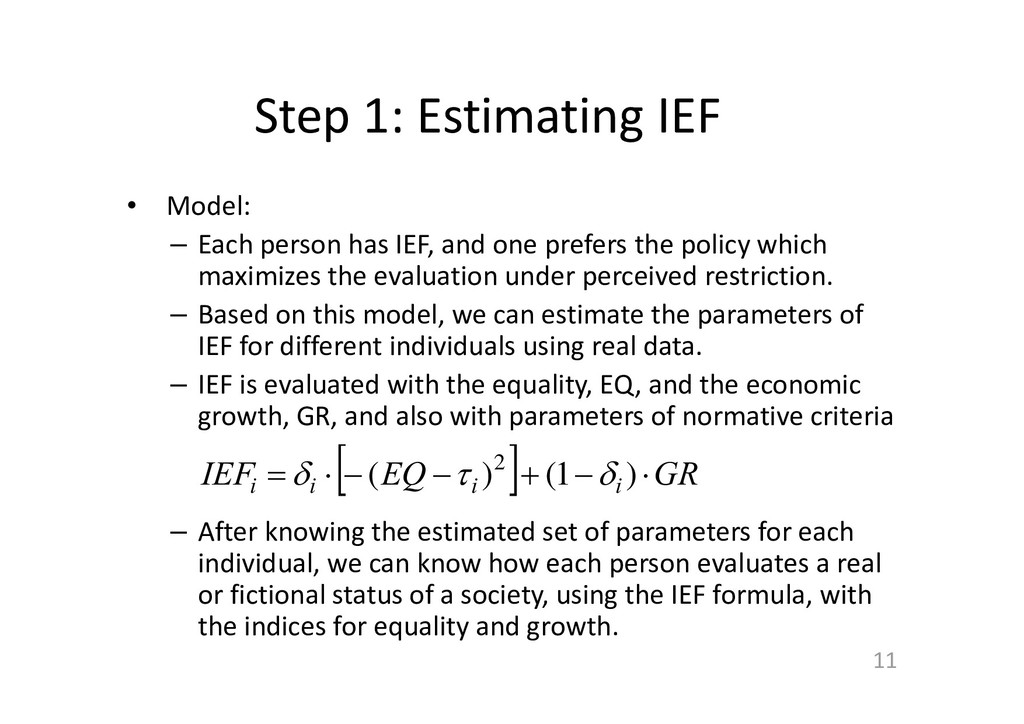
IEF, and one prefers the policy which maximizes the evaluation under perceived restriction. – Based on this model, we can estimate the parameters of IEF for different individuals using real data. – IEF is evaluated with the equality, EQ, and the economic growth, GR, and also with parameters of normative criteria – After knowing the estimated set of parameters for each individual, we can know how each person evaluates a real or fictional status of a society, using the IEF formula, with the indices for equality and growth. 11 GR EQ IEF i i i i ) 1 ( ) ( 2
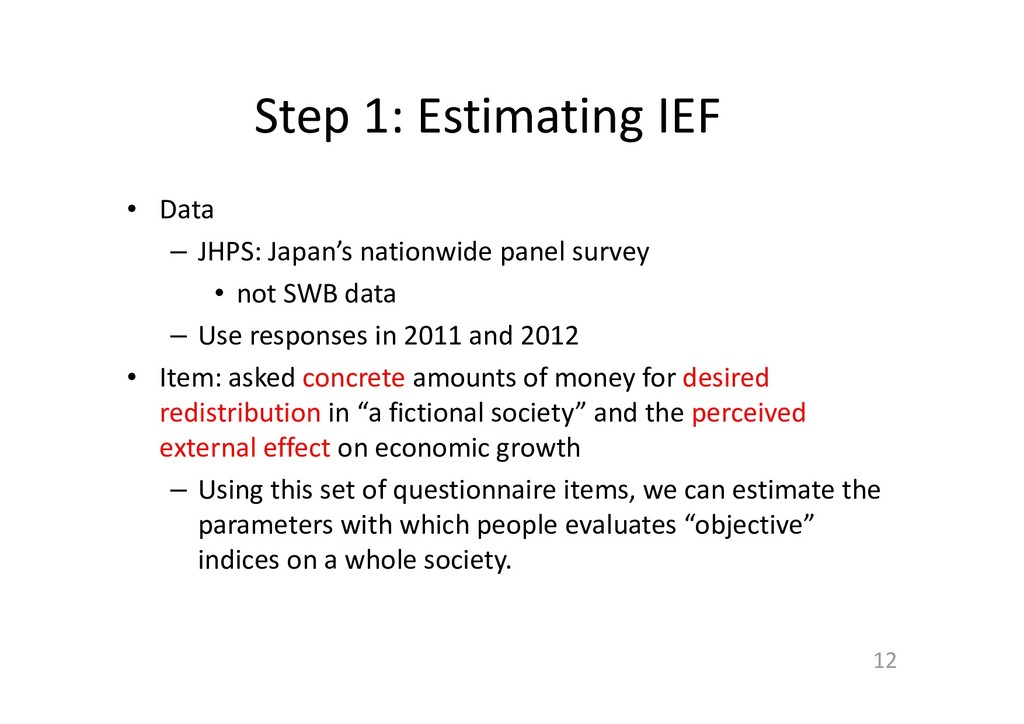
panel survey • not SWB data – Use responses in 2011 and 2012 • Item: asked concrete amounts of money for desired redistribution in “a fictional society” and the perceived external effect on economic growth – Using this set of questionnaire items, we can estimate the parameters with which people evaluates “objective” indices on a whole society. 12
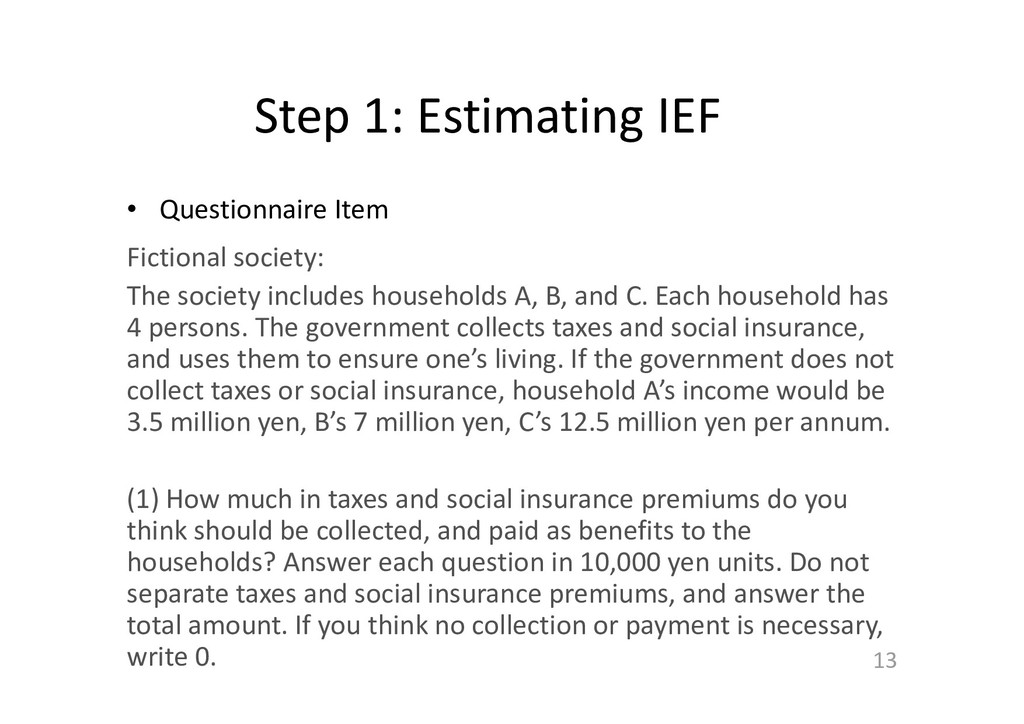
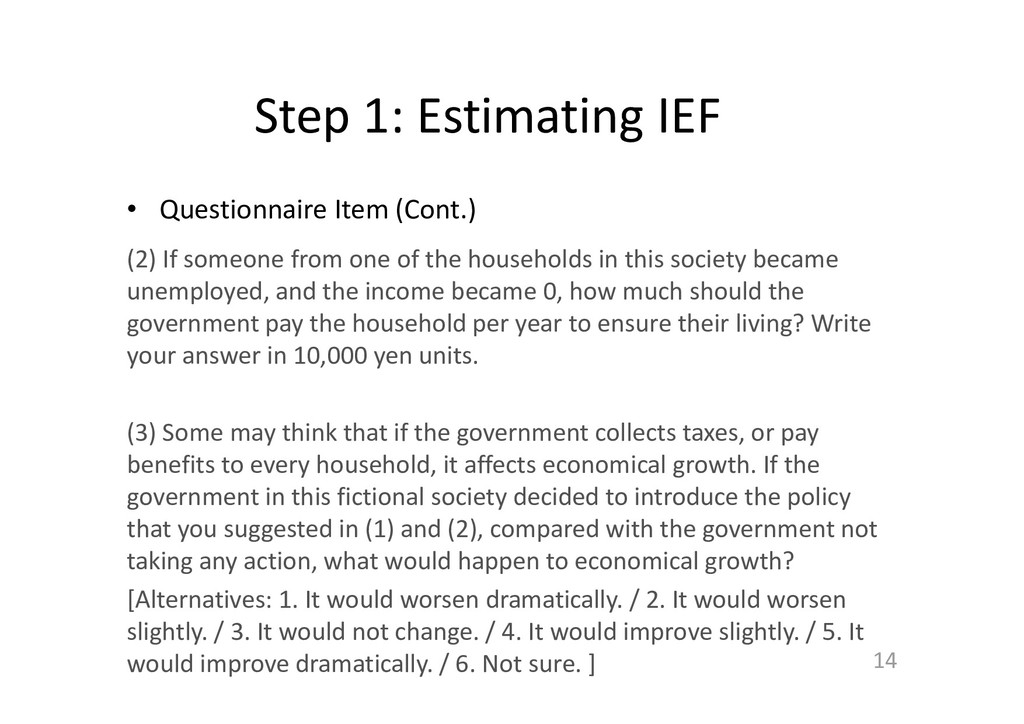
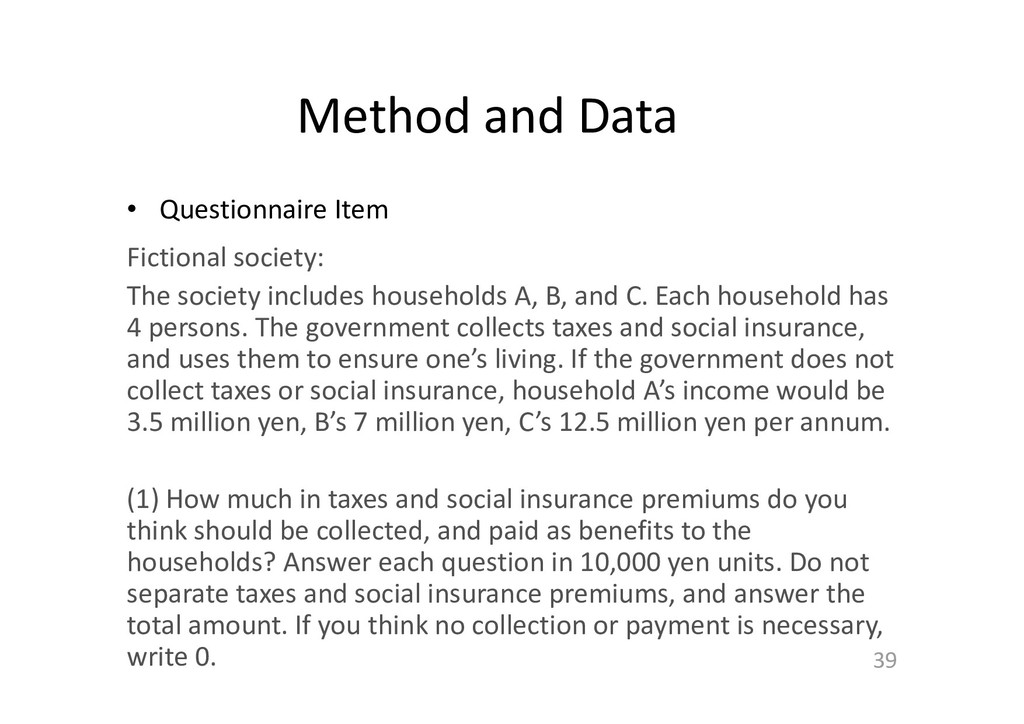
The society includes households A, B, and C. Each household has 4 persons. The government collects taxes and social insurance, and uses them to ensure one’s living. If the government does not collect taxes or social insurance, household A’s income would be 3.5 million yen, B’s 7 million yen, C’s 12.5 million yen per annum. (1) How much in taxes and social insurance premiums do you think should be collected, and paid as benefits to the households? Answer each question in 10,000 yen units. Do not separate taxes and social insurance premiums, and answer the total amount. If you think no collection or payment is necessary, write 0.
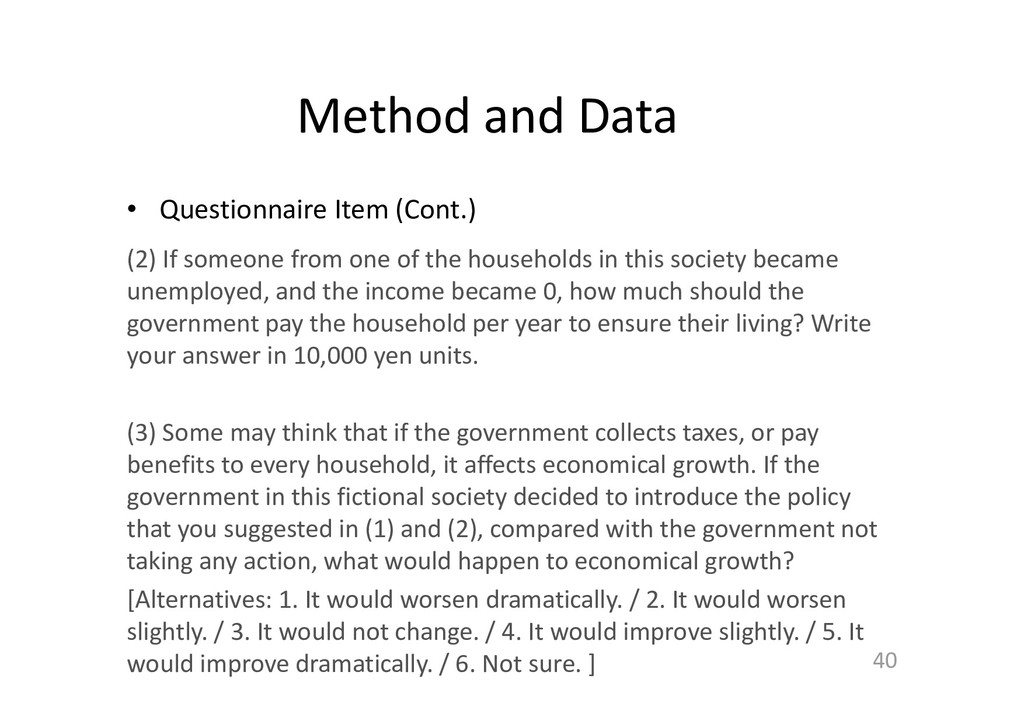
If someone from one of the households in this society became unemployed, and the income became 0, how much should the government pay the household per year to ensure their living? Write your answer in 10,000 yen units. (3) Some may think that if the government collects taxes, or pay benefits to every household, it affects economical growth. If the government in this fictional society decided to introduce the policy that you suggested in (1) and (2), compared with the government not taking any action, what would happen to economical growth? [Alternatives: 1. It would worsen dramatically. / 2. It would worsen slightly. / 3. It would not change. / 4. It would improve slightly. / 5. It would improve dramatically. / 6. Not sure. ]
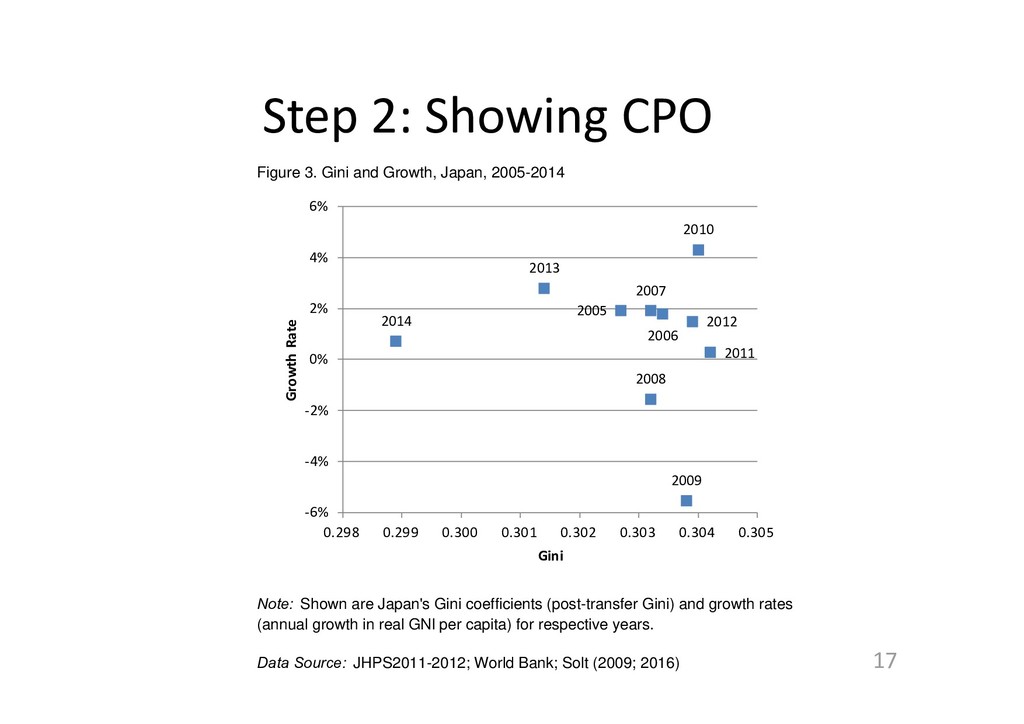
the statuses of the society? – Figure 3: Japan’s real status of each of ten years, from 2005 to 2014 • Real Gini coefficients of disposable income • GNI growth rates 16
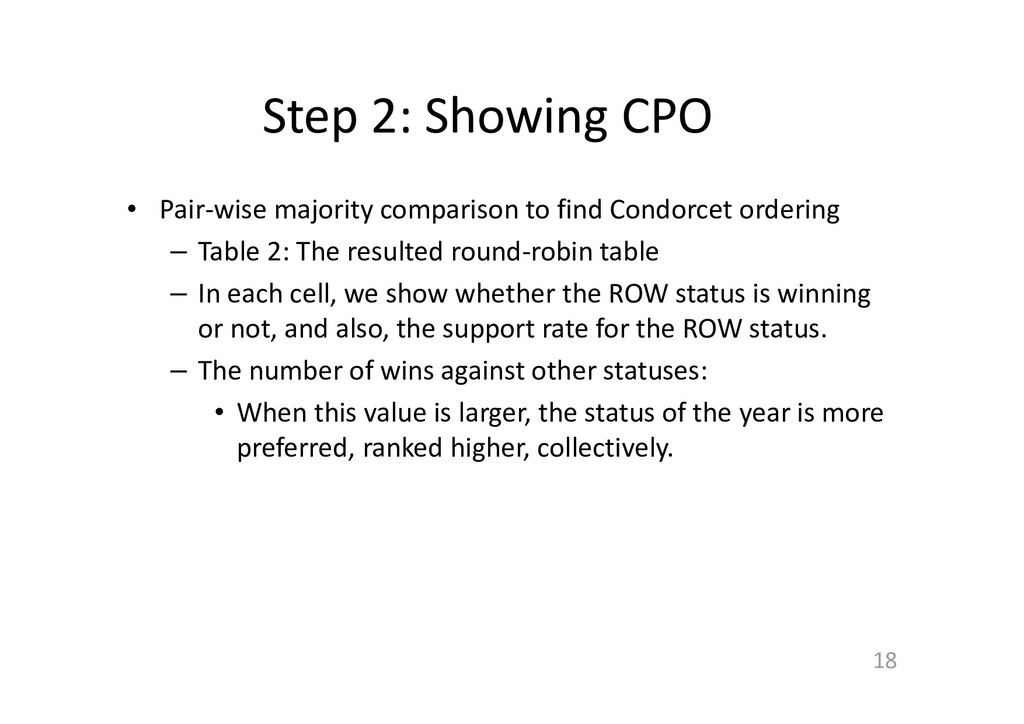
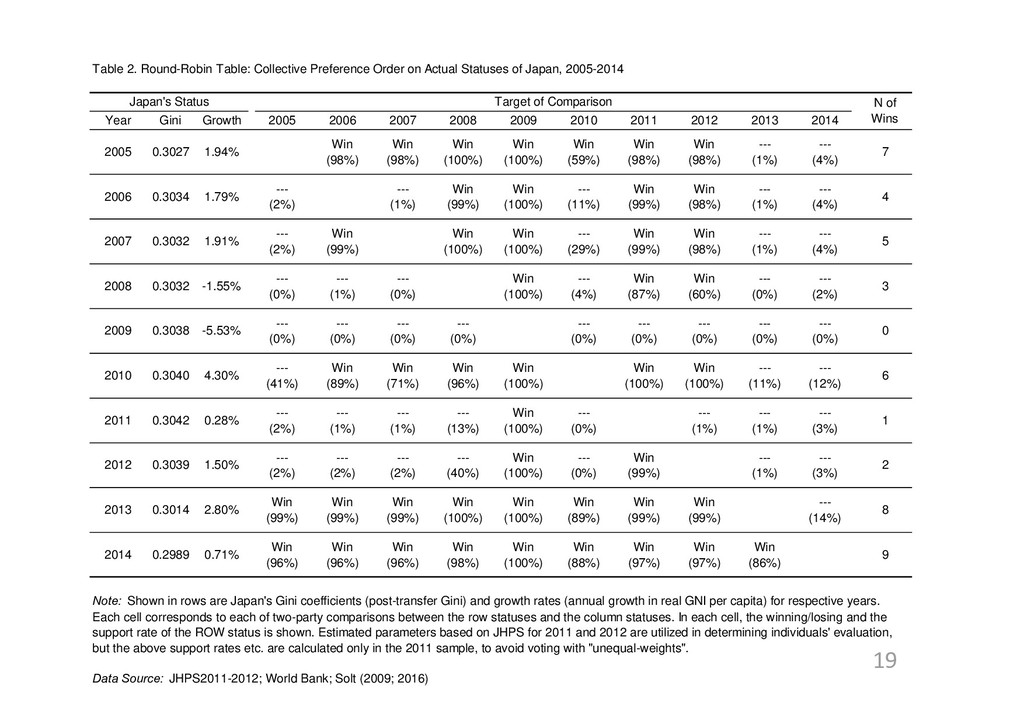
Condorcet ordering – Table 2: The resulted round‐robin table – In each cell, we show whether the ROW status is winning or not, and also, the support rate for the ROW status. – The number of wins against other statuses: • When this value is larger, the status of the year is more preferred, ranked higher, collectively. 18
rank value for each year in the square brackets. For example, [R1] stands for the year is ranked at No. 1. • Generally speaking, smaller Gini tends to be preferred collectively. 20
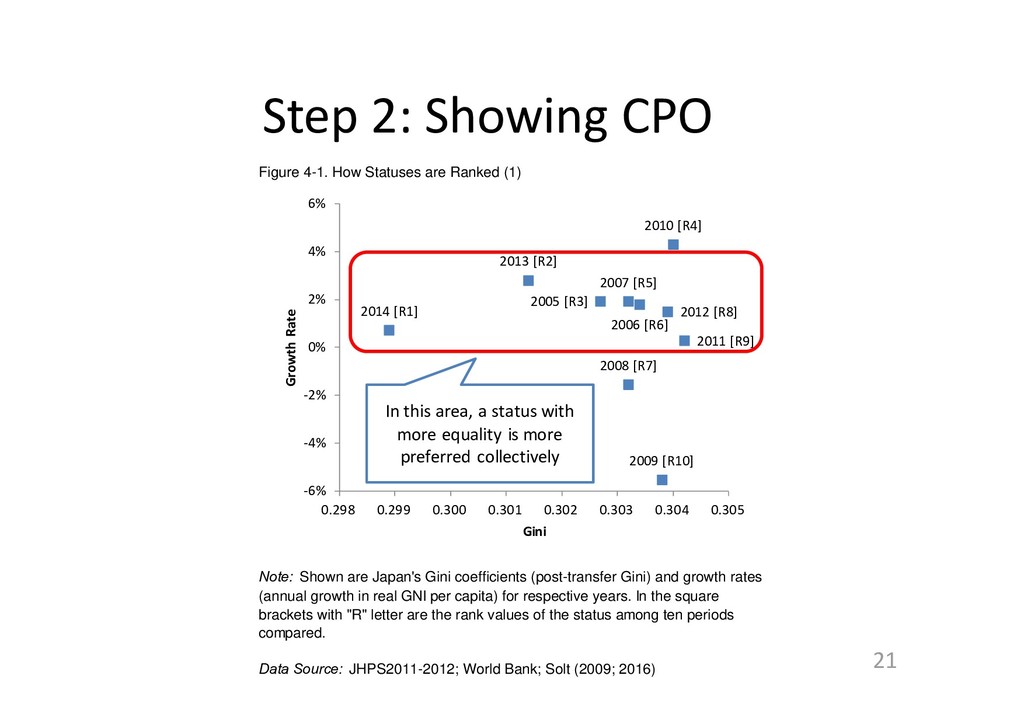
Ranked (1) Data Source: JHPS2011-2012; World Bank; Solt (2009; 2016) Note: Shown are Japan's Gini coefficients (post-transfer Gini) and growth rates (annual growth in real GNI per capita) for respective years. In the square brackets with "R" letter are the rank values of the status among ten periods compared. 2005 [R3] 2006 [R6] 2007 [R5] 2008 [R7] 2009 [R10] 2010 [R4] 2011 [R9] 2012 [R8] 2013 [R2] 2014 [R1] ‐6% ‐4% ‐2% 0% 2% 4% 6% 0.298 0.299 0.300 0.301 0.302 0.303 0.304 0.305 Growth Rate Gini In this area, a status with more equality is more preferred collectively
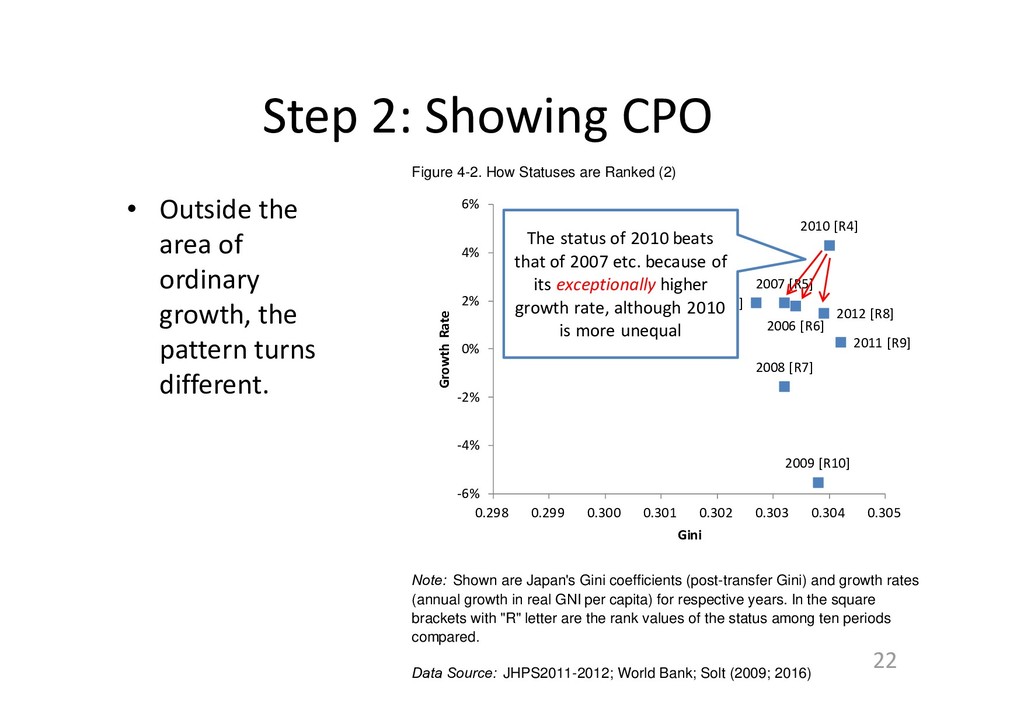
growth, the pattern turns different. 22 Figure 4-2. How Statuses are Ranked (2) Data Source: JHPS2011-2012; World Bank; Solt (2009; 2016) Note: Shown are Japan's Gini coefficients (post-transfer Gini) and growth rates (annual growth in real GNI per capita) for respective years. In the square brackets with "R" letter are the rank values of the status among ten periods compared. 2005 [R3] 2006 [R6] 2007 [R5] 2008 [R7] 2009 [R10] 2010 [R4] 2011 [R9] 2012 [R8] 2013 [R2] 2014 [R1] ‐6% ‐4% ‐2% 0% 2% 4% 6% 0.298 0.299 0.300 0.301 0.302 0.303 0.304 0.305 Growth Rate Gini The status of 2010 beats that of 2007 etc. because of its exceptionally higher growth rate, although 2010 is more unequal
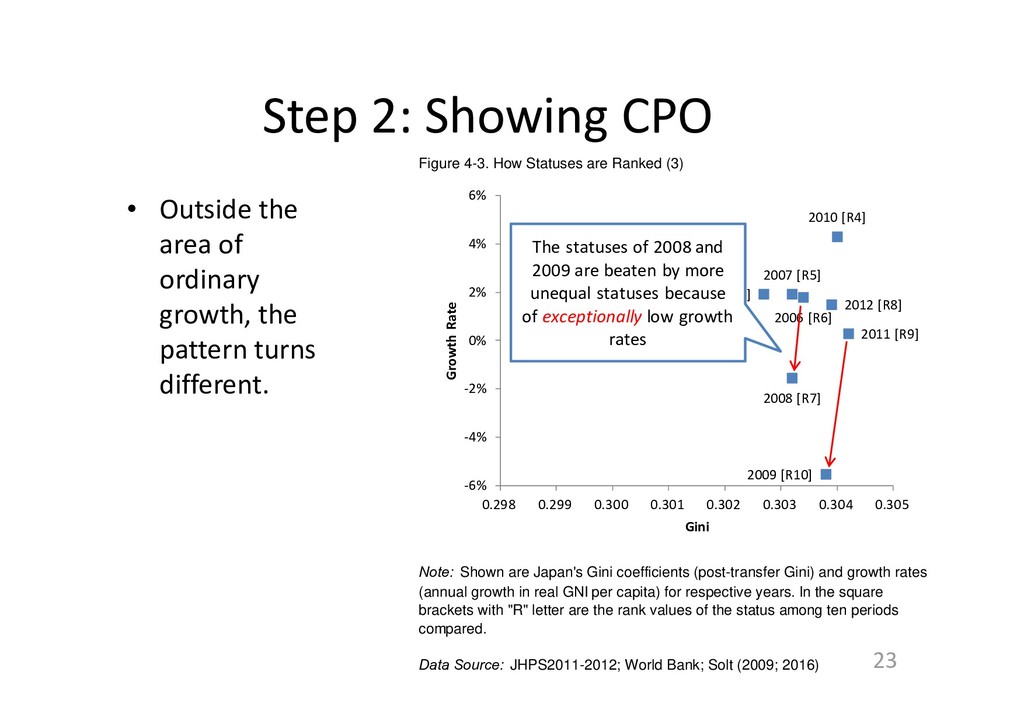
growth, the pattern turns different. 23 Figure 4-3. How Statuses are Ranked (3) Data Source: JHPS2011-2012; World Bank; Solt (2009; 2016) Note: Shown are Japan's Gini coefficients (post-transfer Gini) and growth rates (annual growth in real GNI per capita) for respective years. In the square brackets with "R" letter are the rank values of the status among ten periods compared. 2005 [R3] 2006 [R6] 2007 [R5] 2008 [R7] 2009 [R10] 2010 [R4] 2011 [R9] 2012 [R8] 2013 [R2] 2014 [R1] ‐6% ‐4% ‐2% 0% 2% 4% 6% 0.298 0.299 0.300 0.301 0.302 0.303 0.304 0.305 Growth Rate Gini The statuses of 2008 and 2009 are beaten by more unequal statuses because of exceptionally low growth rates
find how statuses of a society are evaluated, and also have showed the results. • As substantial findings, we can give the following points. – Based on Japanese citizens’ evaluation criteria, generally speaking, more equal statuses are preferred collectively. – When there is a very high or low economic growth which is seen exceptional for contemporary Japan, such growth rate may change the ranking different from that corresponding to equality. 25
the aggregation is conducted “objectively,” the choice of the aggregation method is made by researchers’ subjective criteria. • Such a choice may need more elaborate discussion. – In estimating IEF, we utilized a model with fairly strong assumptions. • More desirably, we may be able to find the individual evaluations with weaker assumptions through experimental designs (Kuziemko et al. 2015; Lara and Shores 2017). 26
Stefanie Stantcheva. 2015. “How Elastic Are Preferences for Redistribution? Evidence from Randomized Survey Experiments.” American Economic Review 105 (4): 1478–1508. Lara, Bernardo, and Kenneth Shores. 2017. “Identifying Preferences for Equal Educational Opportunity, Income, and Income Equality.” Available at SSRN: https://ssrn.com/abstract=2996575. Data Sources Solt, Frederick. 2016. “The Standardized World Income Inequality Database.” Social Science Quarterly 97. SWIID Version 6.0, July 2017. World Bank. 2017. World Development Indicators. (Last Updated September 18, 2017; Datasets are retrieved from https://data.worldbank.org/country/japan).
[email protected] 28 Acknowledgement This study has been supported by JSPS KAKENHI Grant Numbers JP16H00287, JP11J06528, and JP18830018. The data for this analysis, Japan Household Panel Survey (JHPS/KHPS), was provided by the Keio University Panel Data Research Center. This work was supported by the MEXT‐Supported Program for the Strategic Research Foundation at Private Universities of Japan, 2014‐ 2018 (S1491003).
assumes individual redistributive preference may be affected by the perceived fact about relationship between redistribution and economic growth • Concretely, we assume each person has IEF (Individual Evaluation Function on Status of Society) and one prefers the policy which maximize the evaluated value under perceived restriction 30
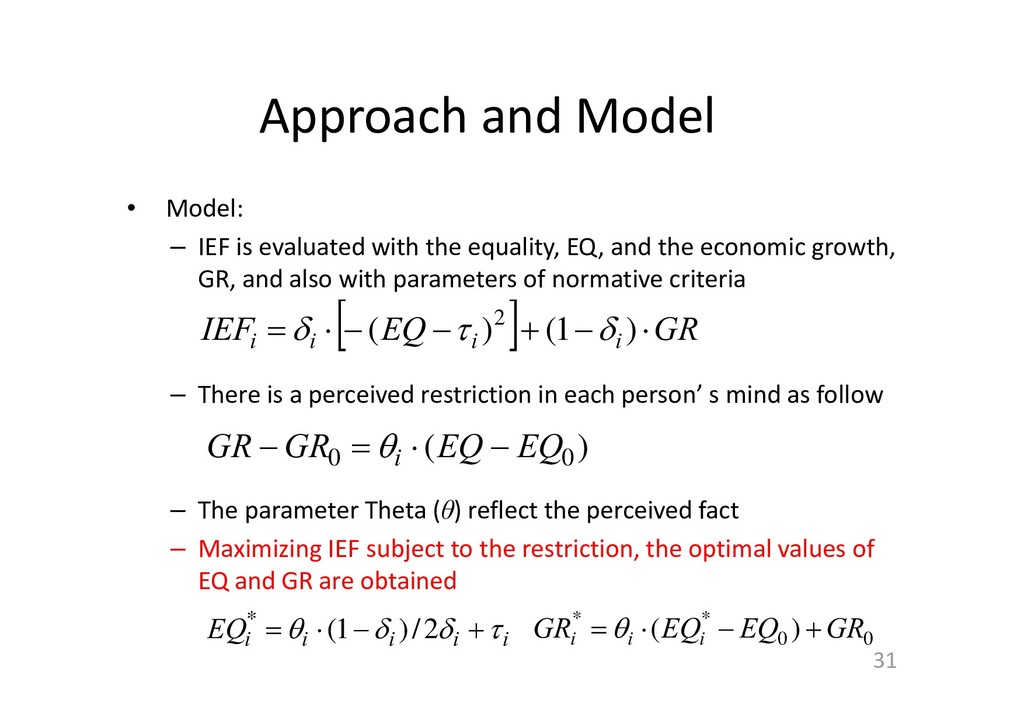
the equality, EQ, and the economic growth, GR, and also with parameters of normative criteria – There is a perceived restriction in each person’ s mind as follow – The parameter Theta (θ) reflect the perceived fact – Maximizing IEF subject to the restriction, the optimal values of EQ and GR are obtained 31 GR EQ IEF i i i i ) 1 ( ) ( 2 ) ( 0 0 EQ EQ GR GR i i i i i i EQ 2 / ) 1 ( * 0 0 * * ) ( GR EQ EQ GR i i i
IEF, the optimal points may vary according to the perceived restriction – “Gov’t should redistribute more because it enhances growth!” – “Gov’t should redistribute less because such a policy harms growth!” 32
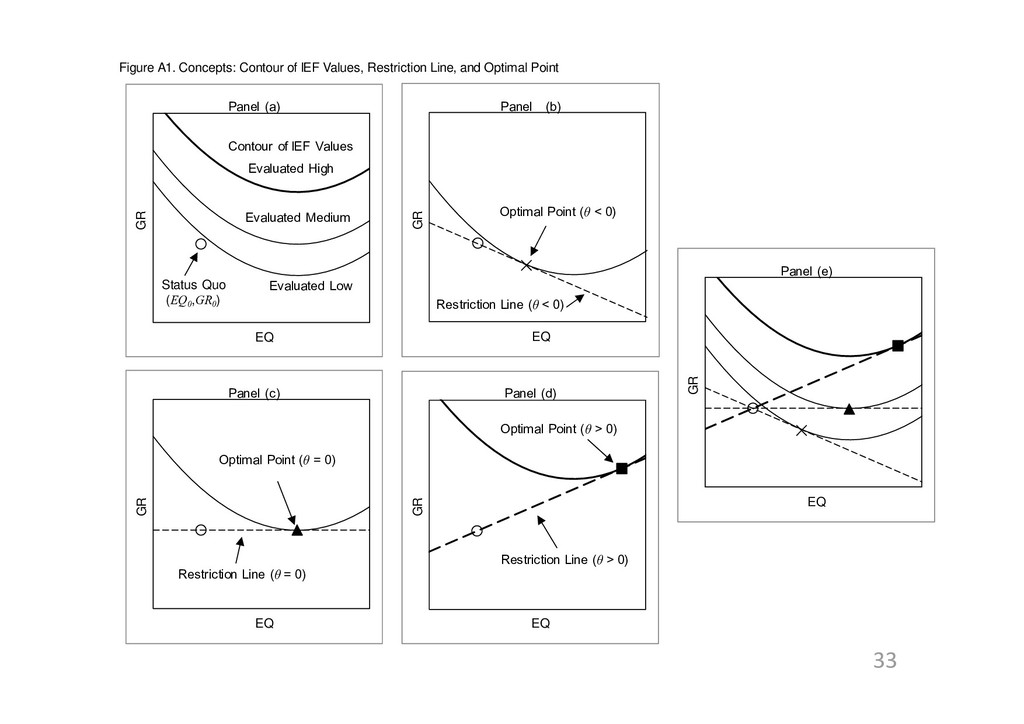
IEF Values, Restriction Line, and Optimal Point GR EQ Panel (b) GR EQ Panel (a) Restriction Line (θ < 0) Status Quo (EQ0 ,GR0 ) Contour of IEF Values Evaluated High Evaluated Medium Evaluated Low Optimal Point (θ < 0) GR EQ Panel (c) GR EQ Panel (d) Optimal Point (θ = 0) Restriction Line (θ = 0) Optimal Point (θ > 0) Restriction Line (θ > 0)
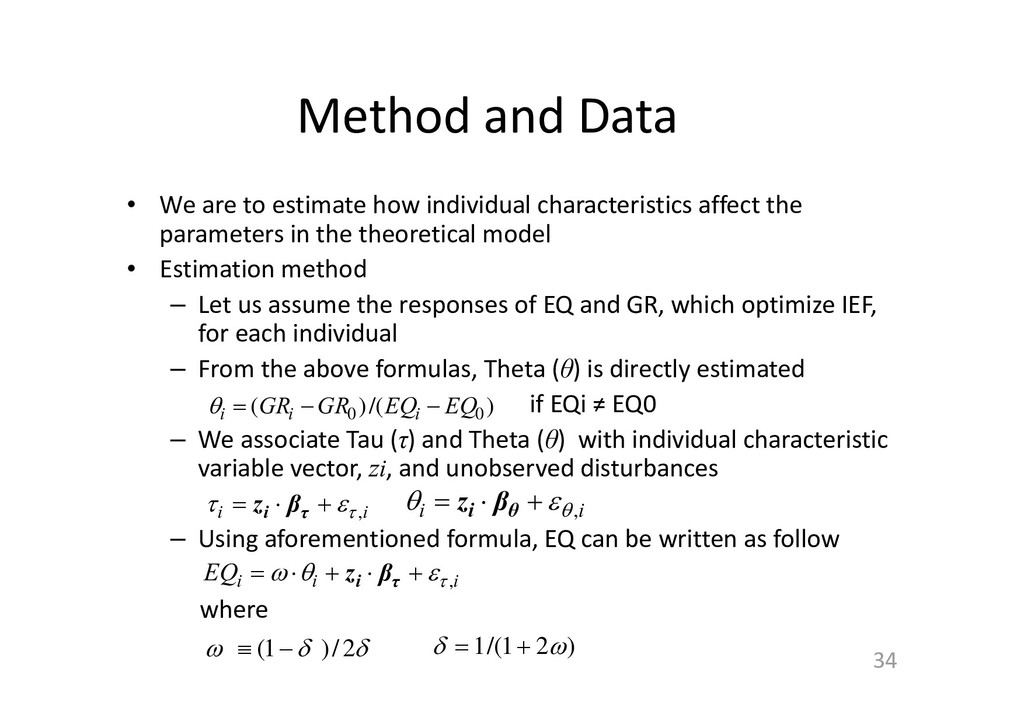
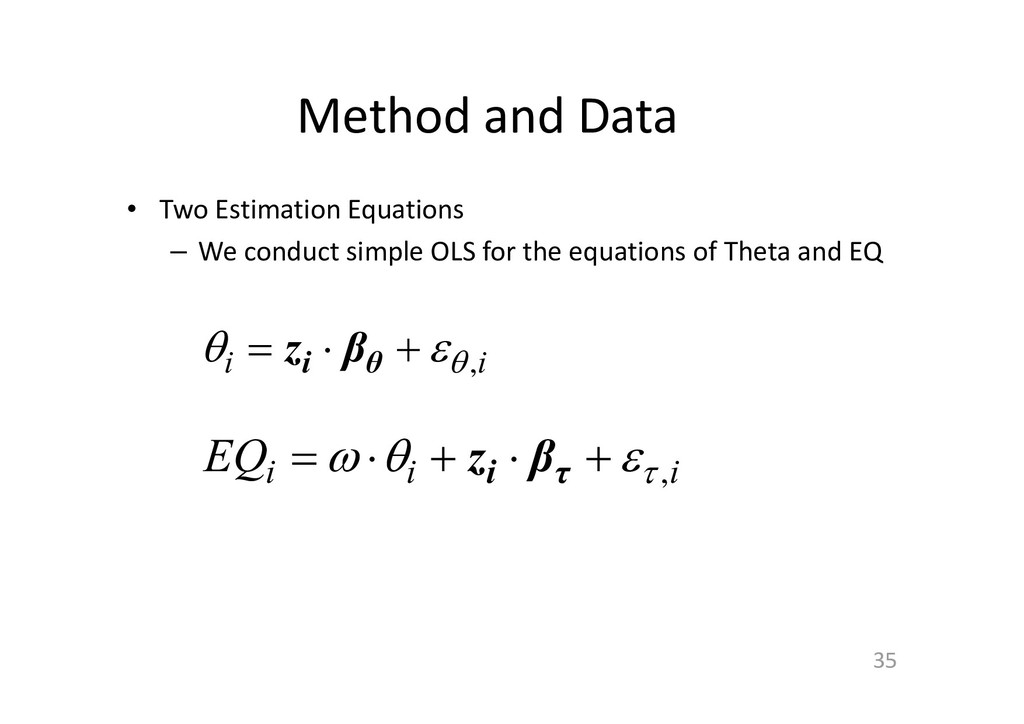
characteristics affect the parameters in the theoretical model • Estimation method – Let us assume the responses of EQ and GR, which optimize IEF, for each individual – From the above formulas, Theta (θ) is directly estimated if EQi ≠ EQ0 – We associate Tau (τ) and Theta (θ) with individual characteristic variable vector, zi, and unobserved disturbances – Using aforementioned formula, EQ can be written as follow where 34 ) /( ) ( 0 0 EQ EQ GR GR i i i i i , τ i β z i i , θ i β z i i i EQ , τ i β z 2 / ) 1 ( ) 2 1 /( 1
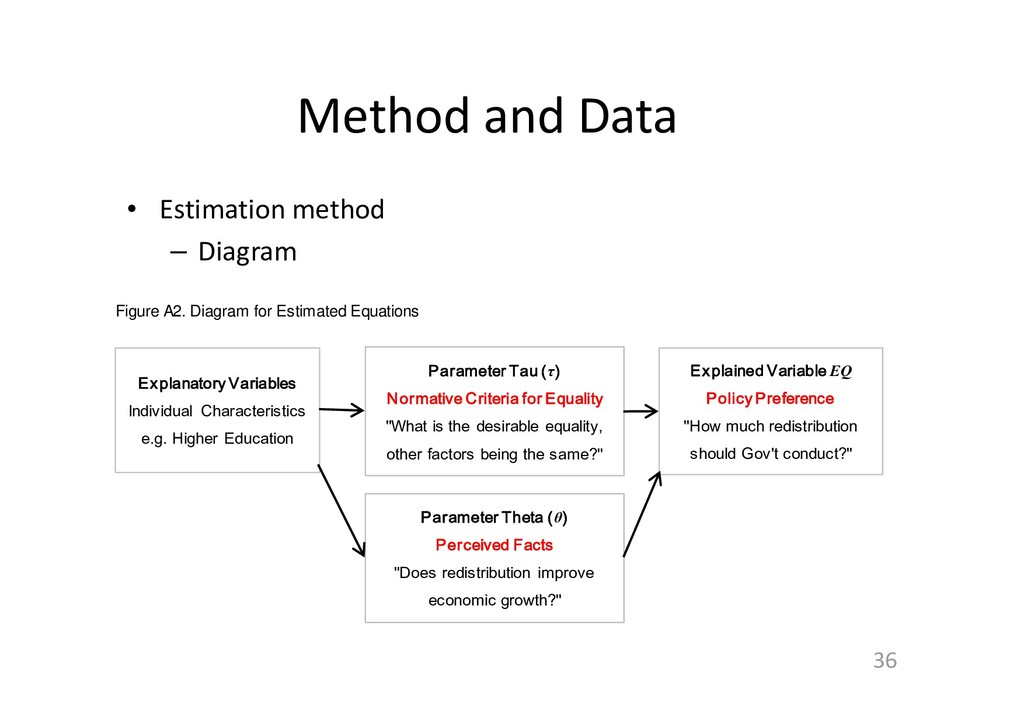
A2. Diagram for Estimated Equations Explained Variable EQ Policy Preference "How much redistribution should Gov't conduct?" Parameter Theta (θ) Perceived Facts "Does redistribution improve economic growth?" Parameter Tau (τ) Normative Criteria for Equality "What is the desirable equality, other factors being the same?" Explanatory Variables Individual Characteristics e.g. Higher Education
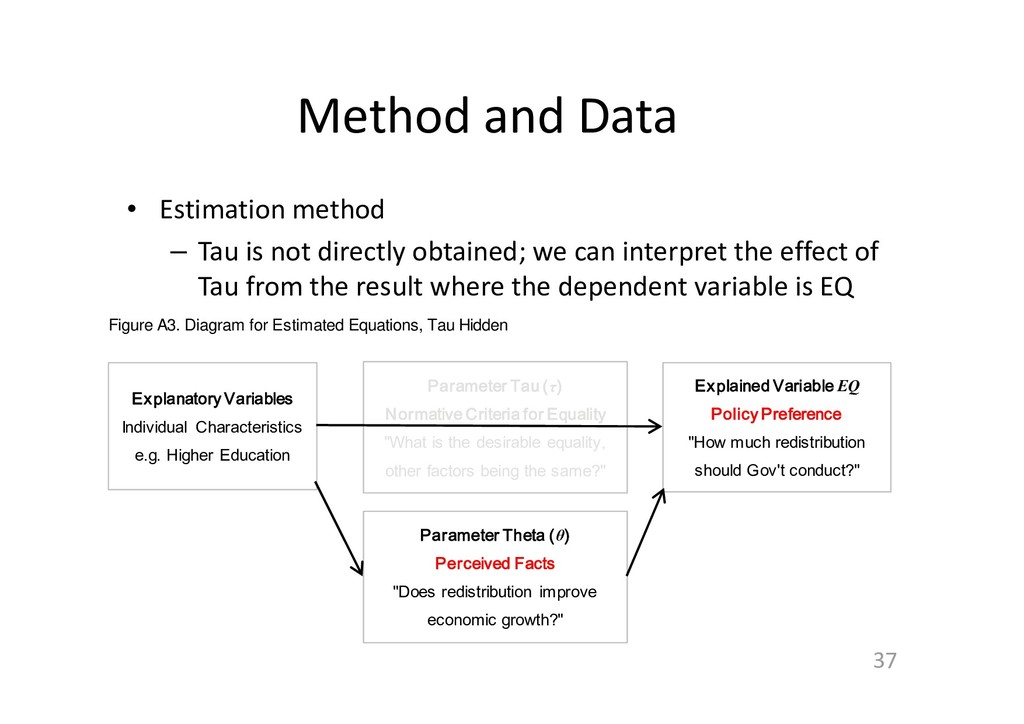
directly obtained; we can interpret the effect of Tau from the result where the dependent variable is EQ 37 Figure A3. Diagram for Estimated Equations, Tau Hidden Explained Variable EQ Policy Preference "How much redistribution should Gov't conduct?" Parameter Theta (θ) Perceived Facts "Does redistribution improve economic growth?" Parameter Tau (τ) Normative Criteria for Equality "What is the desirable equality, other factors being the same?" Explanatory Variables Individual Characteristics e.g. Higher Education
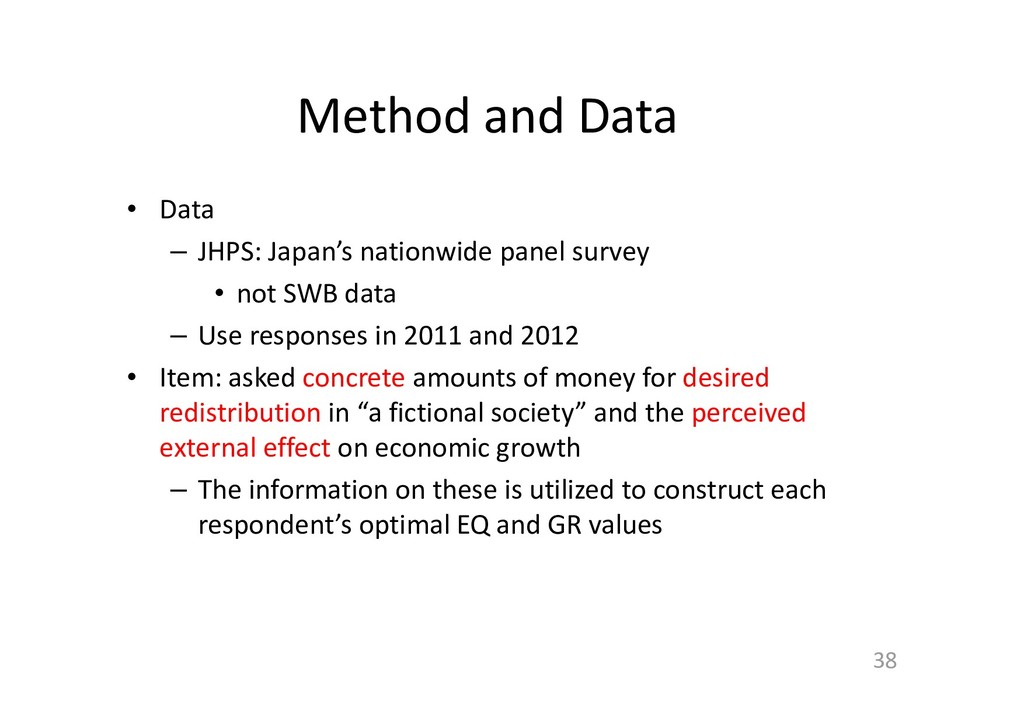
survey • not SWB data – Use responses in 2011 and 2012 • Item: asked concrete amounts of money for desired redistribution in “a fictional society” and the perceived external effect on economic growth – The information on these is utilized to construct each respondent’s optimal EQ and GR values 38
society includes households A, B, and C. Each household has 4 persons. The government collects taxes and social insurance, and uses them to ensure one’s living. If the government does not collect taxes or social insurance, household A’s income would be 3.5 million yen, B’s 7 million yen, C’s 12.5 million yen per annum. (1) How much in taxes and social insurance premiums do you think should be collected, and paid as benefits to the households? Answer each question in 10,000 yen units. Do not separate taxes and social insurance premiums, and answer the total amount. If you think no collection or payment is necessary, write 0.
someone from one of the households in this society became unemployed, and the income became 0, how much should the government pay the household per year to ensure their living? Write your answer in 10,000 yen units. (3) Some may think that if the government collects taxes, or pay benefits to every household, it affects economical growth. If the government in this fictional society decided to introduce the policy that you suggested in (1) and (2), compared with the government not taking any action, what would happen to economical growth? [Alternatives: 1. It would worsen dramatically. / 2. It would worsen slightly. / 3. It would not change. / 4. It would improve slightly. / 5. It would improve dramatically. / 6. Not sure. ]
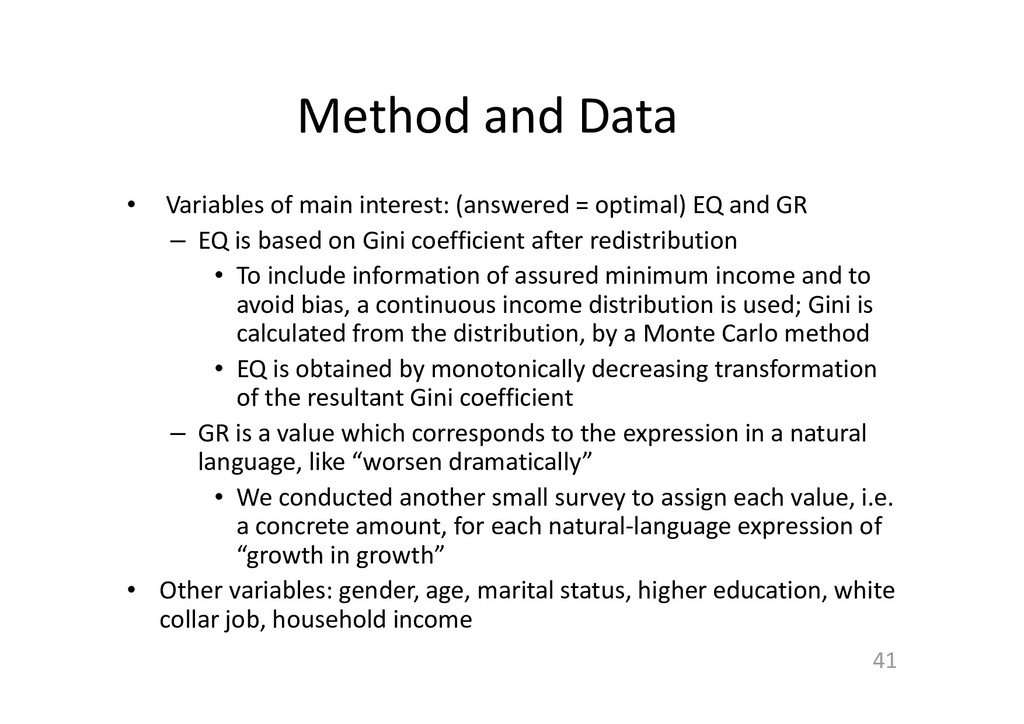
optimal) EQ and GR – EQ is based on Gini coefficient after redistribution • To include information of assured minimum income and to avoid bias, a continuous income distribution is used; Gini is calculated from the distribution, by a Monte Carlo method • EQ is obtained by monotonically decreasing transformation of the resultant Gini coefficient – GR is a value which corresponds to the expression in a natural language, like “worsen dramatically” • We conducted another small survey to assign each value, i.e. a concrete amount, for each natural‐language expression of “growth in growth” • Other variables: gender, age, marital status, higher education, white collar job, household income 41
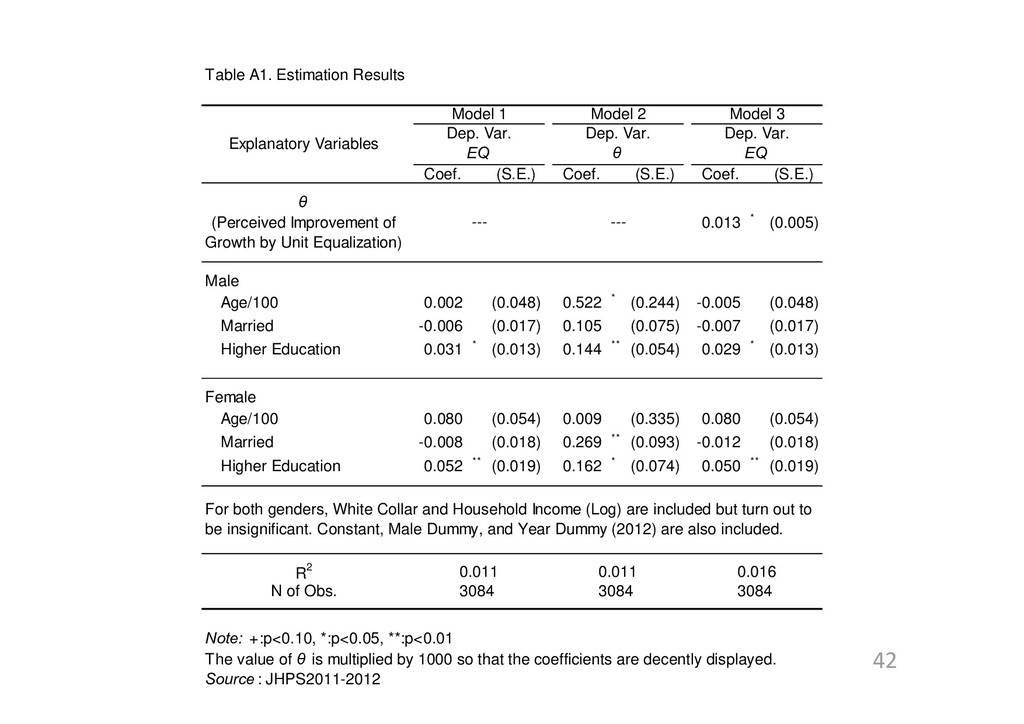
(S.E.) 0.013 * (0.005) Male Age/100 0.002 (0.048) 0.522 * (0.244) -0.005 (0.048) Married -0.006 (0.017) 0.105 (0.075) -0.007 (0.017) Higher Education 0.031 * (0.013) 0.144 ** (0.054) 0.029 * (0.013) Female Age/100 0.080 (0.054) 0.009 (0.335) 0.080 (0.054) Married -0.008 (0.018) 0.269 ** (0.093) -0.012 (0.018) Higher Education 0.052 ** (0.019) 0.162 * (0.074) 0.050 ** (0.019) Source : JHPS2011-2012 N of Obs. 3084 3084 3084 Note: +:p<0.10, *:p<0.05, **:p<0.01 The value of θ is multiplied by 1000 so that the coefficients are decently displayed. θ (Perceived Improvement of Growth by Unit Equalization) --- --- For both genders, White Collar and Household Income (Log) are included but turn out to be insignificant. Constant, Male Dummy, and Year Dummy (2012) are also included. R2 0.011 0.011 0.016 Explanatory Variables Model 1 Model 2 Model 3 Dep. Var. Dep. Var. Dep. Var. EQ θ EQ